
BELOIT, WI / ACCESSWIRE / October 19, 2021 / Blackhawk Bancorp, Inc. (OTCQX:BHWB) reported net income of $3.22 million for the quarter ended September 30, 2021, a 21% decrease compared to the $4.06 million earned the previous quarter, and a 13% increase compared to the $2.86 million earned the third quarter of 2020. Fully diluted earnings per share (EPS) for the quarter was $1.13, a decrease of $0.17 as compared to $1.30 for the quarter ended June 30, 2021 and an increase of $0.27, or 31%, as compared to $0.86 reported for the quarter ended September 30, 2020. The third quarter 2021 results produced a Return on Average Equity (ROAE) of 12.57% and a Return on Average Assets (ROAA) of 0.96%.
The decrease in earnings compared to the most recent quarter included a $0.39 million decrease in net interest income and a $0.85 million increase in operating expenses. These earnings declines were partially offset by a $0.07 million increase in noninterest income.
The increase in net income for the third quarter of 2021 compared to the third quarter of the prior year reflects a $2.62 million decrease in provision for loan losses. This improvement was partially offset by a $1.20 million decrease in revenue from the sale and servicing of mortgage loans and a $1.03 million increase in operating expenses. The increase in earnings per share compared to the third quarter of 2020 was boosted by the tender offer and stock repurchase, which was completed in the second quarter of 2021, where the Company repurchased 525,546 shares, or 15.6%, of its outstanding common stock.
For the nine months ended September 30, 2021, the company reported net income of $10.71 million, a 43% increase over the $7.50 million reported for the first nine months of 2020. Diluted earnings per share for the first nine months of 2021 increased by 53% to $3.45 compared to $2.26 for the first nine months of 2020. The Company's results for the first nine months of 2021 produced a return on average assets of 1.13% and a return on average equity of 13.49%.
"The solid third quarter results include continued recognition of Paycheck Protection Program (PPP) loan fees, low credit costs and robust mortgage banking activity," said Todd James, the Company's Chairman and CEO. "While pleased with overall financial results, loan growth continues to be a challenge, especially from our commercial and industrial borrowers, many of whom benefited from the PPP and are cautious about making capital investments due to challenges attracting labor and break-downs in the supply chain. These issues, combined with potential changes in the tax code, have some business owners deciding this is a good time to sell," added James. "Despite these challenges to growth, Blackhawk's continued to add experienced bankers and make investments to improve our operating systems and processes. We expect to be well positioned when economic activity begins to pick up," he said.
Total assets of the company increased by $176.4 million, or 15%, to $1.32 billion as of September 30, 2021 compared to $1.14 billion as of December 31, 2020. Total gross loans decreased by $9.5 million, or 1%, and total investment securities increased $120.4 million, or 34%, during the first nine months of 2021. Total deposits increased by $181.8 million, or 18%, to $1.17 billion compared to $987.3 million at the end of 2020.
Net Interest Income
Net interest income for the third quarter of 2021 totaled $9.77 million, a decrease of $0.39 million, or 4%, compared to the second quarter of 2021, and down $0.1 million, or 1%, compared to the third quarter of last year. The net interest margin was 3.11% for the third quarter of 2021 as compared to 3.37% for the quarter ended June 30, 2021, and 3.83% for the third quarter of the prior year.
The decrease in net interest income and the net interest margin compared to the third quarter of last year is primarily the result of declining yields on earning assets driven by the pro-longed low interest rate environment. The tax equivalent yield on earning assets has dropped seventy-nine basis points to 3.34%, compared to 4.13% for the third quarter of 2020, while at the same time the cost of deposits decreased only ten basis points to .14% from .24% the same quarter a year ago. Like most banks, Blackhawk has seen a significant influx of deposits and slow loan growth due to the unprecedented level of Federal stimulus in response to the pandemic. Average total deposits for the third quarter of 2021 increased by $238.7 million to $1.18 billion compared to $943.8 million in the third quarter of 2020. This deposit growth has led to increases of $161.9 million and $77.3 million in average investment securities and funds held in interest-bearing deposits, respectively, compared to the third quarter of the prior year.
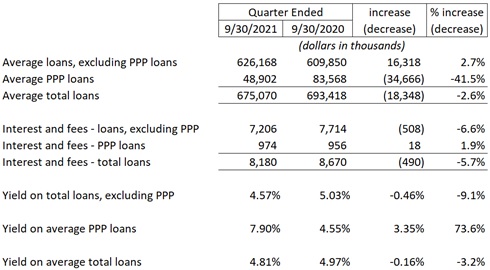
While average total loans for the third quarter of 2021 decreased by $18.3 million, or 3%, compared to the third quarter of the prior year, the decrease was due to forgiveness of PPP loans. The table below reflects the average balance, related interest income and the respective yields for all loans, PPP loans, and loans excluding PPP for the third quarter of 2021 compared to the same quarter the year before.
Net interest income for the nine months ended September 30, 2021, increased by $1.25 million, or 4%, to $29.65 million as compared to $28.41 million for the first nine months of 2020. The net interest margin for the first nine months of 2021 decreased by 57 basis points to 3.32% compared to 3.89% for the first nine months of 2020. The increase in net interest income was primarily due to a $1.48 million increase in PPP loan fees recognized as unamortized fees are recognized when forgiveness is granted. At September 30, 2021 $1.44 million of unamortized PPP fees remain on the Company's balance sheet. The decrease in the net interest margin is driven by the pro-longed low interest rate environment and influx of deposits due to Federal pandemic stimulus programs. For the nine months ended September 30, 2021 average total deposits increased by $224.3 million, or 25%, to $1.13 billion compared to $901.5 million the first nine months of 2020. While the Company was able to achieve a twenty basis point decrease in the cost of deposits to 0.15% compared to 0.35% for the nine months ended September 30, 2020; the decrease was more than offset by a seventy-five basis point decrease in the yield on average total earning assets to 3.54% as compared to 4.29% for the first nine months of the prior year. The excess liquidity from deposit growth has been deployed in the investment portfolio or held in cash equivalent investments.
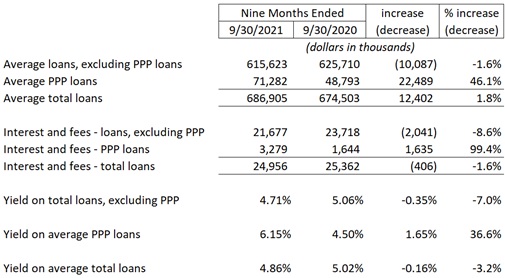
The table below reflects the average balance, related interest income and the respective yields for all loans, PPP loans, and loans excluding PPP for the nine months ended September 30, 2021 compared to the first three quarters of 2020.
Provision for Loan Losses and Asset Quality
There was no provision for loan losses recorded for the quarter ended September 30, 2021 or June 30, 2021, as compared to $2.62 million for the quarter ended September 30, 2020. The decreased provision reflects an improved credit outlook, especially as it relates to pandemic related losses. The Company has not released any reserves as management still believes there is continued uncertainty related to the future course of the pandemic, labor challenges and the impact of inflation and supply chain issues on the Company's customer base. Net charge offs for the third quarter were near zero.
Total nonperforming assets, which include troubled debt restructures performing in accordance with their modified terms, equaled $9.8 million as of September 30, 2021, as compared to $10.2 million as of June 30, 2021, and $11.0 million at September 30, 2020. At September 30, 2021, the ratio of nonperforming loans to total loans equaled 1.46%, as compared to 1.50% at June 30, 2021, and 1.59% at September 30, 2020. The allowance for loan losses to total loans was 1.68% as of September 30, 2021, as compared to 1.66% at June 30, 2021, and 1.44% as of September 30, 2020. The ratio of the allowance for loan losses to nonperforming loans increased to 114.5% as of September 30, 2021, as compared to 110.2% at June 30, 2021, and 90.8% at September 30, 2020. All but $2.4 million of credits that were granted modifications for COVID relief have been returned to normal payments, or are included in the nonperforming asset numbers above.
Non-Interest Income and Operating Expenses
Non-interest income for the quarter ended September 30, 2021 totaled $4.76 million, a $0.07 million increase compared to $4.69 million the prior quarter, and a $0.91 million decrease from the $5.67 million recorded in the third quarter of 2020. The decrease in non-interest income compared to the third quarter of 2020 was due to a $1.20 million decrease in revenue from the sale and servicing of mortgage loans, which was partially offset by a $0.14 million increase in debit card revenue.
Non-interest income for the first nine months of 2021 increased $0.98 million, or 7%, to $14.76 million as compared to $13.78 million for the first nine months of 2020, including a $0.63 million increase in debit card interchange fees.
Operating expenses for the quarter ended September 30, 2021 totaled $10.32 million, an increase of $0.85 million, or 9%, compared to the quarter ended June 31, 2021, and increased by $1.03 million, or 11%, compared to the third quarter of 2020. The increase compared to the third quarter of 2020 includes $0.15 million in other expense, reflecting non-recurring donations.
Operating expenses for the nine-month period ended September 30, 2021, totaled $29.77 million, a $2.98 million, or 11%, increase over the first nine months of 2020.
About Blackhawk Bancorp
Blackhawk Bancorp, Inc. is headquartered in Beloit, Wisconsin and is the parent company of Blackhawk Bank. The combined entity operates eleven full-service banking centers and a dedicated commercial office, which are located in Rock County, Wisconsin and the Illinois counties of Winnebago, Boone, McHenry, Lake, and Kane. The company offers a variety of value-added consultative services to its business customers and their employees related to the financial products it provides.
Disclosures Regarding non-GAAP Measures
This report refers to financial measures that are identified as non-GAAP that the Company believes help to evaluate and measure the Company's performance, including the presentation of the net interest margin ratio and efficiency ratio calculations on a taxable-equivalent basis. Non-GAAP measures are also used to assist investor comparison by identifying nonrecurring events such as acquisition-related expenses, nonrecurring securities gains and the impact such items have on the performance measures of return on average assets, return on average equity, diluted earnings per share, and the efficiency ratio. This supplemental information should not be considered in isolation or as a substitute for the related GAAP measures.
Forward-Looking Statements
When used in this communication, the words "believes," "expects," "likely", "would", and similar expressions are intended to identify forward-looking statements. The company's actual results may differ materially from those described in the forward-looking statements. Factors which could cause such a variance to occur include, but are not limited to: heightened competition; adverse state and federal regulation; failure to obtain new or retain existing customers; ability to attract and retain key executives and personnel; changes in interest rates; unanticipated changes in industry trends; unanticipated changes in credit quality and risk factors, including general economic conditions particularly in the Company's markets; potential deterioration in real estate values, success in gaining regulatory approvals when required; changes in the Federal Reserve Board monetary policies; unexpected outcomes of new and existing litigation in which Blackhawk or its subsidiaries, officers, directors or employees is named defendants; technological changes; changes in accounting principles generally accepted in the United States; changes in assumptions or conditions affecting the application of "critical accounting policies"; inability to recover previously recorded losses as anticipated, and the inability of third party vendors to perform critical services for the company or its customers. The inclusion of forward-looking information should not be construed as a representation by the Company or any person that future events or plans contemplated by the Company will be achieved. The Company undertakes no obligation to publicly update or revise any forward-looking statements whether as a result of new information or otherwise.
Further information is available on the company's website at www.blackhawkbank.com .
Blackhawk Bancorp, Inc.
Todd J. James, Chairman & CEO
tjames@blackhawkbank.com
Matthew McDonnell, SVP & CFO
mmcdonnell@blackhawkbank.com
Phone: (608) 364-8911
BLACKHAWK BANCORP, INC. AND SUBSIDIARIES
CONSOLIDATED BALANCE SHEETS
SEPTEMBER 30, 2021 AND DECEMBER 31, 2020
(UNAUDITED)
| September 30, | December 31, | |||||||
| Assets | 2021 | 2020 | ||||||
| (Dollars in thousands, except | ||||||||
| share and per share data) | ||||||||
| Cash and due from banks | $ | 16,536 | $ | 12,012 | ||||
| Interest-bearing deposits in banks and other institutions | 101,310 | 42,119 | ||||||
| Total cash and cash equivalents | 117,846 | 54,131 | ||||||
| Certificates of deposit in banks and other institutions | 3,412 | 4,159 | ||||||
| Equity securities at fair value | 2,555 | 2,517 | ||||||
| Securities available-for-sale | 469,917 | 349,565 | ||||||
| Loans held for sale | 6,029 | 6,096 | ||||||
| Federal Home Loan Bank stock, at cost | 2,150 | 2,150 | ||||||
| Loans, less allowance for loan losses of $11,224 and $10,764 | ||||||||
| at September 30, 2021 and December 31, 2020, respectively | 652,294 | 662,225 | ||||||
| Premises and equipment, net | 20,906 | 20,254 | ||||||
| Goodwill and core deposit intangible | 11,723 | 12,018 | ||||||
| Mortgage servicing rights | 3,756 | 3,409 | ||||||
| Cash surrender value of bank-owned life insurance | 11,363 | 11,126 | ||||||
| Other assets | 16,043 | 13,949 | ||||||
| Total assets | $ | 1,317,994 | $ | 1,141,599 | ||||
| Liabilities and Stockholders' Equity | ||||||||
| Liabilities | ||||||||
| Deposits: | ||||||||
| Noninterest-bearing | $ | 349,827 | $ | 268,866 | ||||
| Interest-bearing | 819,258 | 718,388 | ||||||
| Total deposits | 1,169,085 | 987,254 | ||||||
| Subordinated debentures and notes (including $1,031 at fair value at | ||||||||
| September 30, 2021 and December 31, 2020) | 20,155 | 5,155 | ||||||
| Senior secured term note | 11,667 | 12,833 | ||||||
| Other borrowings | 5,000 | 14,000 | ||||||
| Other liabilities | 11,585 | 10,602 | ||||||
| Total liabilities | 1,217,492 | 1,029,844 | ||||||
| Stockholders' equity | ||||||||
| Common stock, $0.01 par value, 10,000,000 shares authorized; | ||||||||
| 3,479,069 and 3,435,348 shares issued as of September 30, 2021 and | ||||||||
| December 31, 2020, respectively | 35 | 35 | ||||||
| Additional paid-in capital | 35,665 | 35,062 | ||||||
| Retained earnings | 79,388 | 69,676 | ||||||
| Treasury stock, 630,991 and 62,999 shares at cost as of September 30, 2021 | ||||||||
| and December 31, 2020, respectively | (18,951 | ) | (941 | ) | ||||
| Accumulated other comprehensive income (loss) | 4,365 | 7,923 | ||||||
| Total stockholders' equity | 100,502 | 111,755 | ||||||
| Total liabilities and stockholders' equity | $ | 1,317,994 | $ | 1,141,599 | ||||
BLACKHAWK BANCORP, INC. AND SUBSIDIARIES
CONSOLIDATED STATEMENTS OF INCOME
(UNAUDITED)
| Nine months ended September 30, | ||||||||
| 2021 | 2020 | |||||||
| (Amounts in thousands, except per share data) | ||||||||
| Interest Income: | ||||||||
| Interest and fees on loans | $ | 24,956 | $ | 25,362 | ||||
| Interest and dividends on available-for-sale securities: | ||||||||
| Taxable | 5,309 | 4,729 | ||||||
| Tax-exempt | 1,182 | 1,067 | ||||||
| Interest on deposits in other financial institutions | 150 | 244 | ||||||
| Total interest income | 31,597 | 31,402 | ||||||
| Interest Expense: | ||||||||
| Interest on deposits | 1,258 | 2,381 | ||||||
| Interest on subordinated debentures | 353 | 141 | ||||||
| Interest on senior secured term note | 313 | 385 | ||||||
| Interest on other borrowings | 21 | 88 | ||||||
| Total interest expense | 1,945 | 2,995 | ||||||
| Net interest income before provision for loan losses | 29,652 | 28,407 | ||||||
| Provision for loan losses | 500 | 5,885 | ||||||
| Net interest income after provision for loan losses | 29,152 | 22,522 | ||||||
| Noninterest Income: | ||||||||
| Service charges on deposits accounts | 2,140 | 2,254 | ||||||
| Net gain on sale of loans | 6,726 | 7,509 | ||||||
| Net loan servicing income | 495 | (254 | ) | |||||
| Debit card interchange fees | 3,392 | 2,759 | ||||||
| Net gains on sales of securities available-for-sale | - | 107 | ||||||
| Net other gains (losses) | 101 | 64 | ||||||
| Increase in cash surrender value of bank-owned life insurance | 237 | 235 | ||||||
| Change in value of equity securities | (12 | ) | 77 | |||||
| Other | 1,685 | 1,030 | ||||||
| Total noninterest income | 14,764 | 13,781 | ||||||
| Noninterest Expenses: | ||||||||
| Salaries and employee benefits | 17,605 | 16,097 | ||||||
| Occupancy and equipment | 3,547 | 3,293 | ||||||
| Data processing | 1,921 | 1,700 | ||||||
| Debit card processing and issuance | 1,417 | 1,200 | ||||||
| Advertising and marketing | 310 | 222 | ||||||
| Amortization of core deposit intangible | 294 | 330 | ||||||
| Professional fees | 1,224 | 1,157 | ||||||
| Office Supplies | 244 | 273 | ||||||
| Telephone | 425 | 437 | ||||||
| Other | 2,785 | 2,083 | ||||||
| Total noninterest expenses | 29,772 | 26,792 | ||||||
| Income before income taxes | 14,144 | 9,511 | ||||||
| Provision for income taxes | 3,437 | 2,011 | ||||||
| Net income | $ | 10,707 | $ | 7,500 | ||||
| Key Ratios | ||||||||
| Basic Earnings Per Common Share | $ | 3.45 | $ | 2.26 | ||||
| Diluted Earnings Per Common Share | 3.45 | 2.26 | ||||||
| Dividends Per Common Share | 0.33 | 0.33 | ||||||
| Net Interest Margin (1) | 3.32 | % | 3.89 | % | ||||
| Efficiency Ratio (1)(2) | 67.01 | % | 63.44 | % | ||||
| Return on Assets | 1.13 | % | 0.95 | % | ||||
| Return on Common Equity | 13.49 | % | 9.69 | % | ||||
(1) Non-GAAP Presentations: Management discloses certain non-GAAP financial measures to evaluate and measure the Company's performance, including the presentation of the net interest margin and efficiency ratio calculations on a taxable equivalent basis ("TE"). The net interest margin ratio is calculated by dividing net interest income on a tax equivalent basis by average earning assets for the period. Management believes this measure provides investors with information regarding comparative balance sheet profitability.
(2) The efficiency ratio is calculated as noninterest expense divided by the sum of net interest income on a TE basis, noninterest income less any securities gains (losses) or other gains (losses), and also includes a TE adjustment on the increases in cash surrender value of bank-owned life insurance.
BLACKHAWK BANCORP, INC. AND SUBSIDIARIES
CONSOLIDATED STATEMENTS OF INCOME
(UNAUDITED)
| For the Quarter Ended | ||||||||||||||||||||
| September 30, | June 30, | March 31, | December 31, | September 30, | ||||||||||||||||
| 2021 | 2021 | 2021 | 2020 | 2020 | ||||||||||||||||
| (Dollars in thousands, except per share data) | (Dollars in thousands, except per share data) | |||||||||||||||||||
| Interest Income: | ||||||||||||||||||||
| Interest and fees on loans | $ | 8,180 | $ | 8,621 | $ | 8,155 | $ | 8,079 | $ | 8,671 | ||||||||||
| Interest on available-for-sale securities: | ||||||||||||||||||||
| Taxable | 1,830 | 1,759 | 1,721 | 1,598 | 1,607 | |||||||||||||||
| Tax-exempt | 419 | 378 | 384 | 384 | 372 | |||||||||||||||
| Interest on deposits in other financial institutions | 61 | 48 | 41 | 33 | 41 | |||||||||||||||
| Total interest income | 10,490 | 10,806 | 10,301 | 10,094 | 10,691 | |||||||||||||||
| Interest Expense: | ||||||||||||||||||||
| Interest on deposits | 421 | 421 | 415 | 458 | 565 | |||||||||||||||
| Interest on subordinated debentures | 195 | 117 | 41 | 41 | 42 | |||||||||||||||
| Interest on senior secured term note | 103 | 104 | 107 | 113 | 119 | |||||||||||||||
| Interest on other borrowings | - | - | 20 | 40 | 47 | |||||||||||||||
| Total interest expense | 719 | 642 | 583 | 652 | 773 | |||||||||||||||
| Net interest income before provision for loan losses | 9,771 | 10,164 | 9,718 | 9,442 | 9,918 | |||||||||||||||
| Provision for loan losses | - | - | 500 | 1,715 | 2,615 | |||||||||||||||
| Net interest income after provision for loan losses | 9,771 | 10,164 | 9,218 | 7,727 | 7,303 | |||||||||||||||
| Noninterest Income: | ||||||||||||||||||||
| Service charges on deposits accounts | 787 | 663 | 690 | 781 | 747 | |||||||||||||||
| Net gain on sale of loans | 2,147 | 2,217 | 2,362 | 3,572 | 3,412 | |||||||||||||||
| Net loan servicing income | 90 | 36 | 369 | (177 | ) | 26 | ||||||||||||||
| Debit card interchange fees | 1,146 | 1,218 | 1,027 | 979 | 1,002 | |||||||||||||||
| Net gains on sales of securities available-for-sale | - | - | - | 428 | - | |||||||||||||||
| Net other gains (losses) | 52 | 7 | 42 | - | 58 | |||||||||||||||
| Increase in cash surrender value of bank-owned life insurance | 78 | 72 | 87 | 75 | 76 | |||||||||||||||
| Other | 457 | 479 | 458 | 310 | 344 | |||||||||||||||
| Total noninterest income | 4,757 | 4,692 | 5,035 | 5,968 | 5,665 | |||||||||||||||
| Noninterest Expenses: | ||||||||||||||||||||
| Salaries and employee benefits | 6,118 | 5,753 | 5,734 | 5,851 | 5,585 | |||||||||||||||
| Occupancy and equipment | 1,273 | 1,092 | 1,182 | 986 | 1,137 | |||||||||||||||
| Data processing | 689 | 641 | 591 | 683 | 629 | |||||||||||||||
| Debit card processing and issuance | 489 | 503 | 425 | 384 | 409 | |||||||||||||||
| Advertising and marketing | 141 | 70 | 99 | 75 | 87 | |||||||||||||||
| Amortization of intangibles | 96 | 96 | 104 | 107 | 107 | |||||||||||||||
| Professional fees | 434 | 399 | 390 | 373 | 386 | |||||||||||||||
| Office Supplies | 74 | 93 | 77 | 90 | 94 | |||||||||||||||
| Telephone | 139 | 144 | 141 | 140 | 138 | |||||||||||||||
| Other | 865 | 673 | 968 | 637 | 714 | |||||||||||||||
| Total noninterest expenses | 10,318 | 9,464 | 9,711 | 9,326 | 9,286 | |||||||||||||||
| Income before income taxes | 4,210 | 5,392 | 4,542 | 4,369 | 3,682 | |||||||||||||||
| Provision for income taxes | 988 | 1,337 | 1,112 | 1,021 | 819 | |||||||||||||||
| Net income | $ | 3,222 | $ | 4,055 | $ | 3,430 | $ | 3,348 | $ | 2,863 | ||||||||||
| Key Ratios | ||||||||||||||||||||
| Basic Earnings Per Common Share | $ | 1.13 | $ | 1.30 | $ | 1.02 | $ | 1.00 | $ | 0.86 | ||||||||||
| Diluted Earnings Per Common Share | 1.13 | 1.30 | 1.02 | 1.00 | 0.86 | |||||||||||||||
| Dividends Per Common Share | 0.11 | 0.11 | 0.11 | 0.11 | 0.11 | |||||||||||||||
| Book Value Per Common Share | 35.29 | 34.97 | 32.95 | 33.14 | 32.37 | |||||||||||||||
| Tangible Book Value Per Share | 31.17 | 30.81 | 29.40 | 29.57 | 28.74 | |||||||||||||||
| Number of Shares Outstanding | 2,848,078 | 2,842,828 | 3,359,613 | 3,372,349 | 3,302,316 | |||||||||||||||
| Average Number of Shares Outstanding | 2,848,109 | 3,118,265 | 3,372,684 | 3,360,579 | 3,332,071 | |||||||||||||||
| Net Interest Margin (1) | 3.11 | % | 3.37 | % | 3.52 | % | 3.63 | % | 3.83 | % | ||||||||||
| Efficiency Ratio (1)(2) | 70.70 | % | 63.28 | % | 65.53 | % | 61.80 | % | 59.39 | % | ||||||||||
| Return on Assets | 0.96 | % | 1.26 | % | 1.16 | % | 1.20 | % | 1.03 | % | ||||||||||
| Return on Common Equity | 12.57 | % | 15.74 | % | 12.44 | % | 12.08 | % | 10.64 | % | ||||||||||
| (1) Non-GAAP Presentations: Management discloses certain non-GAAP financial measures to evaluate and measure the Company's performance, including the presentation of net interest income, net interest margin and efficiency ratio calculations on a taxable equivalent basis ("TE"). The net interest margin is calculated by dividing net interest income on a TE basis by average earning assets for the period. Management believes this measure provides investors with information regarding comparative balance sheet profitability. | ||||||||||||||||||||
| (2) The efficiency ratio is calculated as noninterest expense divided by the sum of net interest income on an TE basis, noninterest income less any securities gains (losses) or other gains (losses), and also includes a TE adjustment on interest on tax-exempt securities, loans, and the increases in cash surrender value of bank-owned life insurance. | ||||||||||||||||||||
| (UNAUDITED) | As of | |||||||||||||||||||
| September 30, | June 30, | March 31, | December 31, | |||||||||||||||||
| 2021 | 2021 | 2021 | 2020 | 2020 | ||||||||||||||||
| Cash and due from banks | $ | 16,536 | $ | 16,418 | $ | 15,108 | $ | 12,012 | $ | 17,403 | ||||||||||
| Interest-bearing deposits in banks and other | 104,722 | 140,073 | 50,199 | 46,278 | 47,848 | |||||||||||||||
| Securities | 472,472 | 448,072 | 379,187 | 352,082 | 317,761 | |||||||||||||||
| Net loans/leases | 658,323 | 666,738 | 700,399 | 668,321 | 681,060 | |||||||||||||||
| Goodwill and core deposit intangible | 11,723 | 11,819 | 11,914 | 12,018 | 12,125 | |||||||||||||||
| Other assets | 54,218 | 53,629 | 50,826 | 50,888 | 50,105 | |||||||||||||||
| Total assets | $ | 1,317,994 | $ | 1,336,749 | $ | 1,207,633 | $ | 1,141,599 | $ | 1,126,302 | ||||||||||
| Deposits | $ | 1,169,085 | $ | 1,188,997 | $ | 1,068,197 | $ | 987,254 | $ | 960,773 | ||||||||||
| Subordinated debentures | 20,155 | 20,155 | 5,155 | 5,155 | 5,155 | |||||||||||||||
| Senior secured term note | 11,667 | 12,056 | 12,445 | 12,833 | 13,222 | |||||||||||||||
| Borrowings | 5,000 | 5,000 | 4,000 | 14,000 | 29,000 | |||||||||||||||
| Other liabilities | 11,585 | 11,131 | 7,138 | 10,602 | 10,161 | |||||||||||||||
| Stockholders' equity | 100,502 | 99,410 | 110,698 | 111,755 | 107,991 | |||||||||||||||
| Total liabilities and stockholders' equity | $ | 1,317,994 | $ | 1,336,749 | $ | 1,207,633 | $ | 1,141,599 | $ | 1,126,302 | ||||||||||
| ASSET QUALITY DATA | ||||||||||||||||||||
| (Amounts in thousands) | September 30, | June 30, | March 31, | December 31, | September 30, | |||||||||||||||
| 2021 | 2021 | 2021 | 2020 | 2020 | ||||||||||||||||
| Non-accrual loans | $ | 7,827 | $ | 8,228 | $ | 6,361 | $ | 7,013 | $ | 8,584 | ||||||||||
| Accruing loans past due 90 days or more | - | - | - | - | 196 | |||||||||||||||
| Troubled debt restructures - accruing | 1,975 | 1,958 | 1,996 | 2,057 | 2,176 | |||||||||||||||
| Total nonperforming loans | $ | 9,802 | $ | 10,186 | $ | 8,357 | $ | 9,070 | $ | 10,956 | ||||||||||
| Other real estate owned | - | - | - | 1 | 1 | |||||||||||||||
| Total nonperforming assets | $ | 9,802 | $ | 10,186 | $ | 8,357 | $ | 9,071 | $ | 10,957 | ||||||||||
| Total loans | $ | 669,547 | $ | 677,967 | $ | 711,515 | $ | 679,085 | $ | 691,003 | ||||||||||
| Allowance for loan losses | 11,224 | 11,229 | 11,116 | 10,764 | 9,943 | |||||||||||||||
| Loans, less allowance for loan losses | $ | 658,323 | $ | 666,738 | $ | 700,399 | $ | 668,321 | $ | 681,060 | ||||||||||
| Nonperforming Assets to total Assets | 0.74 | % | 0.76 | % | 0.69 | % | 0.79 | % | 0.97 | % | ||||||||||
| Nonperforming loans to total loans | 1.46 | % | 1.50 | % | 1.17 | % | 1.34 | % | 1.59 | % | ||||||||||
| Allowance for loan losses to total loans | 1.68 | % | 1.66 | % | 1.56 | % | 1.59 | % | 1.44 | % | ||||||||||
| Allowance for loan losses to nonperforming loans | 114.5 | % | 110.2 | % | 133.0 | % | 118.7 | % | 90.8 | % | ||||||||||
| For the Quarter Ended | ||||||||||||||||||||
| September 30, | June 30, | March 31, | December 31, | |||||||||||||||||
| ROLL FORWARD OF ALLOWANCE | 2021 | 2021 | 2021 | 2020 | 2020 | |||||||||||||||
| Beginning Balance | $ | 11,229 | $ | 11,116 | $ | 10,764 | $ | 9,943 | $ | 10,102 | ||||||||||
| Provision | - | - | 500 | 1,715 | 2,615 | |||||||||||||||
| Loans charged off | 103 | 61 | 582 | 1,334 | 2,892 | |||||||||||||||
| Loan recoveries | 98 | 174 | 434 | 440 | 118 | |||||||||||||||
| Net charge-offs | 5 | (113 | ) | 148 | 894 | 2,774 | ||||||||||||||
| Ending Balance | $ | 11,224 | $ | 11,229 | $ | 11,116 | $ | 10,764 | $ | 9,943 | ||||||||||
BLACKHAWK BANCORP, INC. AND SUBSIDIARIES
ANALYSIS of AVERAGE BALANCES & TAX EQUIVALENT INTEREST RATES
| Average Balance Sheet with Resultant Interest and Rates | ||||||||||||||||||||||||||||||||||||
| (Dollars in thousands - unaudited) | ||||||||||||||||||||||||||||||||||||
| (Yields on a tax-equivalent basis) (1) | For the Quarter Ended | |||||||||||||||||||||||||||||||||||
| September 30, 2021 | June 30, 2021 | September 30, 2020 | ||||||||||||||||||||||||||||||||||
| Average | Average | Average | Average | Average | Average | |||||||||||||||||||||||||||||||
| Balance | Interest | Rate | Balance | Interest | Rate | Balance | Interest | Rate | ||||||||||||||||||||||||||||
| Interest Earning Assets: | ||||||||||||||||||||||||||||||||||||
| Interest-bearing deposits and other | $ | 119,991 | $ | 61 | 0.20 | % | $ | 105,385 | $ | 48 | 0.18 | % | $ | 42,716 | $ | 41 | 0.38 | % | ||||||||||||||||||
| Investment securities: | ||||||||||||||||||||||||||||||||||||
| Taxable investment securities | 413,853 | 1,830 | 1.75 | % | 365,329 | 1,759 | 1.93 | % | 257,506 | 1,607 | 2.48 | % | ||||||||||||||||||||||||
| Tax-exempt investment securities | 52,663 | 420 | 4.05 | % | 52,197 | 378 | 3.73 | % | 47,090 | 372 | 4.09 | % | ||||||||||||||||||||||||
| Total Investment securities | 466,516 | 2,250 | 2.01 | % | 417,526 | 2,137 | 2.16 | % | 304,596 | 1,979 | 2.73 | % | ||||||||||||||||||||||||
| Loans | 675,070 | 8,180 | 4.81 | % | 700,109 | 8,621 | 4.94 | % | 693,418 | 8,670 | 4.97 | % | ||||||||||||||||||||||||
| Total Earning Assets | $ | 1,261,577 | $ | 10,491 | 3.34 | % | $ | 1,223,020 | $ | 10,806 | 3.58 | % | $ | 1,040,730 | $ | 10,690 | 4.13 | % | ||||||||||||||||||
| Allowance for loan losses | (11,229 | ) | (11,221 | ) | (11,018 | ) | ||||||||||||||||||||||||||||||
| Cash and due from banks | 16,821 | 17,124 | 18,901 | |||||||||||||||||||||||||||||||||
| Other assets | 61,274 | 58,008 | 58,022 | |||||||||||||||||||||||||||||||||
| Total Assets | $ | 1,328,443 | $ | 1,286,931 | $ | 1,106,635 | ||||||||||||||||||||||||||||||
| Interest Bearing Liabilities: | ||||||||||||||||||||||||||||||||||||
| Interest bearing checking accounts | $ | 300,935 | $ | 180 | 0.24 | % | $ | 302,946 | $ | 180 | 0.24 | % | $ | 292,875 | $ | 166 | 0.23 | % | ||||||||||||||||||
| Savings and money market deposits | 423,894 | 109 | 0.10 | % | 396,476 | 96 | 0.10 | % | 335,043 | 111 | 0.13 | % | ||||||||||||||||||||||||
| Time deposits | 76,682 | 133 | 0.69 | % | 77,155 | 145 | 0.75 | % | 91,366 | 288 | 1.25 | % | ||||||||||||||||||||||||
| Total interest bearing deposits | 801,511 | 422 | 0.21 | % | 776,577 | 421 | 0.22 | % | 719,284 | 565 | 0.31 | % | ||||||||||||||||||||||||
| Subordinated debentures and notes | 20,155 | 195 | 3.83 | % | 13,067 | 117 | 3.59 | % | 5,155 | 42 | 3.25 | % | ||||||||||||||||||||||||
| Borrowings | 16,670 | 103 | 2.45 | % | 16,501 | 104 | 2.51 | % | 42,637 | 165 | 1.54 | % | ||||||||||||||||||||||||
| Total Interest-Bearing Liabilities | $ | 838,336 | $ | 720 | 0.34 | % | $ | 806,145 | $ | 642 | 0.32 | % | $ | 767,076 | $ | 772 | 0.40 | % | ||||||||||||||||||
| Interest Rate Spread | 3.00 | % | 3.26 | % | 3.73 | % | ||||||||||||||||||||||||||||||
| Noninterest checking accounts | 381,046 | 371,146 | 224,552 | |||||||||||||||||||||||||||||||||
| Other liabilities | 7,381 | 6,283 | 7,950 | |||||||||||||||||||||||||||||||||
| Total liabilities | 1,226,763 | 1,183,574 | 999,578 | |||||||||||||||||||||||||||||||||
| Total Stockholders' equity | 101,680 | 103,357 | 107,057 | |||||||||||||||||||||||||||||||||
| Total Liabilities and | ||||||||||||||||||||||||||||||||||||
| Stockholders' Equity | $ | 1,328,443 | $ | 1,286,931 | $ | 1,106,635 | ||||||||||||||||||||||||||||||
| Net Interest Income/Margin | $ | 9,771 | 3.11 | % | $ | 10,164 | 3.37 | % | $ | 9,918 | 3.83 | % | ||||||||||||||||||||||||
(1) Management discloses certain non-GAAP financial measures to evaluate and measure the Company's performance including a presentation of net interest income with a net interest margin ratio on a tax-equivalent (TE) basis. The net interest margin is calculated by dividing net interest income on a TE basis by average earning assets for the period. Management believes this measure provides investors with information regarding comparative balance sheet profitability. Nonaccrual loans are included in the above-stated average balances.
BLACKHAWK BANCORP, INC. AND SUBSIDIARIES
AVERAGE BALANCE SHEET WITH RESULTANT INTEREST AND RATES
Average Balance Sheet with Resultant Interest and Rates | ||||||||||||||||||||||||||
| (Amounts in thousands) | ||||||||||||||||||||||||||
| (yields on a tax-equivalent basis)(1) | For the Nine Months Ended | |||||||||||||||||||||||||
| September 30, 2021 | September 30, 2020 | |||||||||||||||||||||||||
| Average | Average | Average | Average | |||||||||||||||||||||||
| Balance | Interest | Rate | Balance | Interest | Rate | |||||||||||||||||||||
| Interest Earning Assets: | ||||||||||||||||||||||||||
| Interest-bearing deposits and other | $ | 99,997 | $ | 150 | 0.20 | % | $ | 32,518 | $ | 244 | 1.00 | % | ||||||||||||||
| Investment securities: | ||||||||||||||||||||||||||
| Taxable investment securities | 366,982 | 5,309 | 1.93 | % | 234,704 | 4,729 | 2.69 | % | ||||||||||||||||||
| Tax-exempt investment securities | 52,329 | 1,182 | 3.87 | % | 44,811 | 1,067 | 4.10 | % | ||||||||||||||||||
| Total Investment securities | 419,311 | 6,491 | 2.18 | % | 279,515 | 5,796 | 2.92 | % | ||||||||||||||||||
| Loans | 686,905 | 24,956 | 4.86 | % | 674,503 | 25,362 | 5.02 | % | ||||||||||||||||||
| Total Earning Assets | $ | 1,206,213 | $ | 31,597 | 3.54 | % | $ | 986,536 | $ | 31,402 | 4.29 | % | ||||||||||||||
| Allowance for loan losses | (11,176 | ) | (9,274 | ) | ||||||||||||||||||||||
| Cash and due from banks | 16,668 | 16,594 | ||||||||||||||||||||||||
| Other assets | 59,861 | 58,483 | ||||||||||||||||||||||||
| Total Assets | $ | 1,271,566 | $ | 1,052,339 | ||||||||||||||||||||||
| Interest Bearing Liabilities: | ||||||||||||||||||||||||||
| Interest bearing checking accounts | $ | 296,196 | $ | 521 | 0.23 | % | $ | 287,538 | $ | 657 | 0.31 | % | ||||||||||||||
| Savings and money market deposits | 392,575 | 290 | 0.10 | % | 307,807 | 578 | 0.25 | % | ||||||||||||||||||
| Time deposits | 78,529 | 447 | 0.76 | % | 102,306 | 1,146 | 1.50 | % | ||||||||||||||||||
| Total interest bearing deposits | 767,300 | 1,258 | 0.22 | % | 697,651 | 2,381 | 0.46 | % | ||||||||||||||||||
| Subordinated debentures | 12,847 | 353 | 3.67 | % | 5,155 | 141 | 3.64 | % | ||||||||||||||||||
| Borrowings | 19,811 | 334 | 2.25 | % | 35,584 | 473 | 1.78 | % | ||||||||||||||||||
| Total Interest-Bearing Liabilities | $ | 799,958 | $ | 1,945 | 0.32 | % | $ | 738,390 | $ | 2,995 | 0.54 | % | ||||||||||||||
| Interest Rate Spread | 3.22 | % | 3.75 | % | ||||||||||||||||||||||
| Noninterest checking accounts | 358,500 | 203,854 | ||||||||||||||||||||||||
| Other liabilities | 7,012 | 7,131 | ||||||||||||||||||||||||
| Total liabilities | 1,165,470 | 949,375 | ||||||||||||||||||||||||
| Total Stockholders' equity | 106,096 | 102,964 | ||||||||||||||||||||||||
| Total Liabilities and | ||||||||||||||||||||||||||
| Stockholders' Equity | $ | 1,271,566 | $ | 1,052,339 | ||||||||||||||||||||||
| Net Interest Income/Margin | $ | 29,652 | 3.32 | % | $ | 28,407 | 3.89 | % | ||||||||||||||||||
SOURCE: Blackhawk Bancorp, Inc.
View source version on accesswire.com:
https://www.accesswire.com/668816/Blackhawk-Bancorp-Announces-2021-Third-Quarter-Earnings
