
Semiconductor giant NVIDIA Corporation (NVDA) enjoys a central position in the current Artificial Intelligence (AI) boom by virtue of its Graphics Processing Units (GPUs). Underscoring its market position, NVDA’s revenue of $13.51 billion for the fiscal second quarter topped the $11.22 billion analysts’ estimate, while its adjusted EPS of $2.70 beat the $2.09 estimate.
However, last month, the United States expanded its restriction on exporting sophisticated NVDA AI chips beyond China to other regions, including some Middle Eastern countries. On the other hand, the company stated that it does not have an “immediate material impact.”
Meanwhile, the semiconductor industry is undergoing a slump. The worldwide sales of semiconductors came in at $124.50 billion for the second quarter of 2023, registering a 17.3% decrease from the second quarter of 2022.
Given this backdrop, let’s look at the trends of NVDA’s key financial metrics to understand why it could be wise to wait for a better entry point in the stock.
Examining NVIDIA Corporation's Financial Performance: An In-Depth Analysis of Multiple Metrics from 2020 to 2023
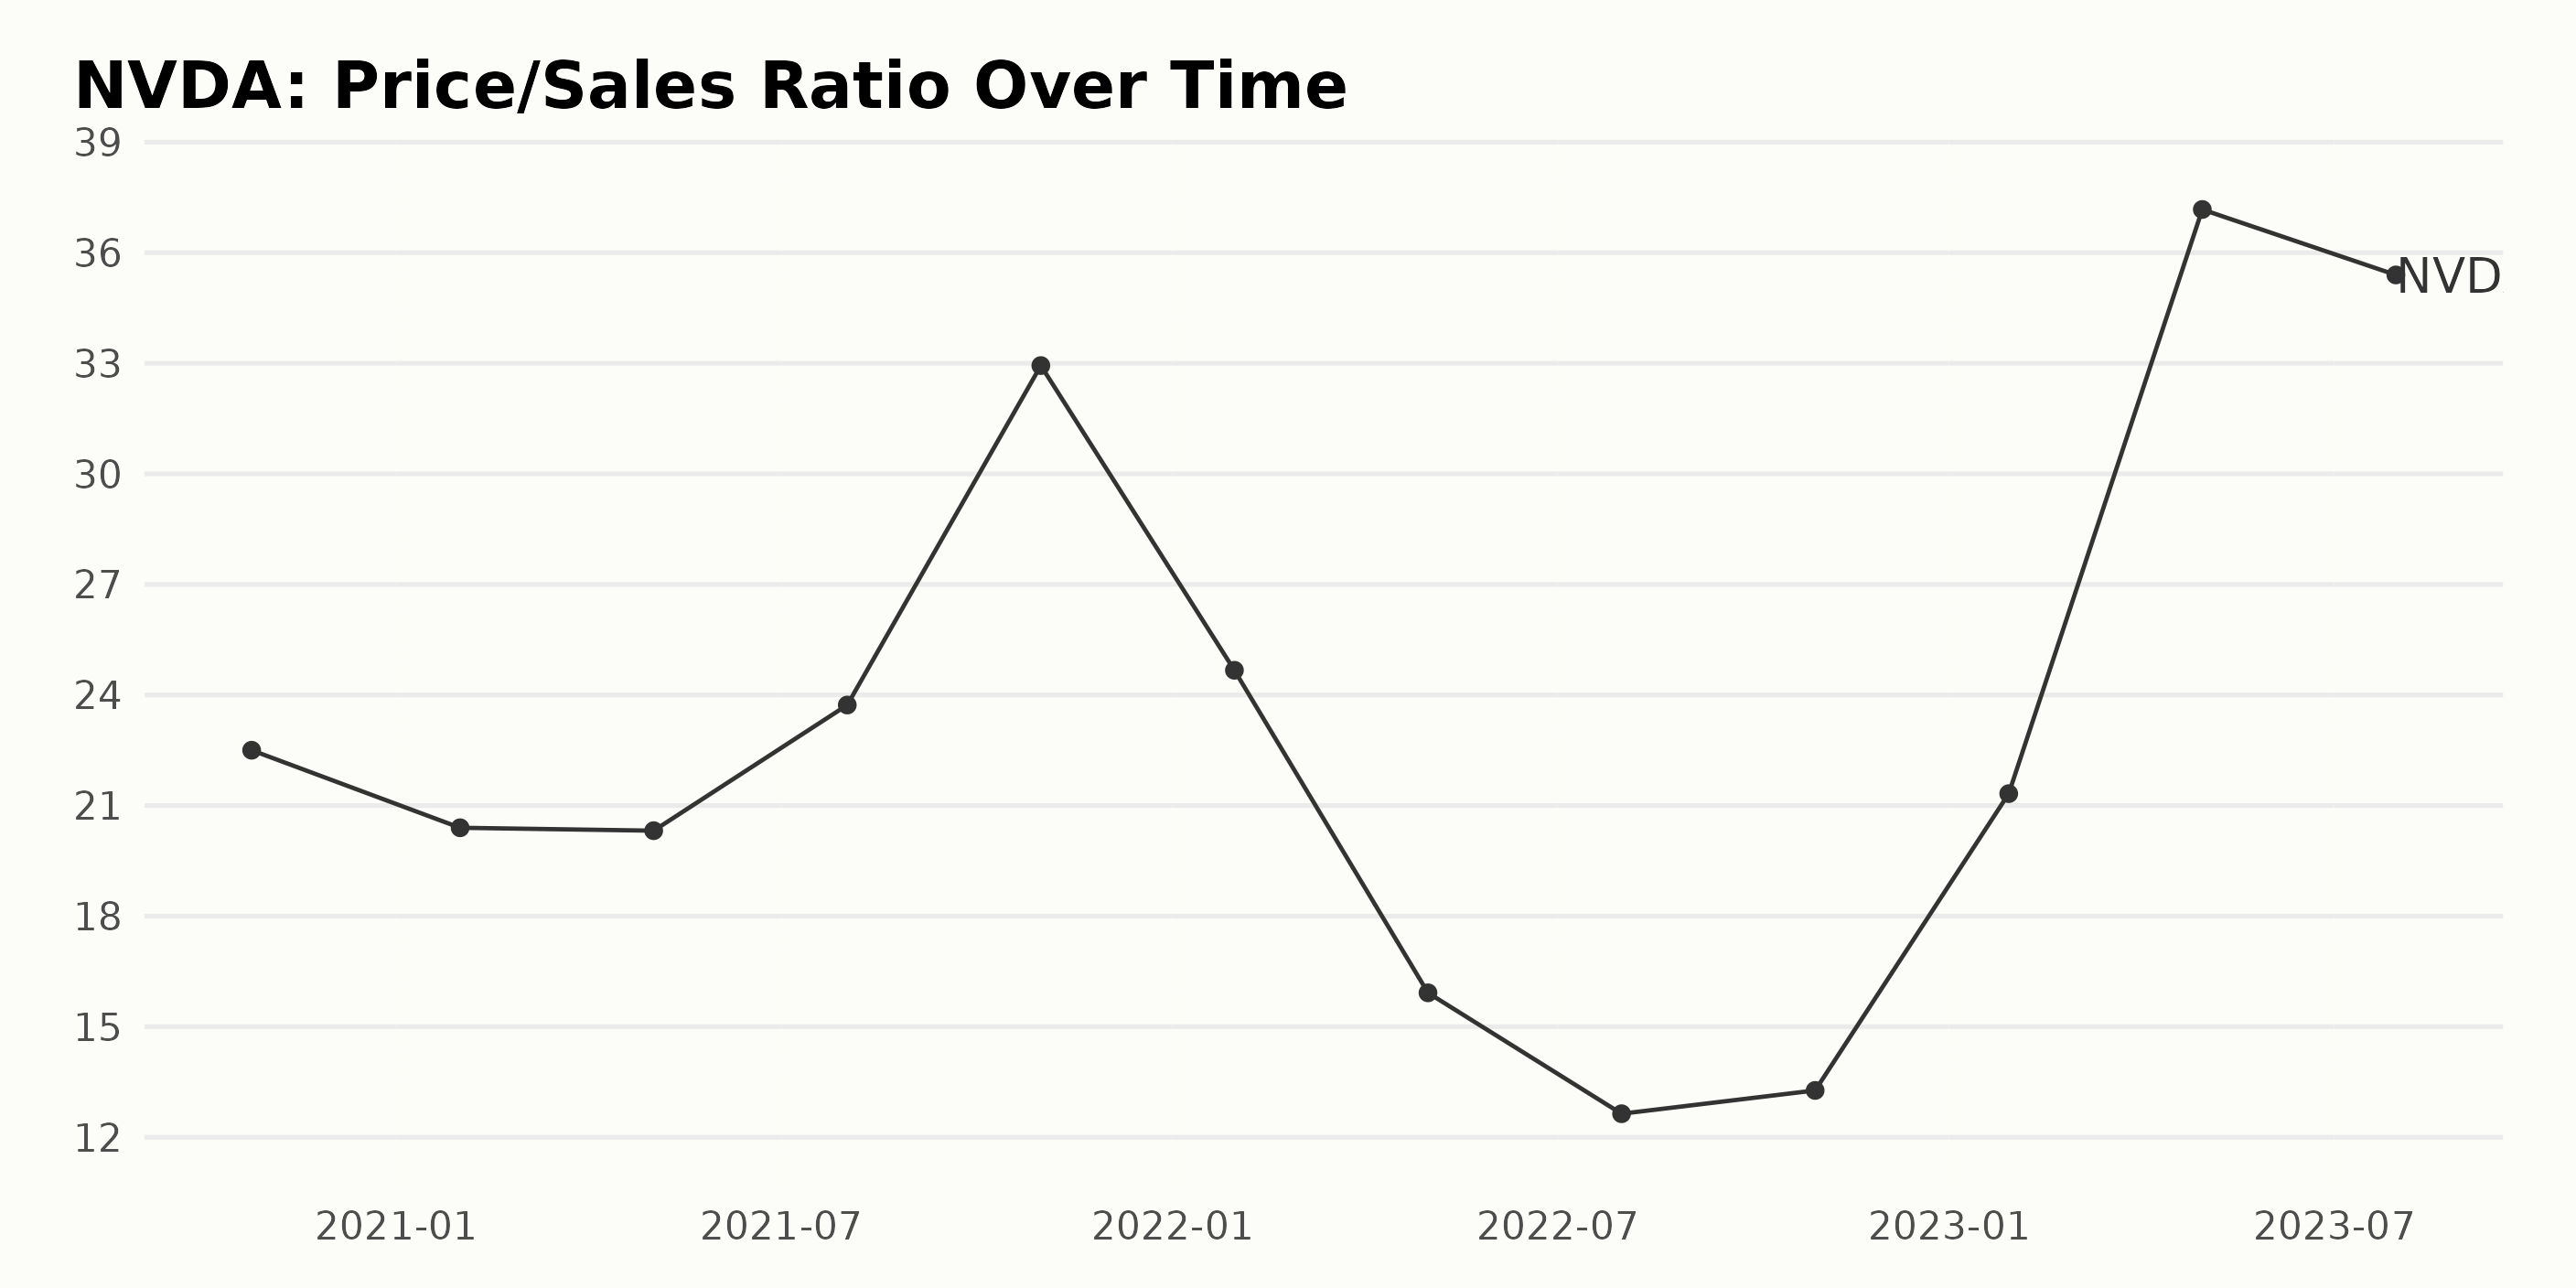
Based on the given data, there have been significant fluctuations and trends in NVDA’s Price/Sales ratio (P/S). Below is a summary of the P/S movements:
- From October 2020 to January 2021, NVDA's P/S declined from 22.50 to 20.40, demonstrating a downward trend.
- Between January and May of 2021, the P/S saw a mild reduction, decreasing slightly from 20.40 to 20.32.
- However, between May and August 2021, the P/S increased remarkably from 20.32 to 23.73, indicating an upward movement.
- Between August and October 2021, there was a significant increase in the P/S, jumping to 32.89 in October 2021.
- Post the high of October 2021, a notable decline in the P/S was observed. As of January 2022, the P/S fell drastically to 24.67, followed by a further decrease to 15.92 in May 2022.
- Subsequently, it declined further to 12.64 by July 2022, then slightly increased to 13.27 in October 2022, showing a tendency for stagnation with a slight upward trend.
- By January 2023, the P/S made a strong comeback and stood at 21.32, showing a significant increase for that period.
- The upward trend continued until April 2023, when the P/S peaked at 37.17, subsequently dropping slightly to 35.40 in July 2023.
Overall, comparing the first value in October 2020 (22.50) with the latest recorded value in July 2023 (35.40), NVDA’s Price/Sales ratio has seen a growth rate of approximately 57.33%.
However, it's important to note the high levels of volatility within the period. It would be beneficial to closely watch the company's financials and market conditions to predict future P/S movements.
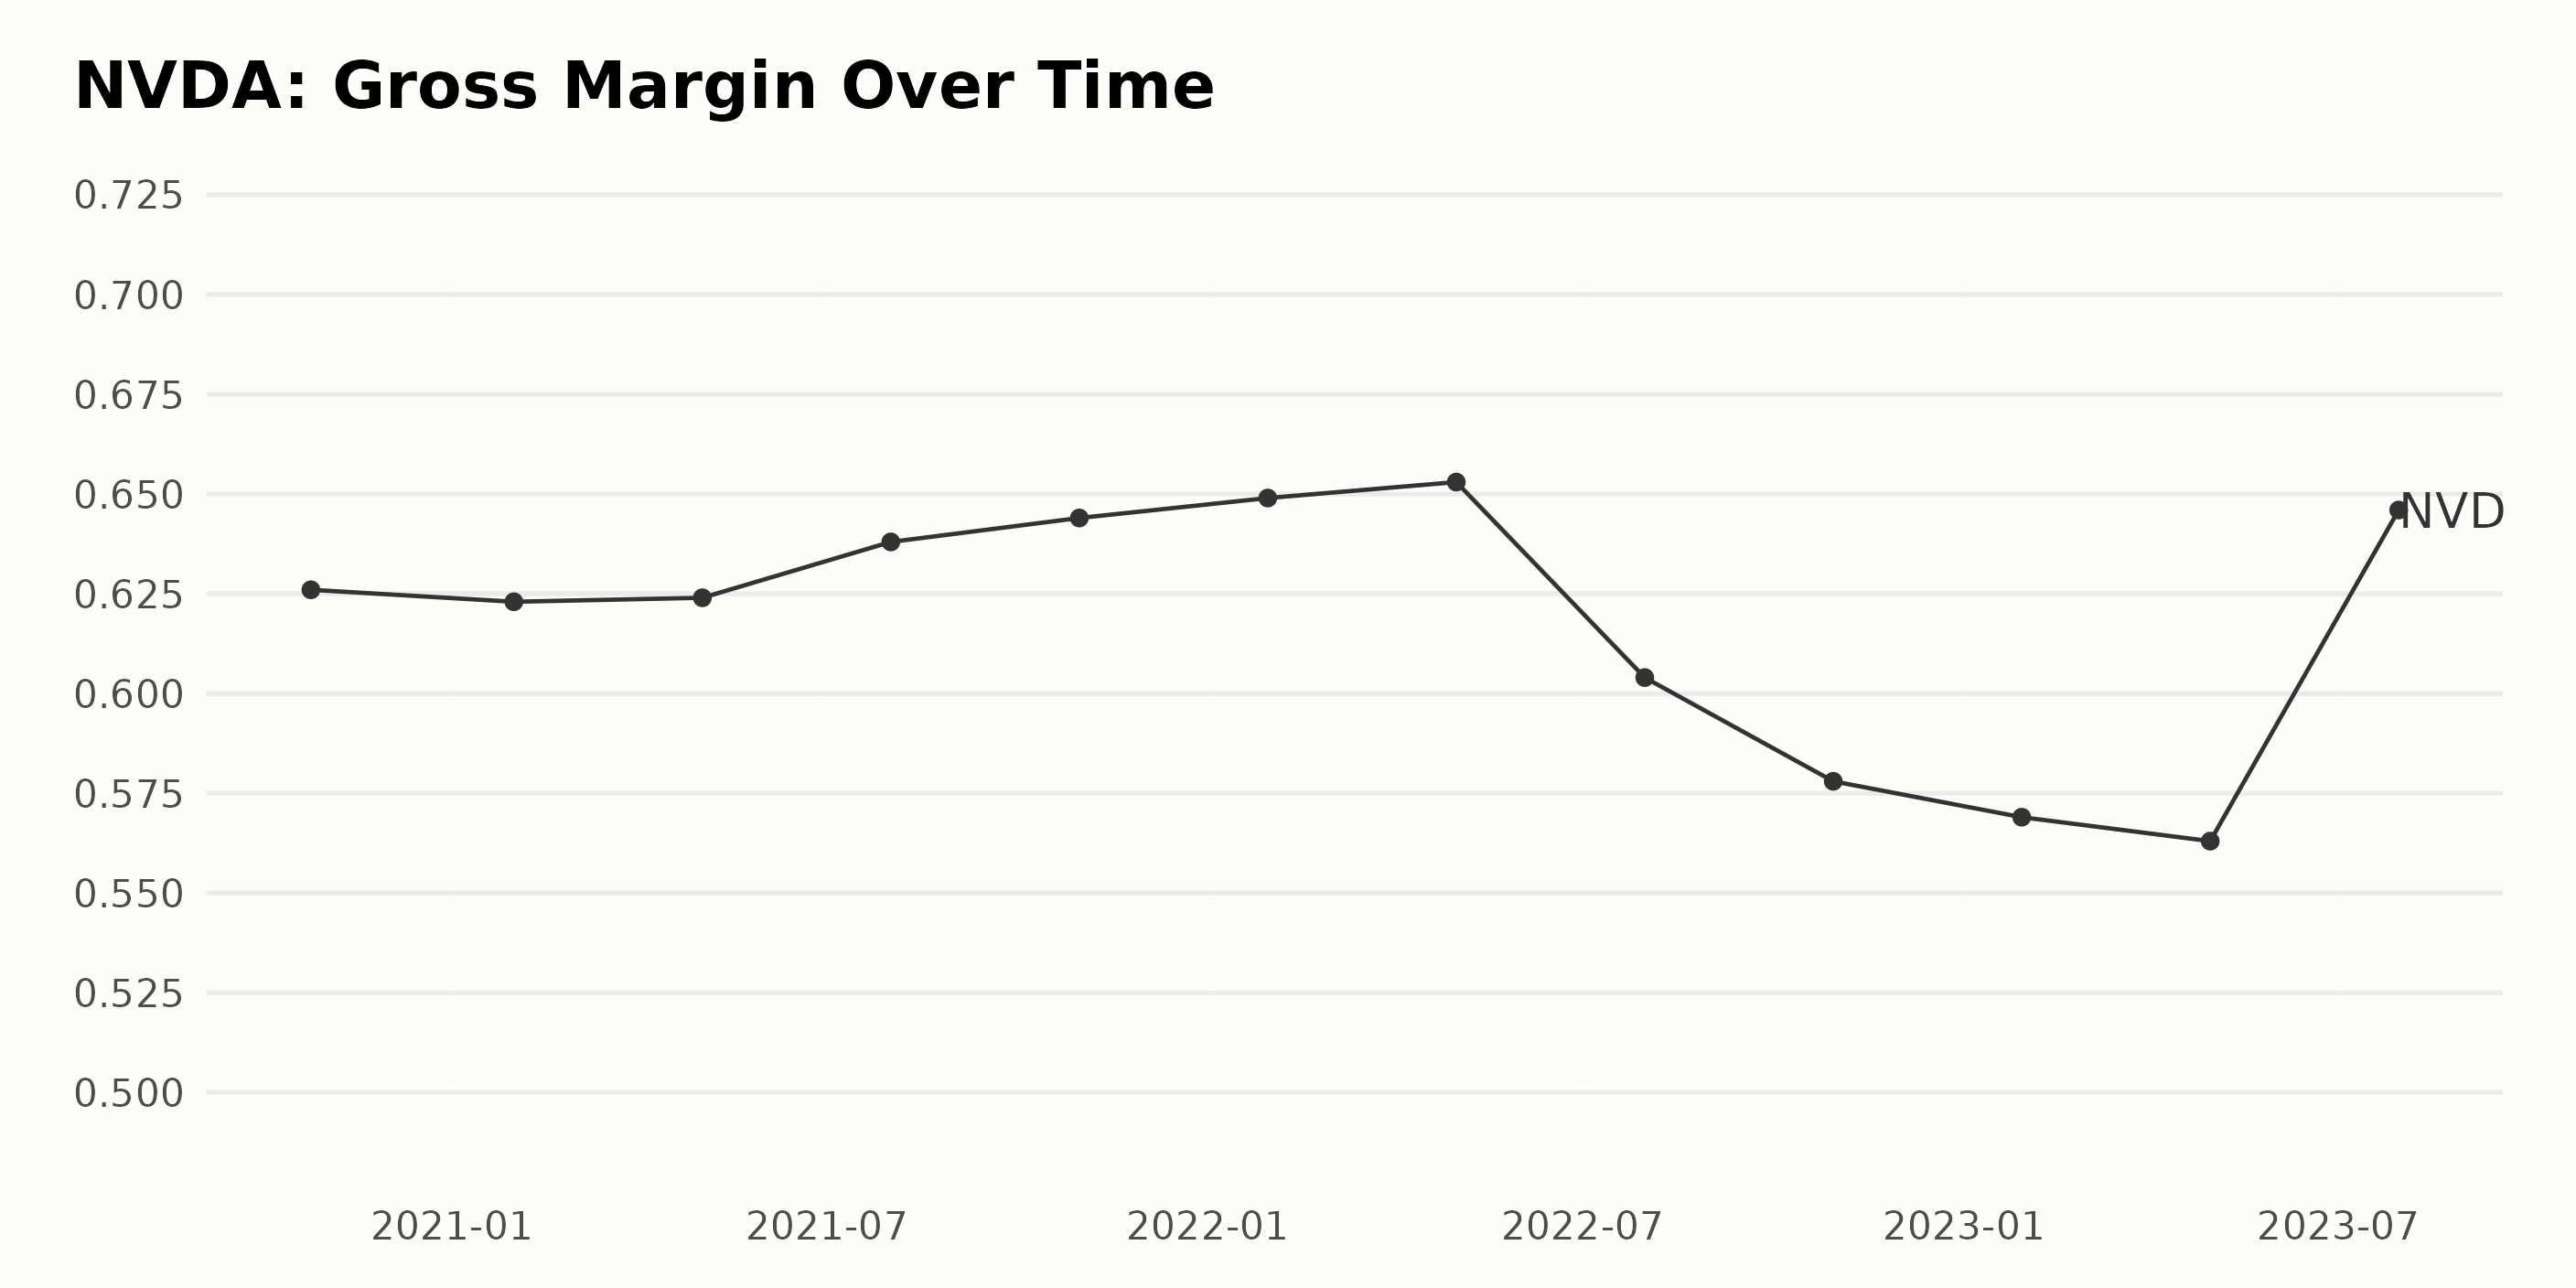
The gross margin of NVDA displayed a mixed trend, with overall increasing values until mid-2022, followed by a downturn and then an upward correction. Here are some notable points in more detail:
- On October 25, 2020, the gross margin was 62.60%.
- A slight decrease was seen by January 31, 2021, where the margin was 62.30%.
- The gross margin hovered over 62%-63% until May 2, 2021.
- Thereafter, the margin climbed, reaching 64.90% on January 30, 2022.
- It peaked at 65.30% on May 1, 2022.
- A sharp decline was noted toward July 31, 2022, falling to 60.40%.
- This downward trend continued, hitting a low of 56.30% on April 30, 2023.
- An abrupt rebound was seen in July 2023, where the gross margin grew to 64.60%.
Measuring from the first value in October 2020 to the last given data point in July 2023, there is a growth rate of 3.19%. Please note that there is a marked fluctuation in the latter part of the series, which saw a fall and a notable recovery in the gross margin, illustrating the volatile performance of NVDA in recent years.
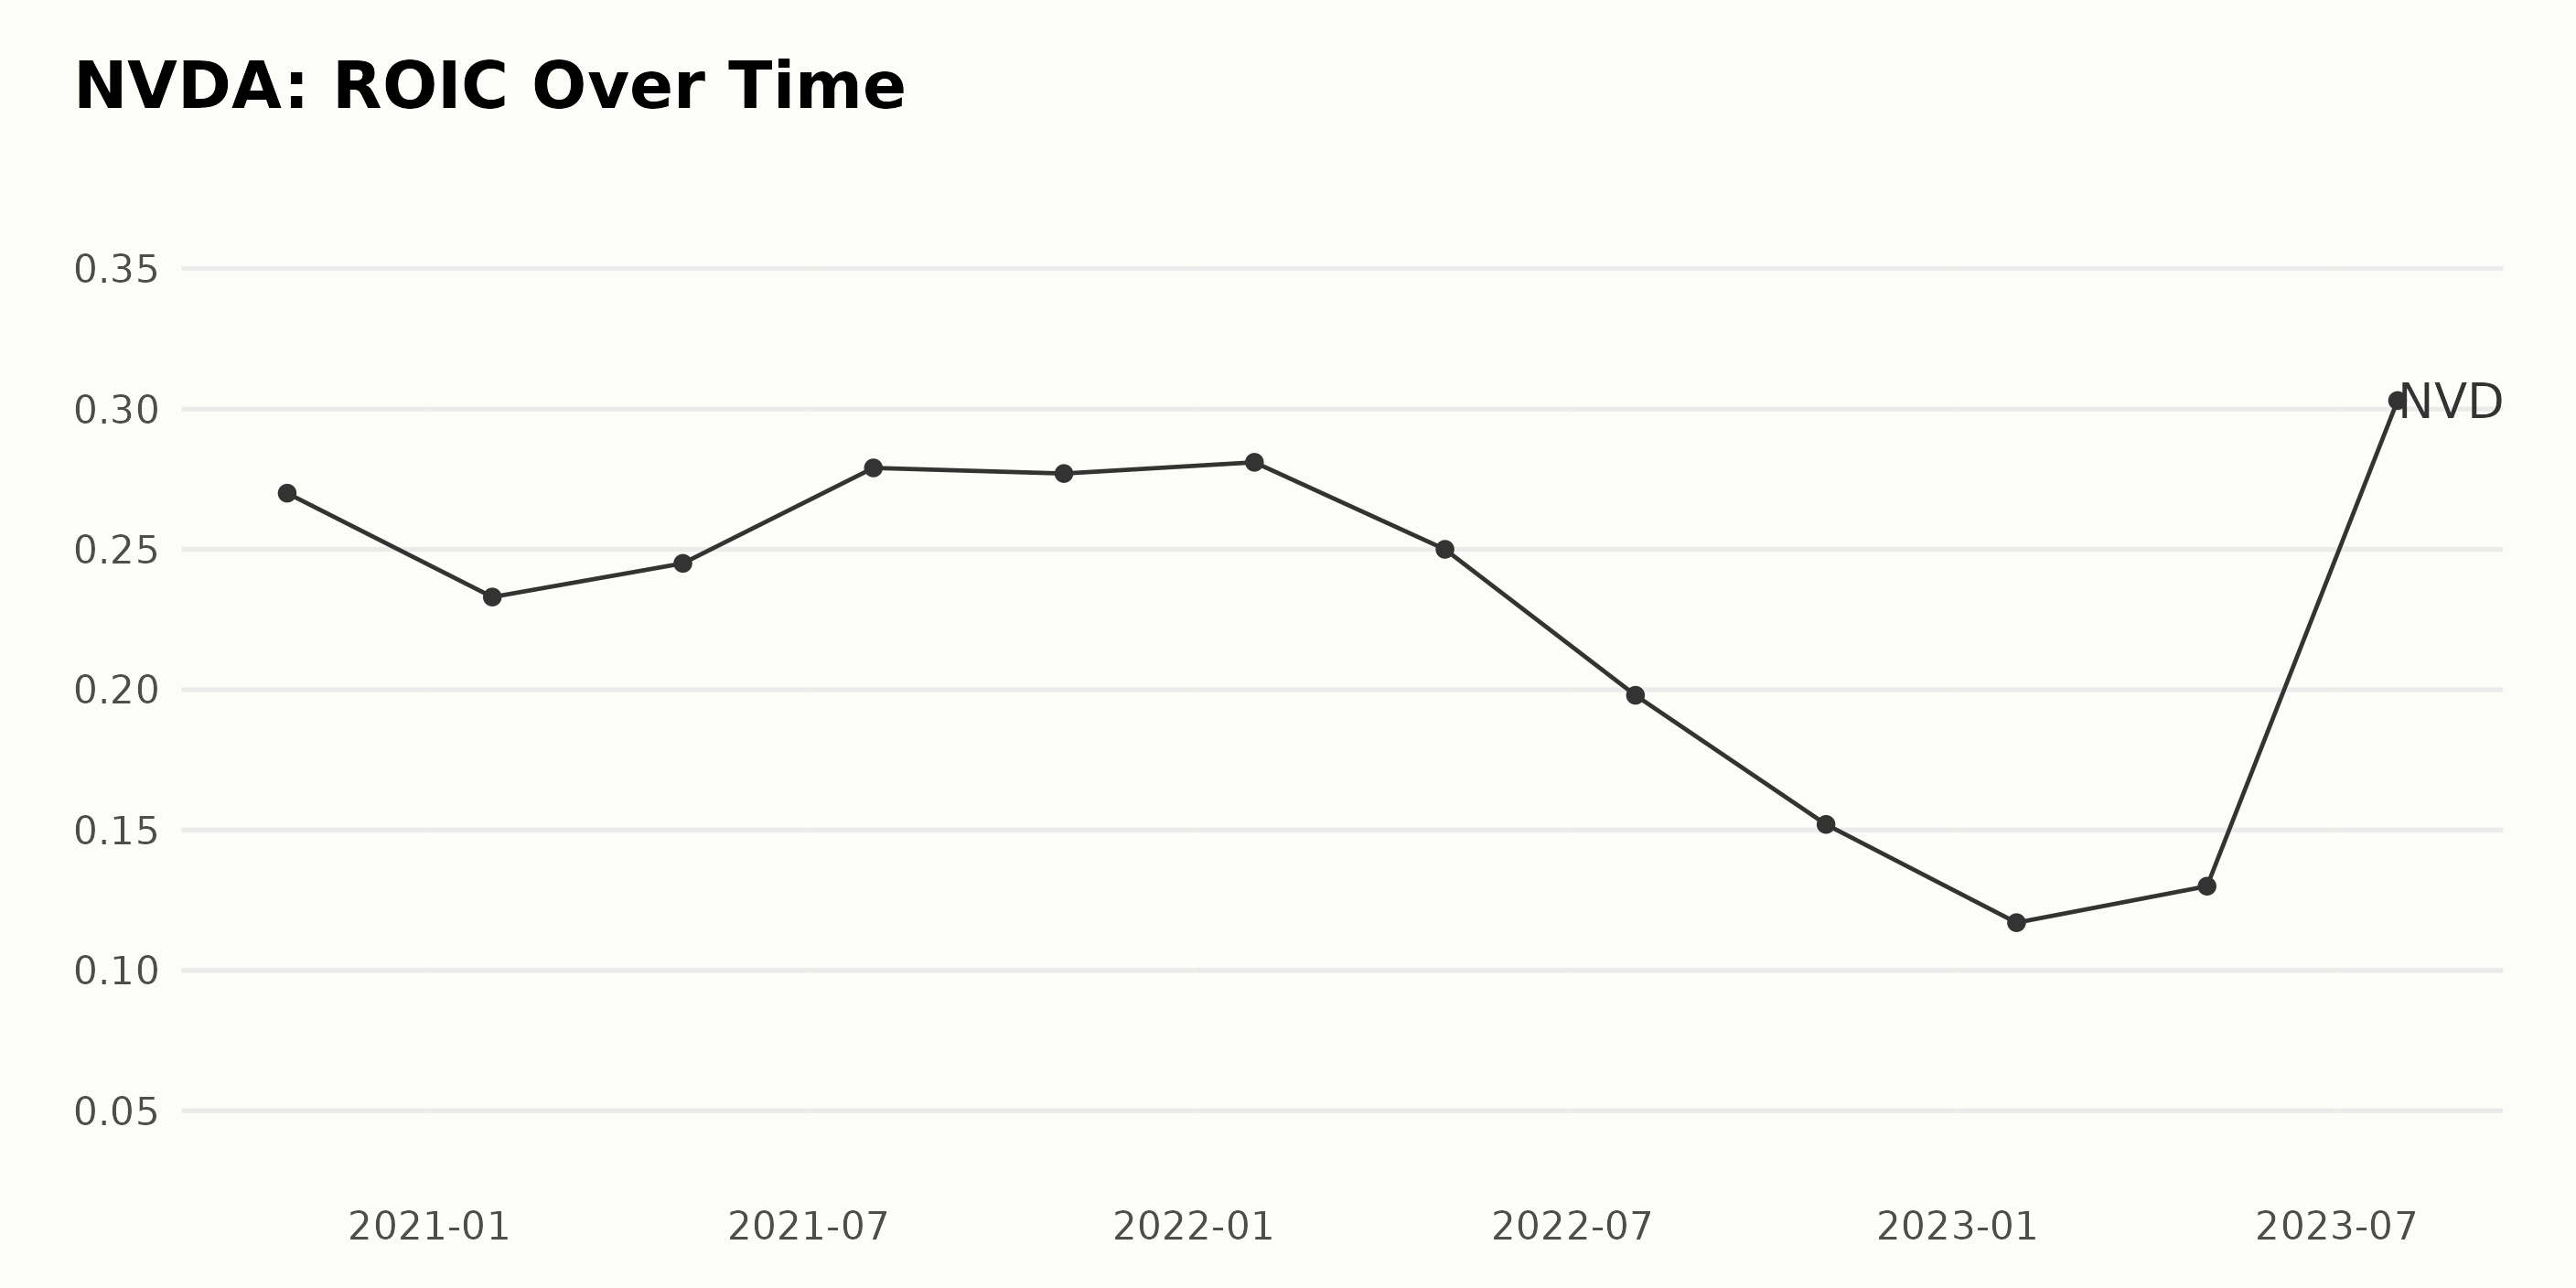
The ROIC of NVDA has experienced both upward and downward fluctuations over the period from October 2020 to July 2023. Key highlights include:
- Starting from October 25, 2020, the ROIC was 0.27.
- There was a dip in January 2021 with a ROIC of 0.233.
- The value rebounded in May 2021 to 0.245 and further increased to its peak at 0.281 by January 30, 2022.
- However, the subsequent period saw a distinct decreasing trend, reaching as low as 0.152 in October 2022.
- This downtrend reversed dramatically in the second half of 2023, with the ROIC surging to 0.303 as of July 30, 2023.
Considering the last data point of 0.303 in July 2023 and the first data point of 0.27 in October 2020, there has been a growth rate calculated as approximately 11%. While recent data suggests some volatility, the current trend indicates a sharp recovery from previous lows in the ROIC of NVDA.
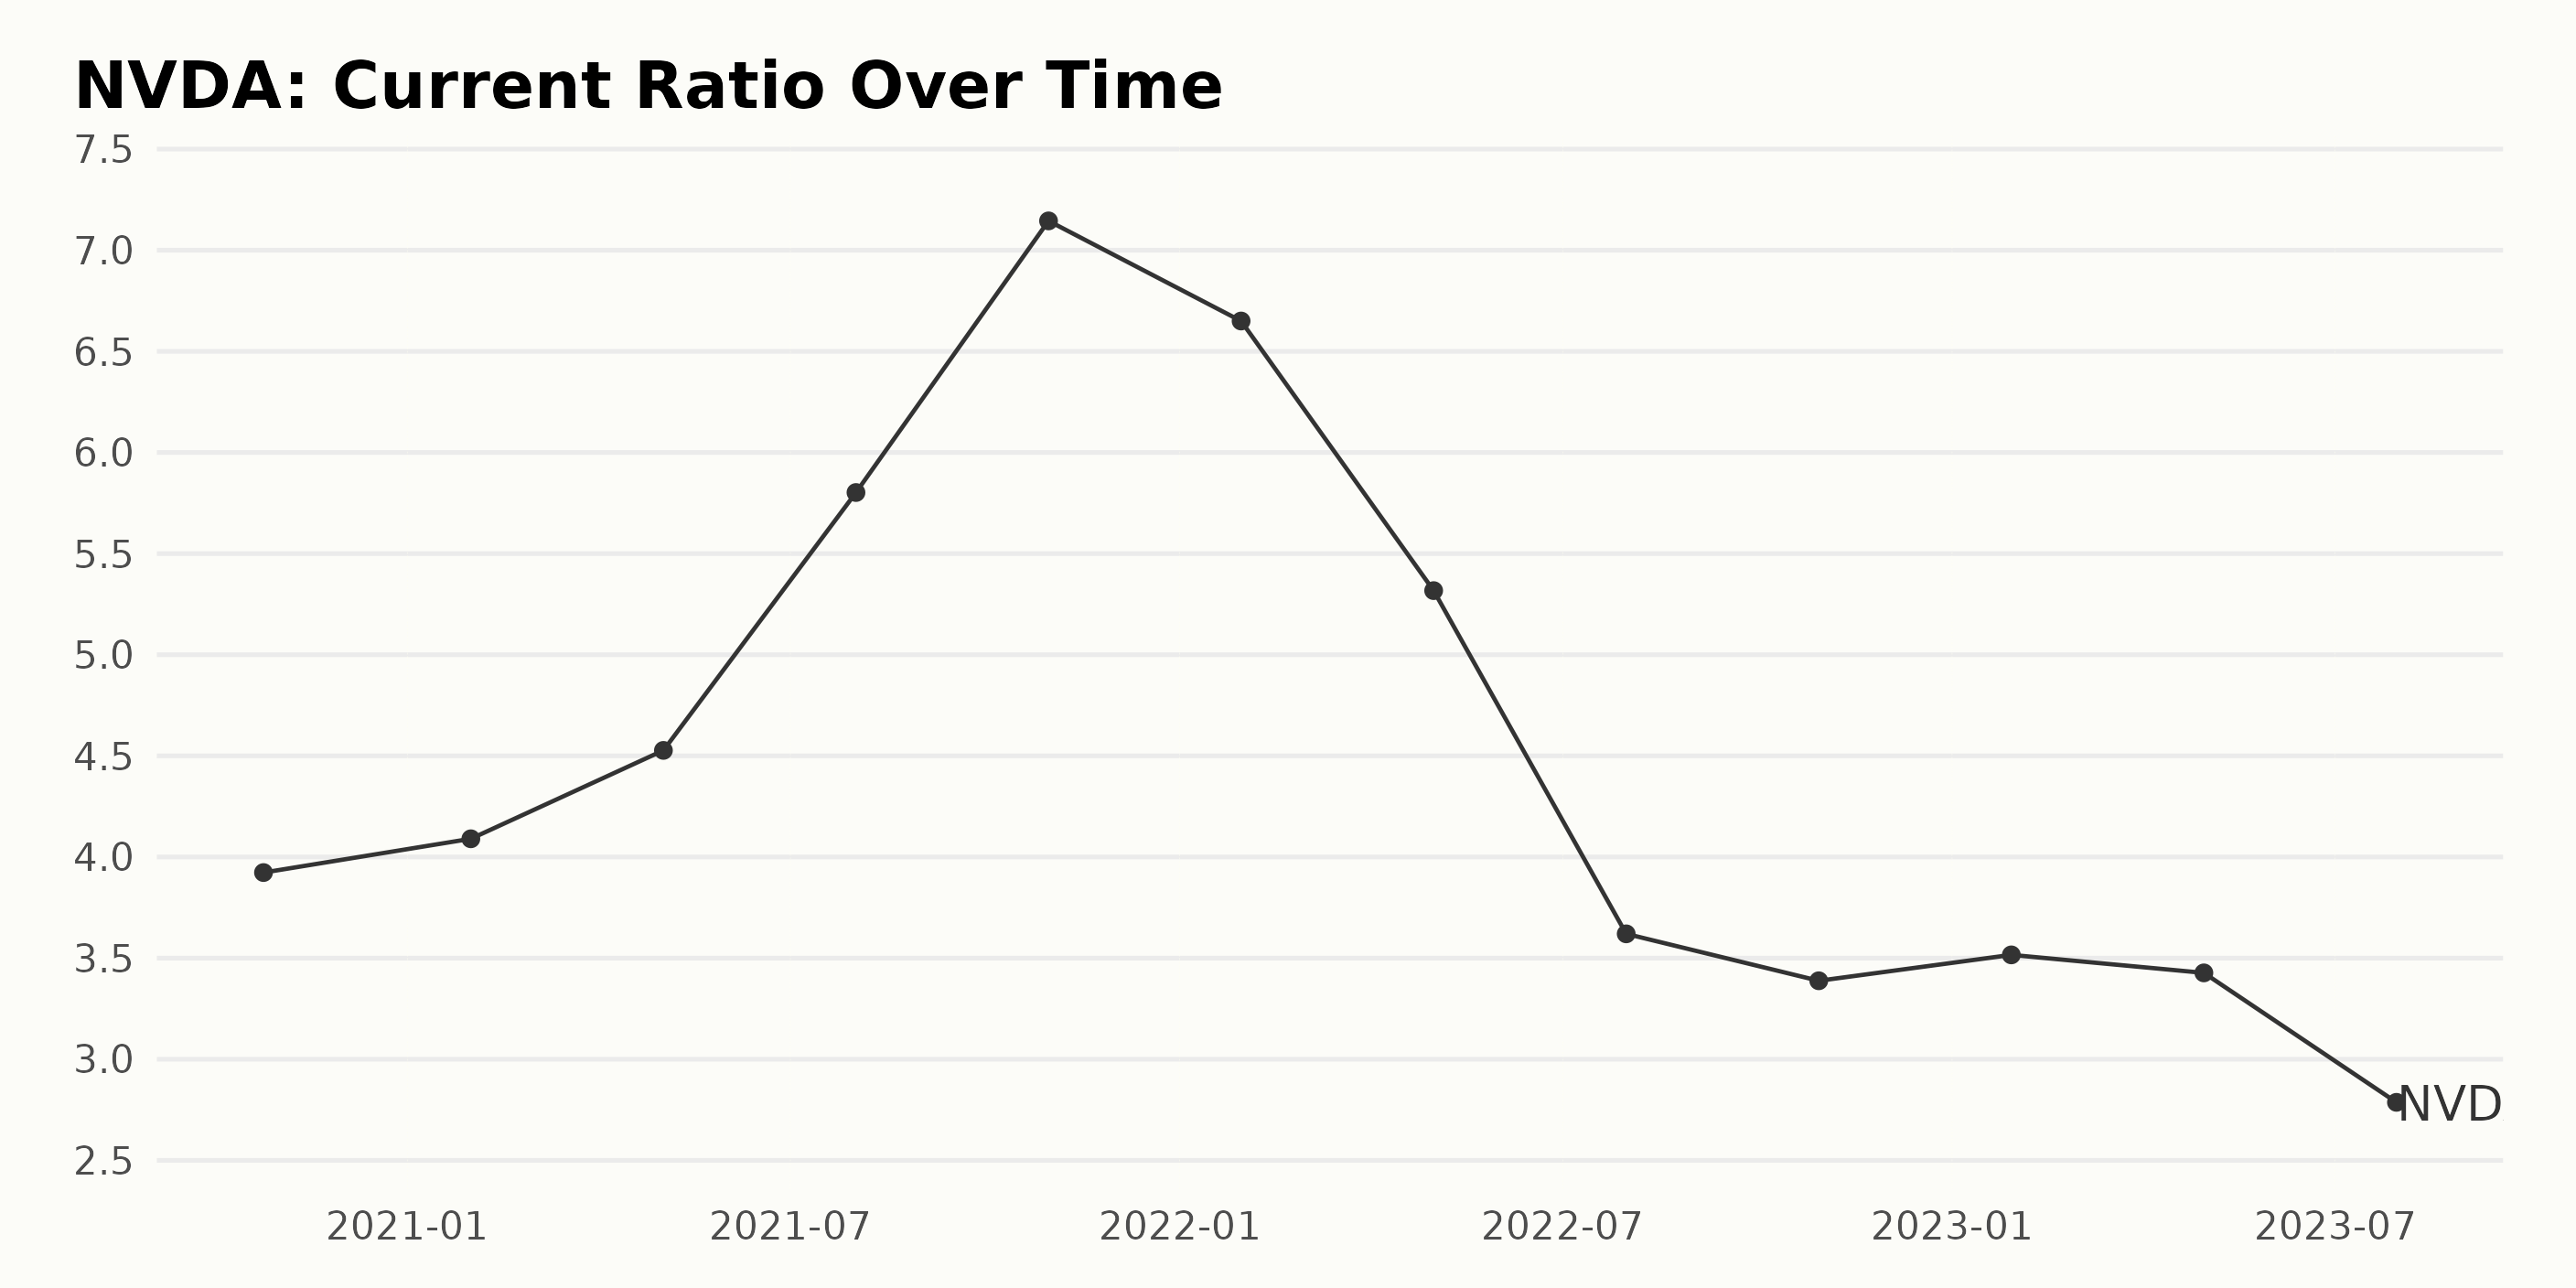
The series of data represents the current ratio of NVDA from October 2020 till July 2023. Here is a summary of the trend and fluctuations:
- In October 2020, the current ratio was at 3.92.
- There was a noticeable increase during 2021, reaching a peak at 7.14 in October 2021.
- By January 2022, it declined slightly to 6.65 but still remained relatively high compared to the start of the trend.
- A significant drop was observed in the first half of 2022, with the current ratio plunging to 3.62 in July 2022. It further fell to 3.39 by October 2022.
- The current ratio modestly recovered to 3.52 in January 2023, only to experience a slight dip in April 2023 at 3.43.
- By July 2023, the current ratio stood at 2.79, marking the lowest point in the entire series.
Overall, despite a promising growing trend in 2021, NVDA’s current ratio has experienced a substantial decline from the start of 2022 and into 2023. Measuring the growth rate from the first value to the last, corresponding to October 2020's value of 3.92 to July 2023's value of 2.79, illustrates a decrease of approximately -28.83%.
This indicates that the company's short-term liquidity has deteriorated over the evaluated period. It'll be critical to observe whether this downward trend continues or reverses in subsequent quarters.
Analyzing the Rising Trend of NVIDIA Corporation's Share Price in 2023
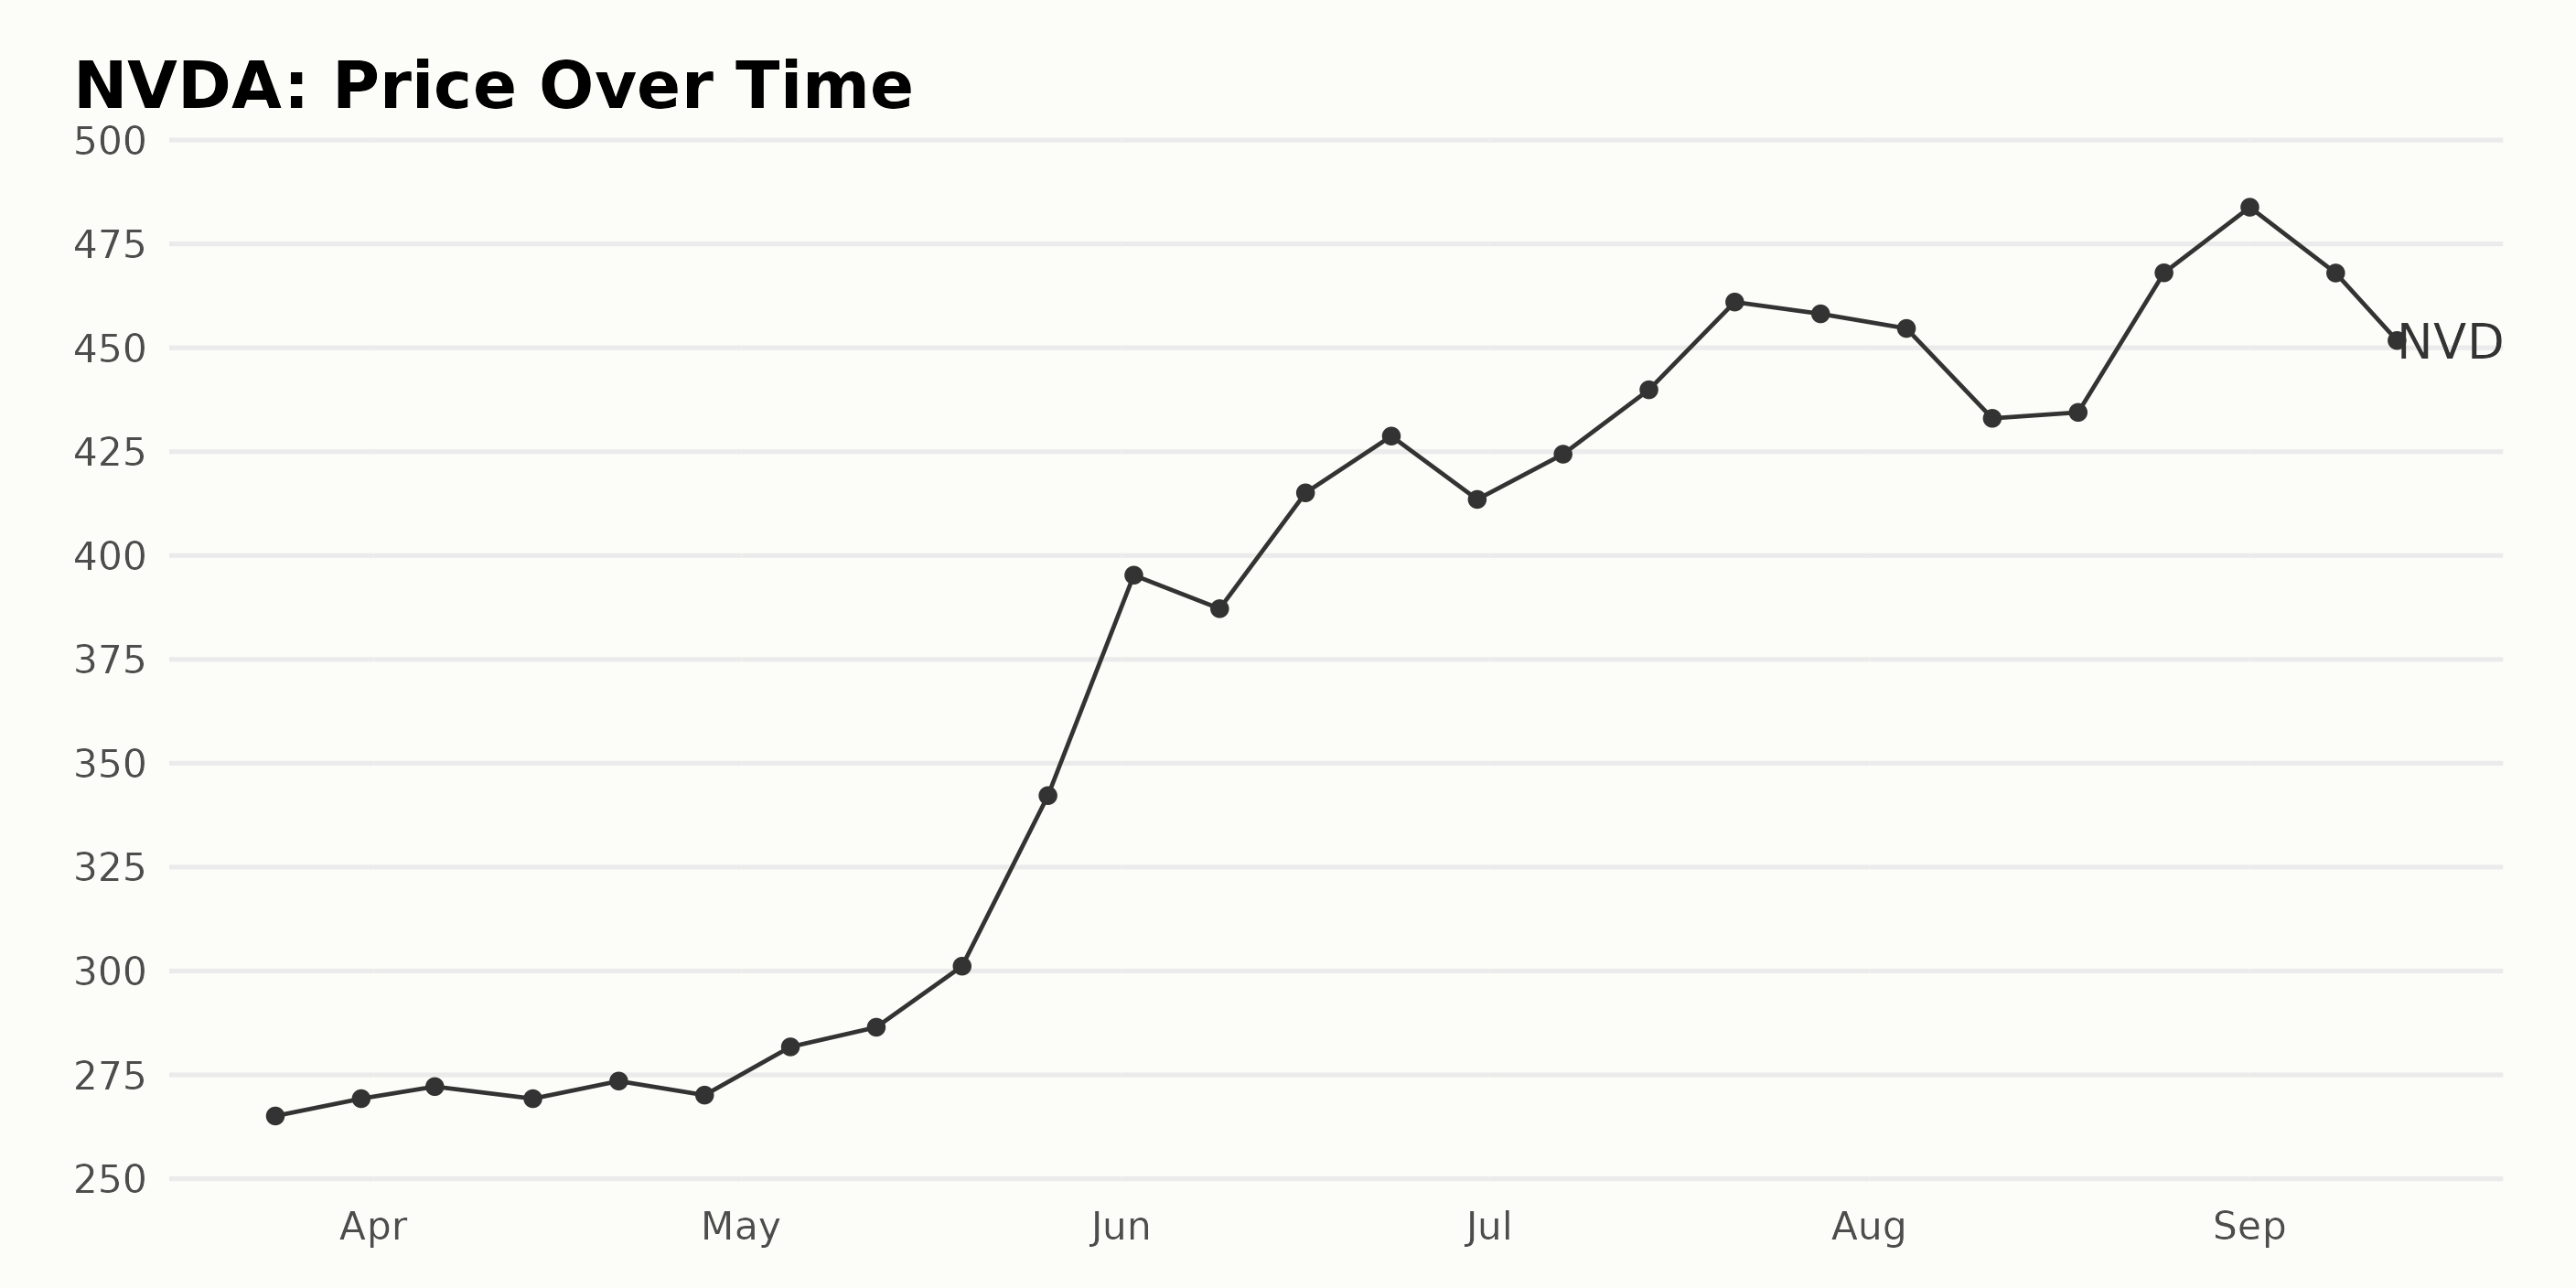
The data for NVDA shows a general increasing trend in the share price from March 2023 to September 2023. Here's a breakdown of the trends:
- Starting from $265.10 on March 24, 2023, the share price slightly increased to $269.28 by the end of March 2023.
- The month of April 2023 saw minute fluctuations, with the price finally settling at $270.12 by April 28, showing a general decelerating growth rate.
- However, May 2023 witnessed a clear acceleration in the growth rate, starting at $281.73 on May 5 and reaching a high of $342.22 by the end of the month.
- This rapid growth rate continued into June 2023, with the price soaring to $395.27 on June 2 and gradually climbing to a peak of $428.75 on June 23. This represents significant accelerated growth.
- In July 2023, despite a momentary dip to $413.50 at its start, the price resumed an upward trajectory, eventually reaching $461.01 by July 21
- In August 2023, there was a temporary deceleration, with the price dropping to $433.02 on August 11, but it recovered swiftly, concluding the month at $468.04 on August 25.
- September 2023 saw the highest price at $483.83 on September 1. However, there was a notable deceleration in the growth rate, with the price falling to $454.85 by September 13.
In summary, throughout the observed period, NVDA’s stock price generally increased, exhibiting stages of accelerated growth, particularly in May and June 2023. Despite periodic fluctuations and decelerations, the overall trend indicates positive growth. Here is a chart of NVDA's price over the past 180 days.
Analyzing NVIDIA Corporation's High Sentiment, Quality, and Momentum Ratings in 2023
The POWR Ratings grade of NVDA, a stock in the Semiconductor & Wireless Chip category, has been persistently listed as C (Neutral) over the examined period from March 18, 2023, to September 14, 2023. Throughout this duration, we can notice a gradual improvement in its rank among the 92 stocks in its category. A summary of the ranking trend includes:
- On March 18 and 25, 2023, it ranked #67.
- From April 1, 2023, to May 6, 2023, the rank progressively improved from #63 to #62.
- After a slight improvement to rank #59 on May 13, the rank soared to #43 by June 3.
- Over the next month until July 15, the rank fluctuated slightly between #43 and #45.
- After lingering at rank #45 for a few weeks, there was another drastic improvement to #27 by September 2, maintaining this position up till the last recorded date, September 14, 2023.
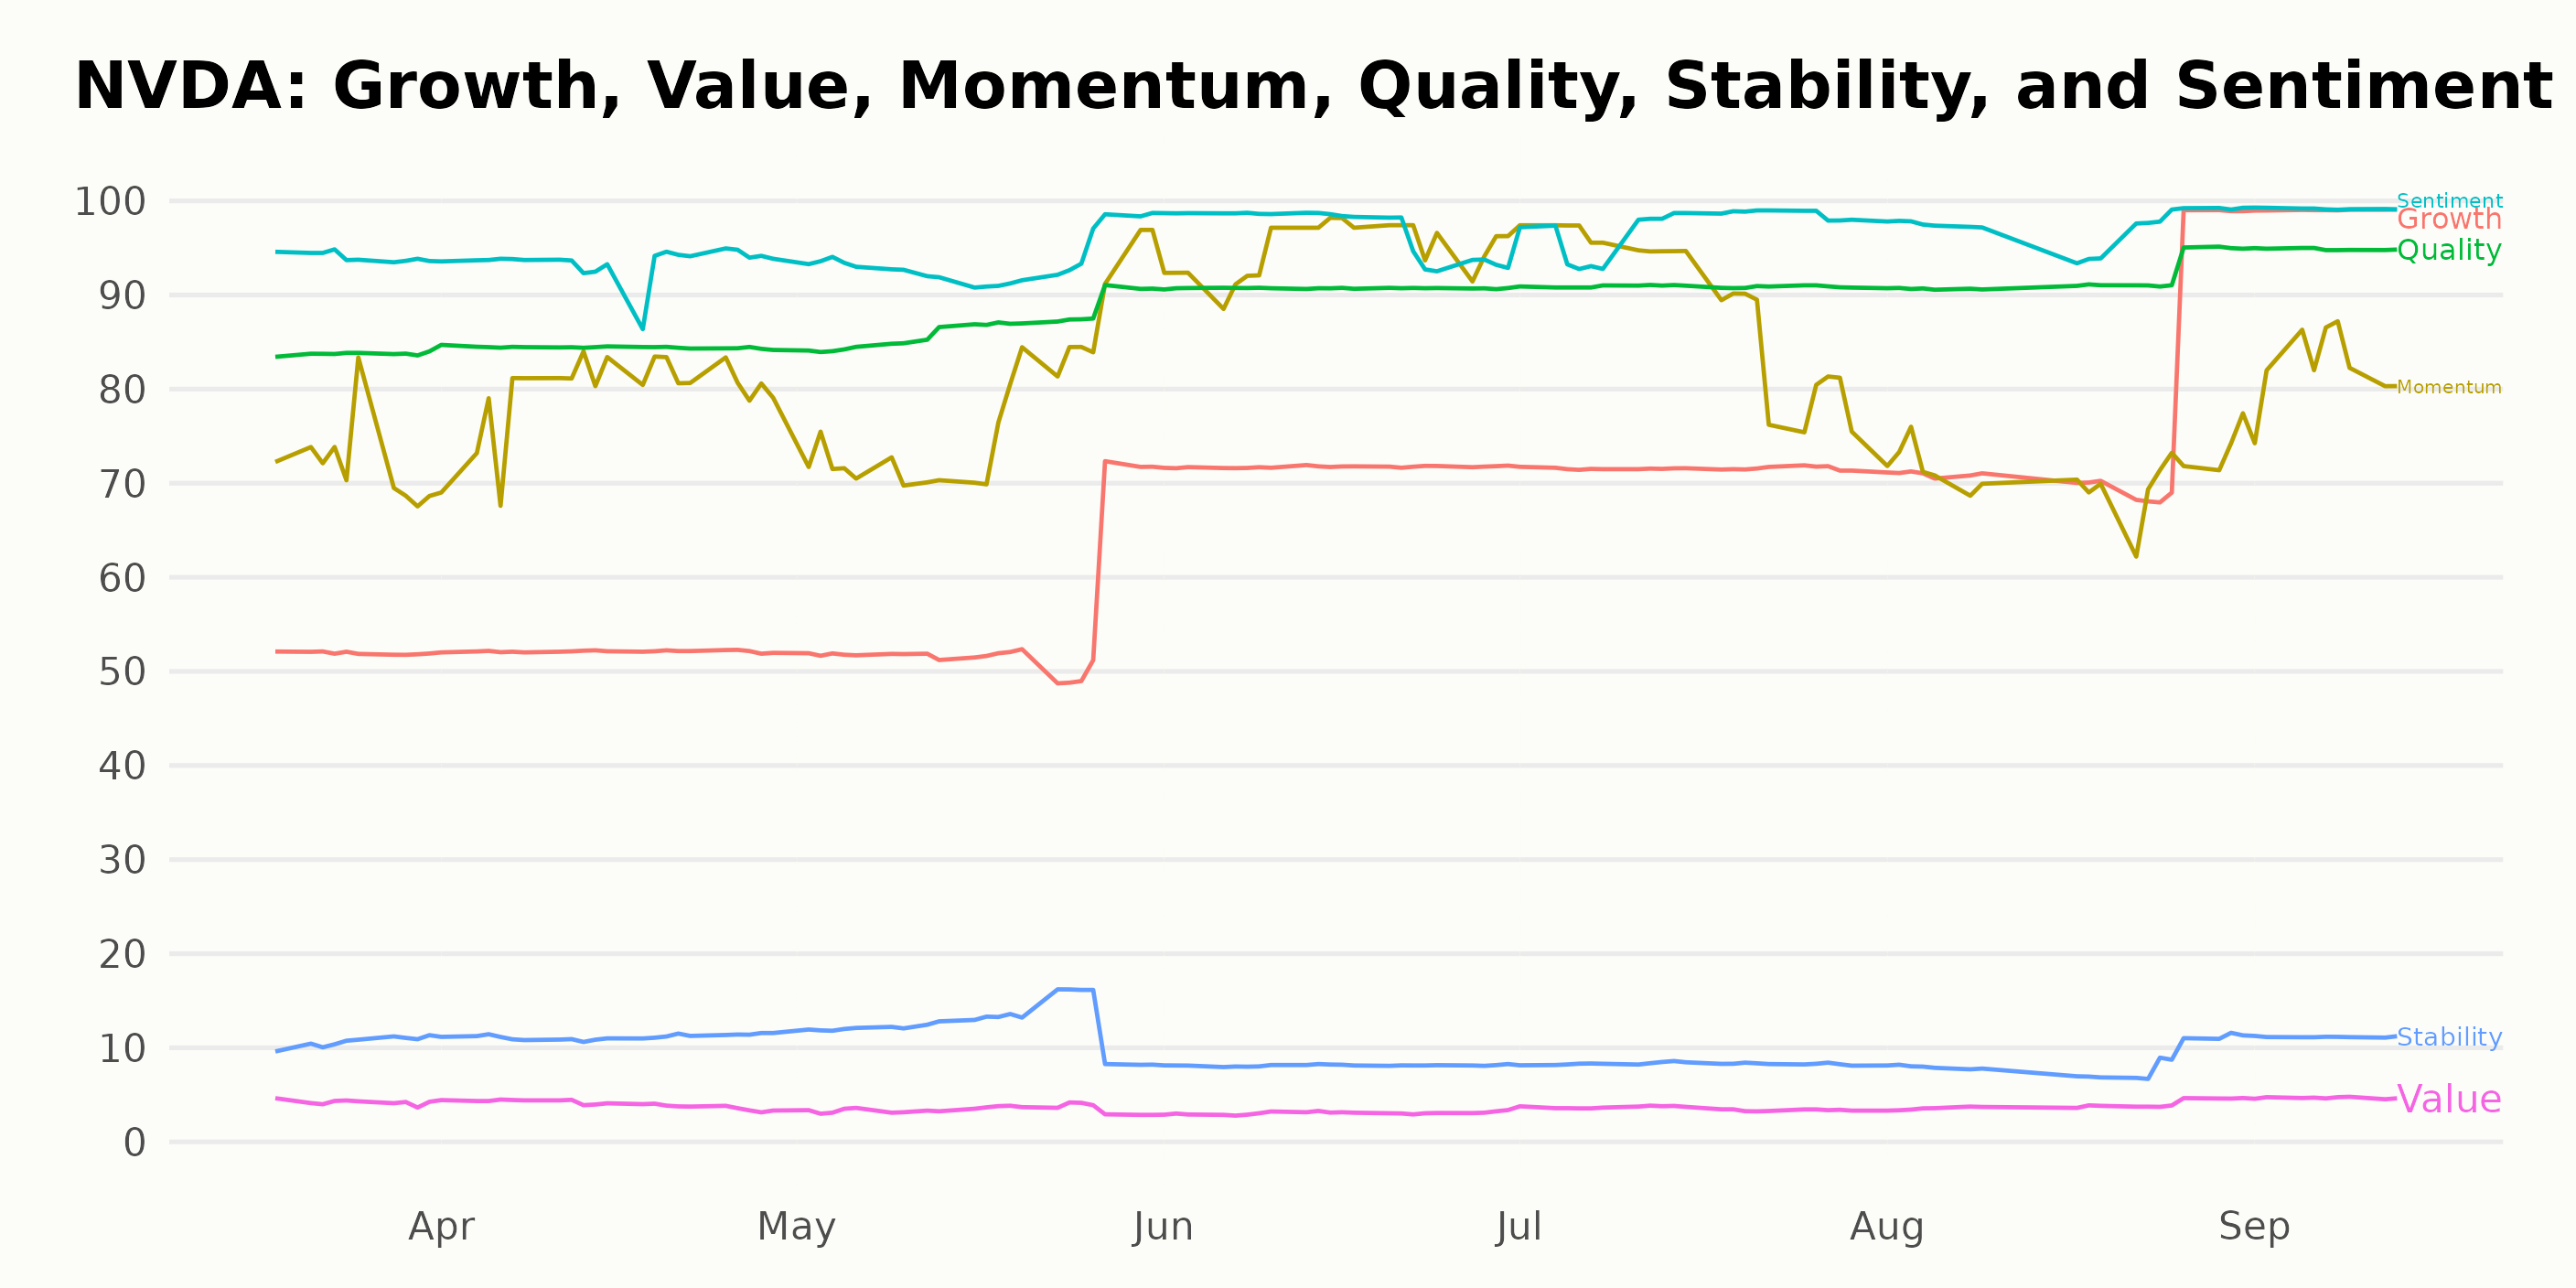
The POWR Ratings for NVDA showed particularly noteworthy dimensions in terms of Sentiment, Quality, and Momentum. When reviewing the data from March 2023 to September 2023, these three dimensions consistently had high ratings. Let's discuss these three dimensions in more detail:
- Sentiment: The Sentiment rating remained consistently high throughout the period, starting from 94 in March 2023 and reaching its peak at 99 in September 2023. This persistent high rating demonstrates an overall positive perception of NVDA during this time.
- Quality: This dimension also stayed strong in its ratings. It started at a solid 84 in March 2023, gradually increased, and eventually reached an impressive rating of 95 by September 2023. The consistent upward trend signifies that the quality associated with NVDA has been improving over this period.
- Momentum: Momentum started at 72 in March 2023 and saw some fluctuations over the months. Notably, it peaked at 95 in June 2023, dropped slightly to 90 in July 2023, and then rose again, landing at 82 in September 2023. Despite some fluctuation, the Momentum ratings remained relatively high, indicating a strength of momentum in NVDA's activities.
It is crucial to note that while Sentiment, Quality, and Momentum have demonstrated high ratings and noted trends, they are not the only considerations when making investment decisions and evaluating a company’s overall performance. Other factors and dimensions could be equally, if not more, significant depending on specific circumstances and indicators.
How does NVIDIA Corporation (NVDA) Stack Up Against its Peers?
Other stocks in the Semiconductor & Wireless Chip sector that may be worth considering are Renesas Electronics Corporation (RNECF), Everspin Technologies, Inc. (MRAM), and STMicroelectronics N.V. (STM) - they have better POWR Ratings. Click here to explore other stocks in the Semiconductor & Wireless Chip sector.
What To Do Next?
Discover 10 widely held stocks that our proprietary model shows have tremendous downside potential. Please make sure none of these “death trap” stocks are lurking in your portfolio:
NVDA shares were trading at $452.61 per share on Thursday afternoon, down $2.24 (-0.49%). Year-to-date, NVDA has gained 209.82%, versus a 18.63% rise in the benchmark S&P 500 index during the same period.
About the Author: Anushka Dutta

Anushka is an analyst whose interest in understanding the impact of broader economic changes on financial markets motivated her to pursue a career in investment research.
The post Analyzing the Potential of NVIDIA (NVDA) as a Stock Buy appeared first on StockNews.com