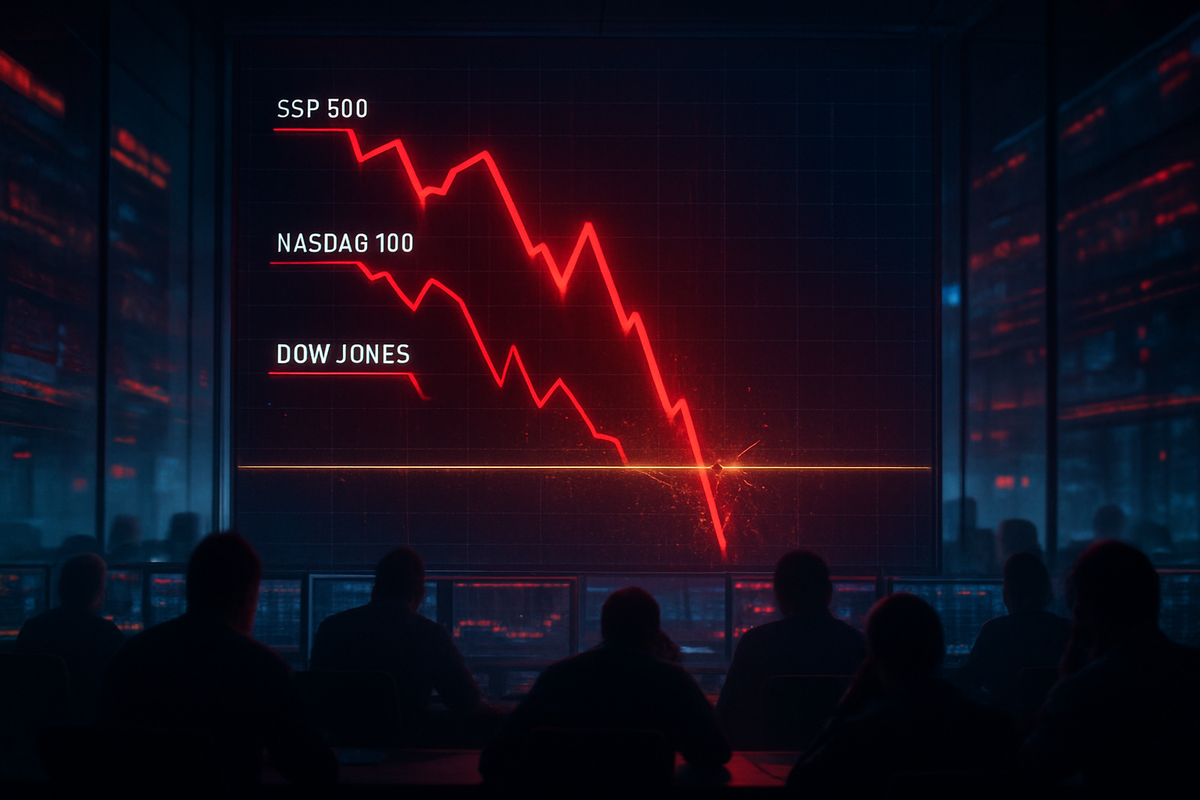
The final psychological floor for the American equity market crumbled on March 19, 2026, as the S&P 500 (INDEXSP: .INX), the Nasdaq 100 (INDEXNASDAQ: .NDX), and the Dow Jones Industrial Average (INDEXDJX: .DJI) all closed below their respective 200-day moving averages (DMA) in a synchronized technical breakdown. This rare "triple breach" signals a systemic shift in market sentiment, moving from the aggressive "AI-fever" dip-buying of the past three years toward a defensive, risk-averse posture. For technical analysts, the 200-DMA represents the definitive line between a healthy bull market and a looming bear market; crossing it simultaneously across all three major benchmarks suggests the current correction is no longer sector-specific but a broad-based liquidation.
The immediate implications are stark. Algorithmic trading systems and institutional risk models, many of which use the 200-day average as a hard "sell" trigger, were activated in the final hour of trading, leading to a cascade of automated sell orders. As the closing bell rang, the S&P 500 sat at 6,589, significantly below its 200-day support of 6,618. This technical failure, coupled with a spike in the CBOE Volatility Index (VIX), indicates that the era of low-volatility gains may be over for the foreseeable future, as investors grapple with a new reality of higher capital costs and geopolitical instability.
A Perfect Storm: The Catalyst and the Collapse
The technical breakdown on March 19 was the culmination of a volatile three-week period triggered by an escalating conflict in the Middle East. Following the onset of the U.S.-Iran maritime standoff in late February, an oil supply shock in the Strait of Hormuz sent Brent crude prices soaring toward $116 per barrel. This energy spike acted as a tax on the global economy, reigniting stagflation fears that many hoped were a relic of the early 2020s. The Dow Jones Industrial Average (INDEXDJX: .DJI) was the first to show cracks, wavering near its average for days before the S&P 500 (INDEXSP: .INX) and the tech-heavy Nasdaq 100 (INDEXNASDAQ: .NDX) finally succumbed during the March 19 session.
The timeline of the collapse reveals a slow erosion of confidence. Throughout early March, buyers attempted to defend the 200-day line, leading to several "dead cat bounces" that failed to gain traction. By mid-day on the 19th, a disappointing manufacturing report combined with hawkish rhetoric from the Federal Reserve—which signaled that interest rates would remain "higher for longer" to combat energy-driven inflation—broke the market's back. Stakeholders, ranging from retail "meme" traders to massive pension funds, watched as support levels that had held since the spring of 2025 were sliced through with ease.
Initial market reactions have been characterized by "panic-selling" in growth sectors and a desperate rotation into cash and commodities. Total trading volume on the New York Stock Exchange was 40% above the 30-day average, a sign of high-conviction selling. Analysts at major Wall Street firms noted that the lack of a "buying tail" at the end of the day suggests that the bottom is likely not yet in, as the market lacks a clear psychological anchor to prevent further slippage.
Winners and Losers in a Technical Vacuum
The primary victims of this technical breach are the "Magnificent Seven" and the broader artificial intelligence complex. Nvidia (NASDAQ: NVDA), the poster child of the 2025 bull run, found itself under immense pressure as investors began to question the return on investment for the hundreds of billions spent on AI infrastructure. Trading near $175, NVDA has breached its own 200-day average of $177.85, losing roughly $90 billion in market capitalization since the start of the year. Similarly, Microsoft (NASDAQ: MSFT) has become a significant laggard, as the market penalizes its massive $107 billion annual capital expenditure budget amidst a slowing macro environment.
Even historically resilient leaders like Apple (NASDAQ: AAPL) have not been spared. Despite its massive cash reserves and "defensive" reputation, Apple’s failure to outpace generative AI competitors has led to its leadership status being "revoked" by major brokerages. As passive index funds—which hold massive weights of AAPL and MSFT—liquidated to meet redemption demands, these mega-cap stocks provided the downward gravity that dragged the indices below their technical floors.
Conversely, the "losers" of the 2025 low-inflation environment are emerging as the "winners" of 2026. The Energy sector, led by giants like Exxon Mobil (NYSE: XOM) and Chevron (NYSE: CVX), has decoupled from the broader market, fueled by the $110+ oil price. Additionally, consumer staple retailers like Walmart (NYSE: WMT) are seeing inflows as investors seek safety in companies with essential-product pricing power. However, these gains are small compared to the trillions in paper wealth erased from the tech sector during the March 19 rout.
Historical Precedents and the 200-Day Rule
To technical analysts, the 200-day moving average is more than just a line on a chart; it is a barometer of the primary trend. Historically, simultaneous breaches are rare and usually precede periods of intense volatility. Data spanning back to 1989 shows that 91 of the S&P 500’s 100 most extreme trading days—both up and down—occurred while the index was trading below its 200-day moving average. This suggests that the coming weeks will likely see increased daily swings, making the market a "minefield" for short-term traders.
The significance of this event fits into a broader trend of "AI fatigue" and the exhaustion of the liquidity cycle. In previous cycles, such as 2011 or 2015, the S&P 500 briefly dipped below its 200-day average only to find support within a 3-5% "buffer zone" and rally. However, in darker chapters like 2008 or the 2022 bear market, a failure to reclaim the 200-day line within 20 trading days signaled a deeper drawdown of 20% or more. The current scenario shares more DNA with 2022, given the inflationary pressure from energy prices and a Federal Reserve that is unable to pivot to a "dovish" stance without risking a currency collapse.
Regulatory and policy implications are also looming. With the market in a tailspin, there are already calls for the SEC to investigate the role of "0DTE" (zero-days-to-expiration) options in accelerating the March 19 sell-off. Furthermore, the political pressure on the Fed to lower rates ahead of the mid-year elections will clash with the reality of $116 oil, creating a policy deadlock that could leave the markets without a safety net for months.
What Comes Next: The "Death Cross" and Market Pivots
In the short term, technical traders are watching for the formation of a "Death Cross"—a bearish signal where the 50-day moving average crosses below the 200-day moving average. Given the velocity of the March 19 decline, many analysts predict this could occur for the Nasdaq 100 (INDEXNASDAQ: .NDX) as early as mid-April. If this happens, it would likely confirm a multi-month bear market, forcing a strategic pivot for institutional investors away from "growth at any price" and toward "capital preservation."
Strategic adaptations are already underway. Wealth management firms are reportedly increasing allocations to Treasury inflation-protected securities (TIPS) and gold, which has surged past $2,500 an ounce as a hedge against the triple-index breakdown. The "buy the dip" mentality that characterized the last decade is being replaced by "sell the rip," where any minor recovery toward the 200-day line is met with fresh selling pressure from those looking to exit positions at a smaller loss.
Market opportunities may eventually emerge in "Old Economy" value stocks and small-caps that have already been beaten down over the last year. However, until the S&P 500 (INDEXSP: .INX) can reclaim the 6,618 level on high volume, these opportunities remain high-risk. The "bull case" now relies entirely on a rapid de-escalation of the U.S.-Iran conflict or a surprising cooling of inflation data, neither of which appears imminent as of late March.
Wrap-Up: A New Regime for Investors
The events of March 19, 2026, mark a definitive end to the unbridled optimism that fueled the markets since the AI revolution began in earnest. The simultaneous loss of the 200-day moving average across the S&P 500, Nasdaq 100, and Dow Jones is a technical "red alert" that cannot be ignored. It suggests that the systemic support for high valuations has evaporated, replaced by a macro environment defined by geopolitical risk and persistent inflation.
Moving forward, the market will be in a "show me" mode. Investors should watch for whether the indices can mount a "relief rally" back to their 200-day averages or if those averages now act as "ceiling" resistance. The lasting impact of this breakdown will likely be a more discerning market where earnings quality and balance sheet strength matter more than futuristic growth promises.
In the coming months, the critical metrics to watch will be the "win rate" of stocks attempting to reclaim their moving averages and the Federal Reserve’s reaction to the dual threats of a falling market and rising energy costs. For now, the "line in the sand" has been crossed, and the burden of proof has shifted from the bears back to the bulls.
This content is intended for informational purposes only and is not financial advice.