Welding and cutting equipment manufacturer ESAB (NYSE: ESAB) met Wall Street’s revenue expectations in Q3 2026, with revenue up 13.3% year on year to $824.5 million. Its non-GAAP profit of $1.30 per share was 2% below analysts’ consensus estimates.
For more on ESAB, read our free full research report.
ESAB (ESAB) Q3 2026 highlights:
- Revenue $824.5 million vs S&P analysts’ consensus estimates of $828.5 million (13.3% year-on-year growth, in line)
- Adjusted EPS $1.30 vs S&P analysts’ consensus estimates of $1.33 (2% miss)
- Adjusted EBITDA $159 million vs analysts’ consensus estimates of $160 million (19.3% margin, 0.6% miss)
- Adjusted EPS guidance Management lowered its full-year adjusted EPS guidance to $5.31 at the midpoint, a 2.7% decrease
- EBITDA guidance $605 million at the midpoint for the full year, below analysts’ consensus estimates of $615.1 million
- Operating margin 11.1%, down from 14.6% in the same quarter last year
- Free cash flow margin 6.6%, down from 9.7% in the same quarter last year
- Organic revenue rose 2.3% year on year (miss)
- Market capitalization $4.73 billion
“ESAB delivered record third quarter core sales and adjusted EBITDA, with organic growth in both segments, despite a dynamic global environment and continued inflationary pressure. We improved sales, margins and cash generation sequentially. Disciplined execution, investment in growth and our EBXai operating system are delivering results,” said Shyam P. Kambeyanda, ESAB President and CEO. “We built this enterprise to win in any market, and we are executing with urgency to capture the opportunities ahead.”
Revenue growth
A company’s long-term revenue performance can indicate its overall quality. Any business can experience short-term success, but top-performing ones sustain growth for years. Over the last five years, ESAB grew its revenue at a tepid 5.7% compounded annual growth rate, falling short of the industrials sector benchmark.
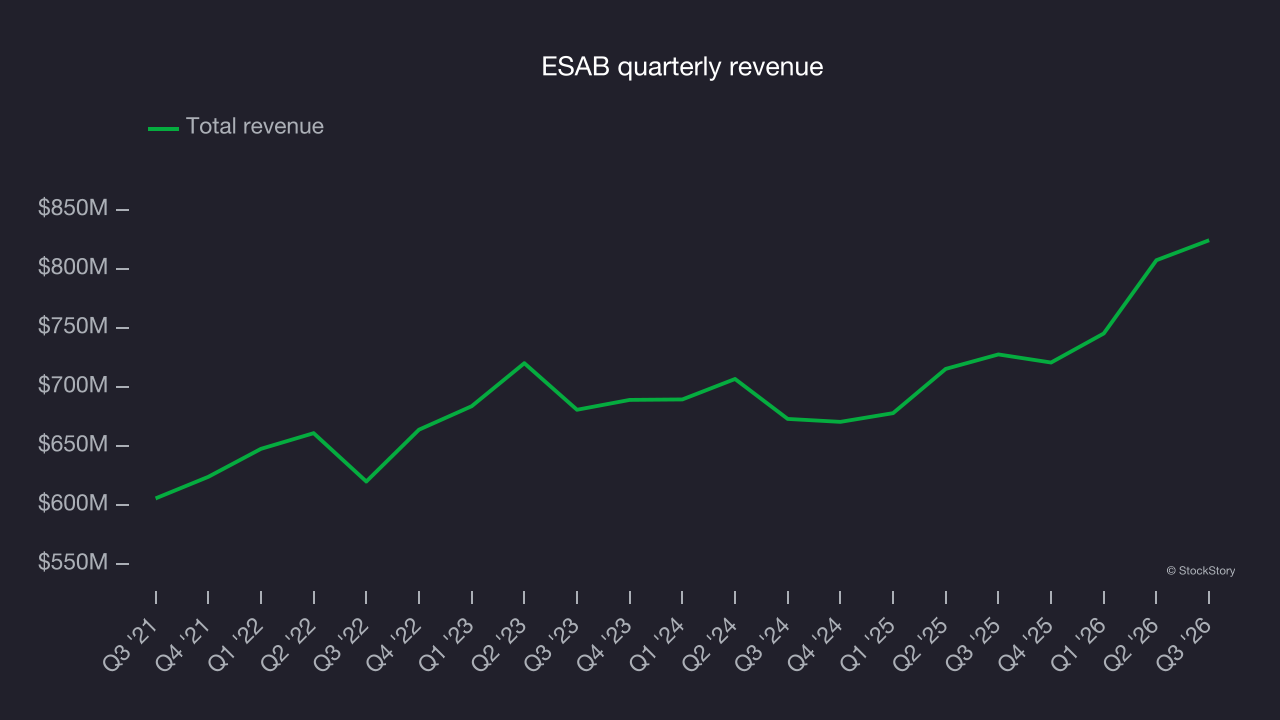
Long-term growth is the most important, but within industrials, a half-decade historical view may miss new industry trends or demand cycles. ESAB’s annualized revenue growth of 6% over the last two years aligns with its five-year trend, suggesting its demand was consistently weak. 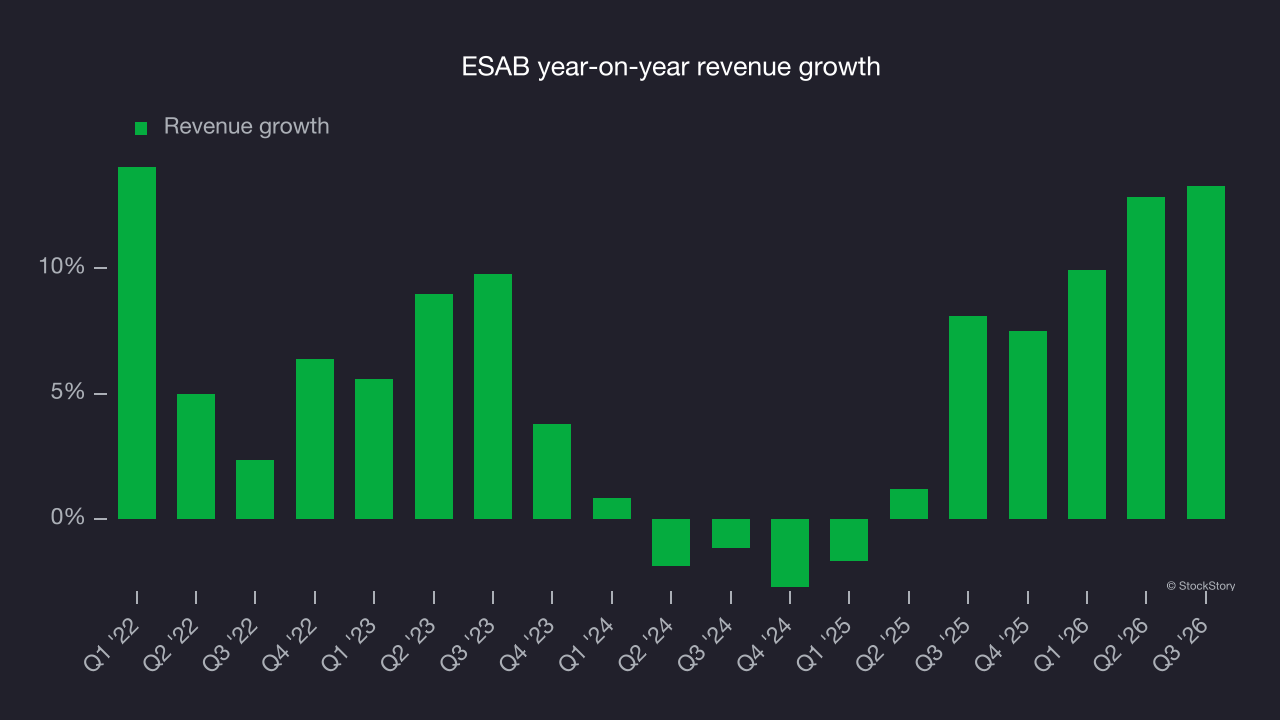
Organic revenue offers a closer look at the company’s revenue dynamics by stripping out one-time events like acquisitions and currency fluctuations that don’t accurately reflect its fundamentals. Over the last two years, ESAB’s organic revenue was flat. Revenue growth outpaced organic revenue growth over that period, indicating that a combination of acquisitions and foreign exchange rates boosted its headline results. 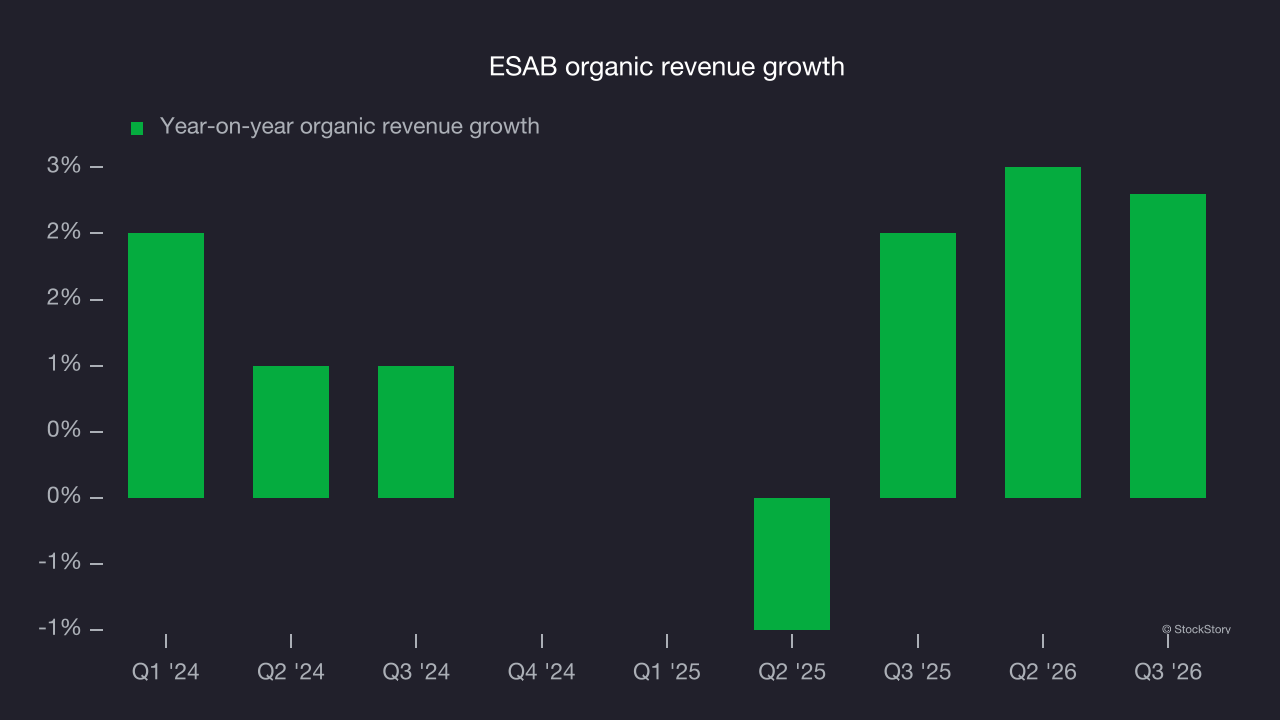
This quarter, ESAB’s year-on-year revenue growth was 13.3%, and its $824.5 million of revenue was in line with Wall Street’s consensus estimates.
Looking ahead, sell-side analysts expect revenue to grow 11.1% over the next 12 months, according to S&P, an improvement versus the last two years. This favorable projection indicates its newer products and services will drive better revenue performance.
Operating margin
ESAB has been an efficient company over the last five years. It was one of the more profitable businesses in the industrials sector, with an average operating margin of 13.8%. That outcome is unsurprising given its high gross margin baseline.
ESAB’s operating margin decreased by 1.4 percentage points over the last five years. This raises questions about the company’s expense base because its revenue growth should have given it leverage on its fixed costs, resulting in better economies of scale and profitability.
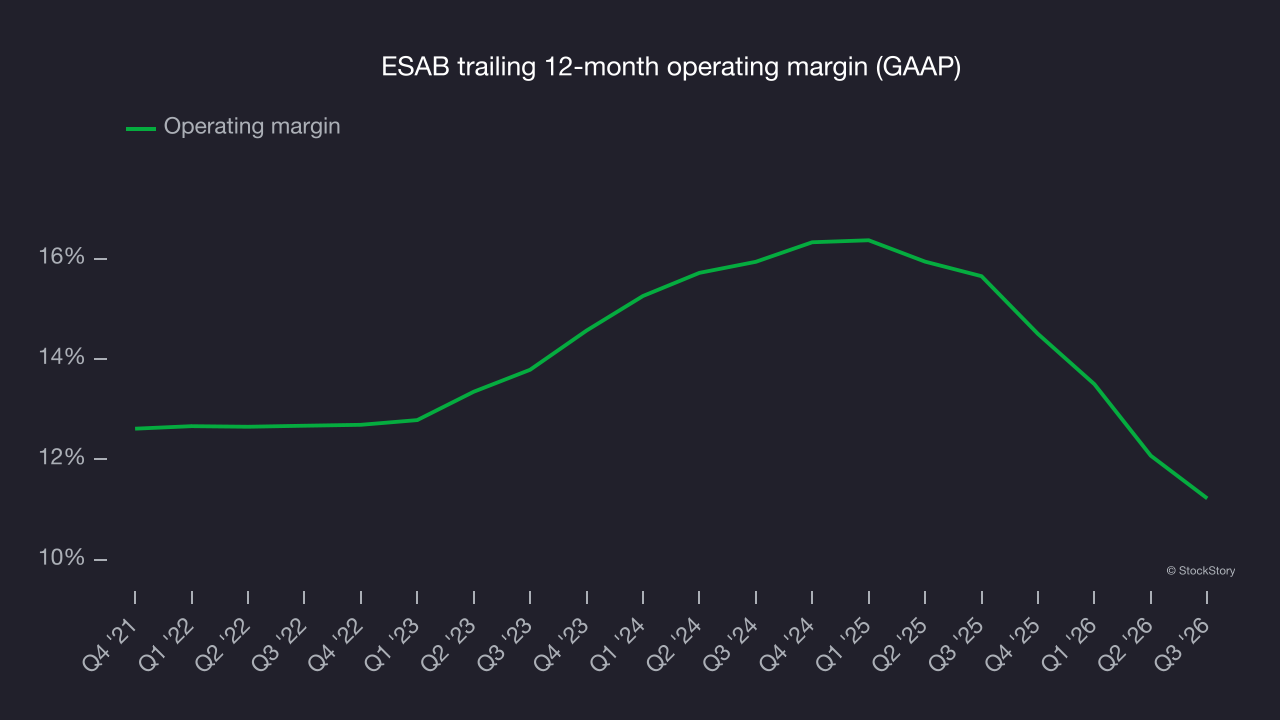
In Q3, ESAB generated an operating margin of 11.1%, down 3.5 percentage points year on year. However, its revenue and gross margin rose, suggesting it was less efficient because its operating expenses, such as marketing, R&D and administrative overhead, grew faster than its revenue.
Earnings per share
Revenue trends explain a company’s historical growth, but the long-term change in earnings per share (EPS) points to the profitability of that growth. For example, a company could inflate its revenue through excessive spending on advertising and promotions.
ESAB’s full-year EPS grew at an unimpressive 7.1% compounded annual growth rate over the last four years, worse than the broader industrials sector.
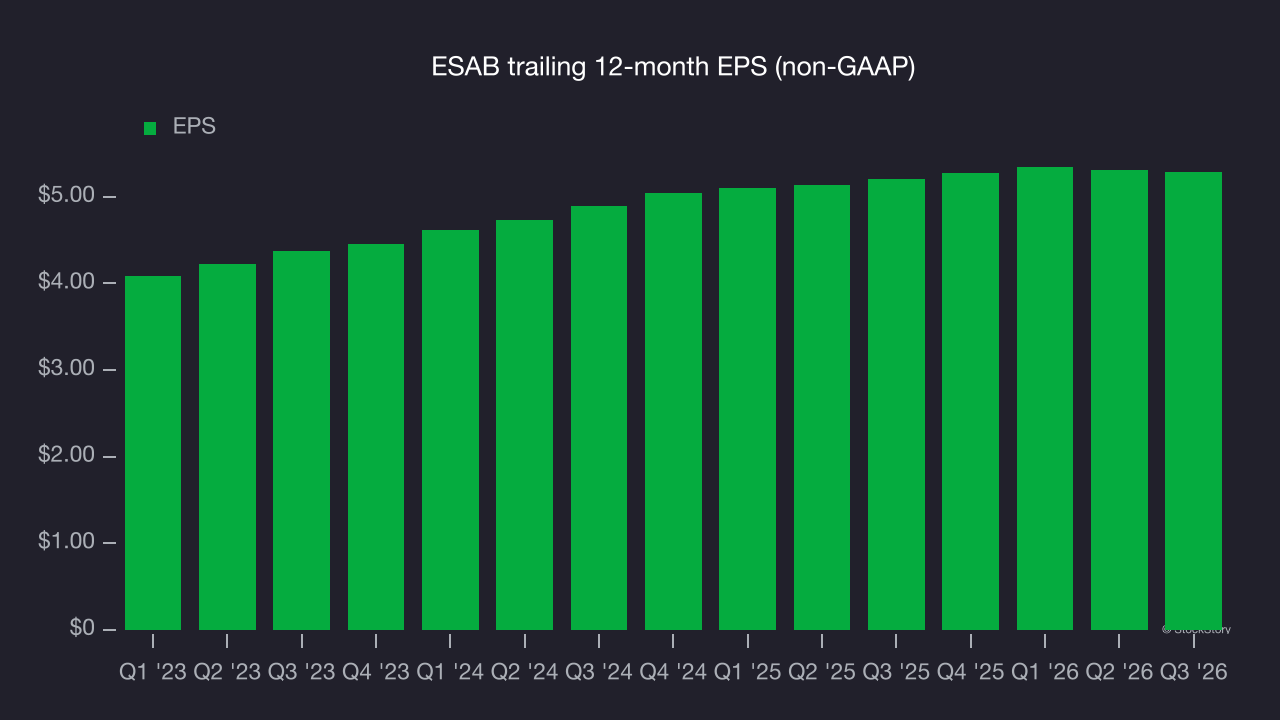
As with revenue, we analyze EPS over a shorter period to see if we are missing a change in the business.
ESAB’s EPS grew at a weak 3.9% compounded annual growth rate over the last two years, lower than its 6% annualized revenue growth. This tells us the company became less profitable on a per-share basis as it expanded.
A closer look at ESAB’s earnings can help explain its performance. ESAB’s operating margin has declined over the last two years while its share count has grown 1.8%. This means the company not only became less efficient with its operating expenses but also diluted its shareholders. 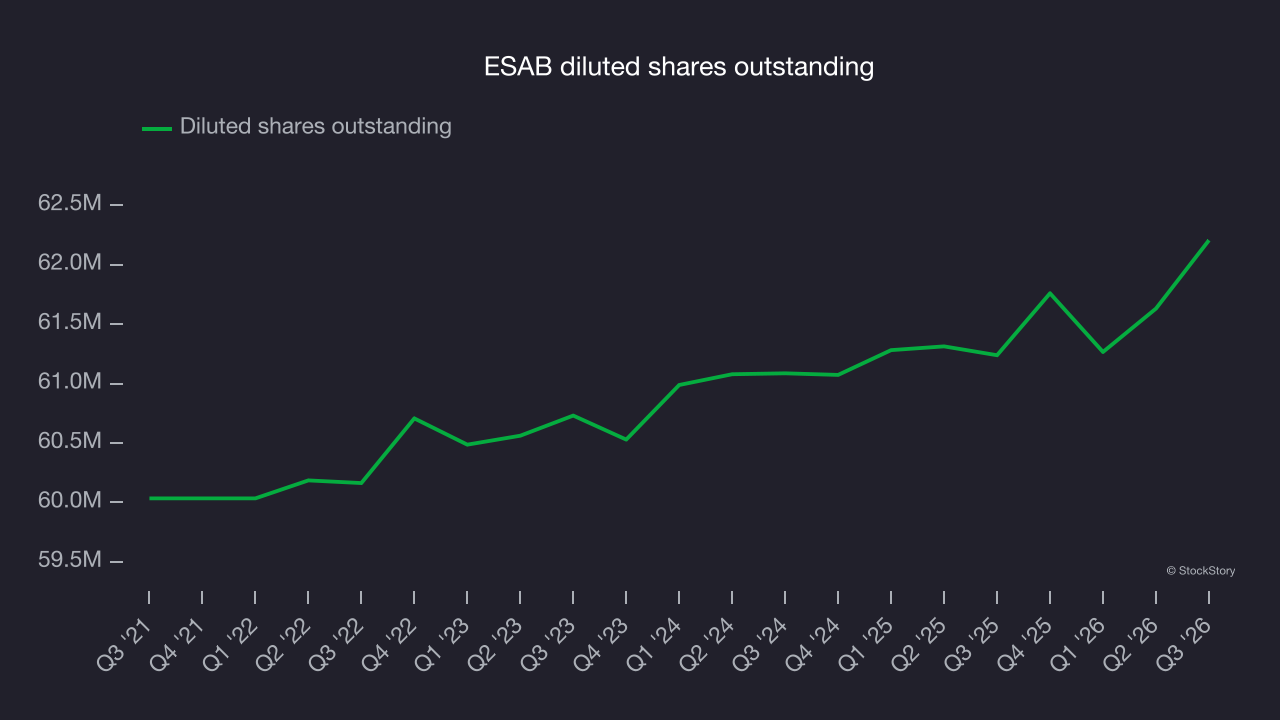
In Q3, ESAB reported adjusted EPS of $1.30, down from $1.32 in the same quarter last year. This result missed analysts’ consensus estimates. Over the next 12 months, Wall Street expects ESAB’s full-year EPS to grow 15.9% from $5.29 to $6.13, according to S&P.
Key takeaways from ESAB’s Q3 results
ESAB’s quarter offered few positives: EPS fell short of Wall Street’s consensus estimates, and full-year EBITDA guidance also missed expectations. The results could have been better, and shares fell 4.4% to $72.71 immediately after the release.
ESAB’s earnings report left more to be desired. A look ahead can help assess whether this quarter has created an investment opportunity. When making that decision, it’s important to consider its valuation and business quality, as well as what happened in the latest quarter. For more on ESAB, read our full research report here (it’s free).