
Dental products company Envista Holdings (NYSE: NVST) beat Wall Street’s revenue expectations in Q4 CY2025, with sales up 15% year on year to $750.6 million. Its non-GAAP profit of $0.38 per share was 17.7% above analysts’ consensus estimates.
Is now the time to buy Envista? Find out by accessing our full research report, it’s free.
Envista (NVST) Q4 CY2025 Highlights:
- Revenue: $750.6 million vs analyst estimates of $678.7 million (15% year-on-year growth, 10.6% beat)
- Adjusted EPS: $0.38 vs analyst estimates of $0.32 (17.7% beat)
- Adjusted EBITDA: $111 million vs analyst estimates of $100.7 million (14.8% margin, 10.2% beat)
- Adjusted EPS guidance for the upcoming financial year 2026 is $1.40 at the midpoint, beating analyst estimates by 9.6%
- Operating Margin: 9.8%, up from 7.1% in the same quarter last year
- Free Cash Flow Margin: 14.4%, down from 19% in the same quarter last year
- Market Capitalization: $3.89 billion
"With our disciplined focus on Growth, Operations, and People, Q4 2025 marked another quarter of continued progress for Envista," said Paul Keel, CEO.
Company Overview
Uniting more than 30 trusted brands including Nobel Biocare, Ormco, and DEXIS under one corporate umbrella, Envista Holdings (NYSE: NVST) is a global dental products company that provides equipment, consumables, and specialized technologies for dental professionals.
Revenue Growth
A company’s long-term sales performance can indicate its overall quality. Any business can experience short-term success, but top-performing ones enjoy sustained growth for years. Over the last five years, Envista grew its sales at a mediocre 7.1% compounded annual growth rate. This was below our standard for the healthcare sector and is a rough starting point for our analysis.
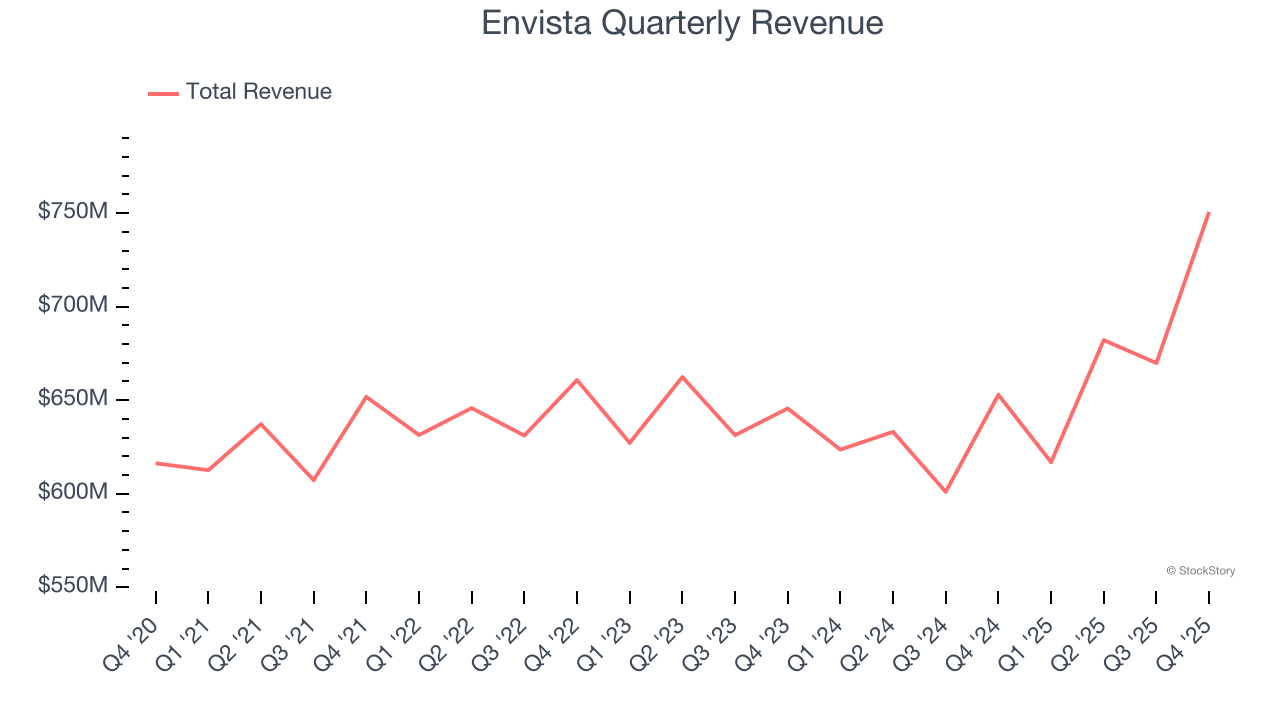
Long-term growth is the most important, but within healthcare, a half-decade historical view may miss new innovations or demand cycles. Envista’s recent performance shows its demand has slowed as its annualized revenue growth of 2.9% over the last two years was below its five-year trend. 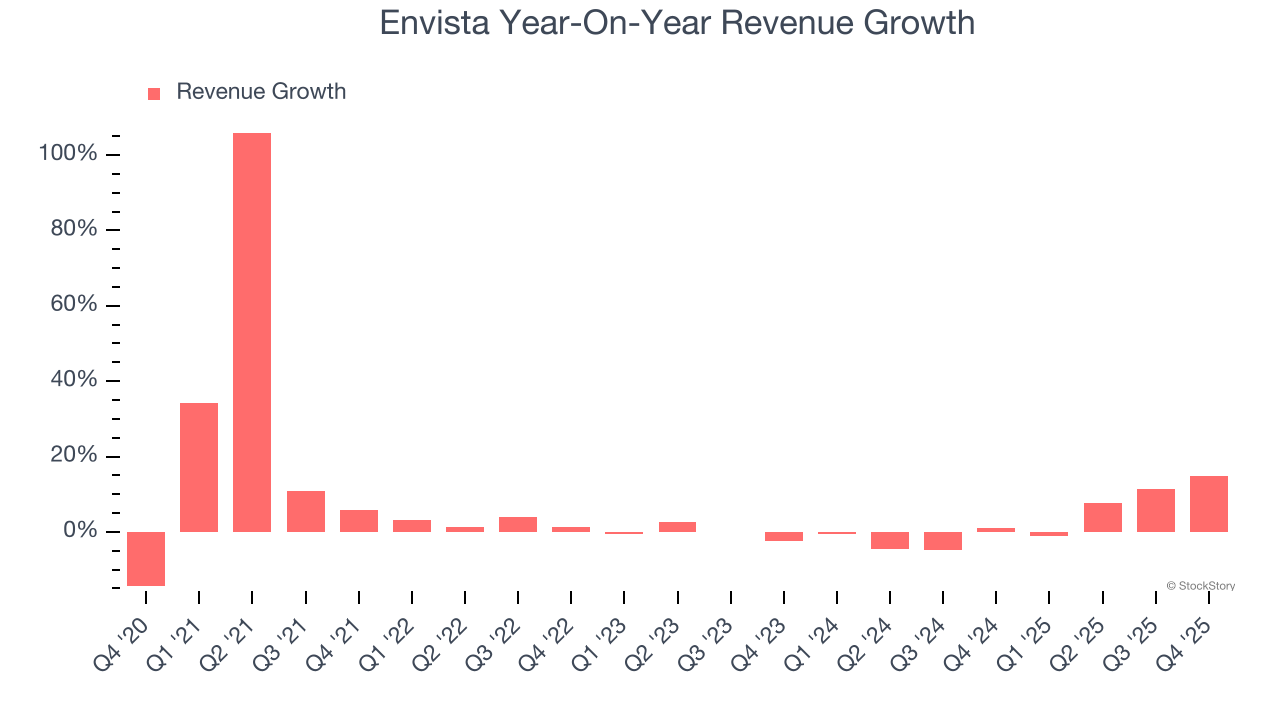
This quarter, Envista reported year-on-year revenue growth of 15%, and its $750.6 million of revenue exceeded Wall Street’s estimates by 10.6%.
Looking ahead, sell-side analysts expect revenue to remain flat over the next 12 months, a slight deceleration versus the last two years. This projection doesn't excite us and implies its products and services will see some demand headwinds.
Software is eating the world and there is virtually no industry left that has been untouched by it. That drives increasing demand for tools helping software developers do their jobs, whether it be monitoring critical cloud infrastructure, integrating audio and video functionality, or ensuring smooth content streaming. Click here to access a free report on our 3 favorite stocks to play this generational megatrend.
Operating Margin
Operating margin is one of the best measures of profitability because it tells us how much money a company takes home after subtracting all core expenses, like marketing and R&D.
Although Envista was profitable this quarter from an operational perspective, it’s generally struggled over a longer time period. Its expensive cost structure has contributed to an average operating margin of negative 1.3% over the last five years. Unprofitable healthcare companies require extra attention because they could get caught swimming naked when the tide goes out. It’s hard to trust that the business can endure a full cycle.
Analyzing the trend in its profitability, Envista’s operating margin decreased by 4.3 percentage points over the last five years, but it rose by 6.7 percentage points on a two-year basis. Still, shareholders will want to see Envista become more profitable in the future.
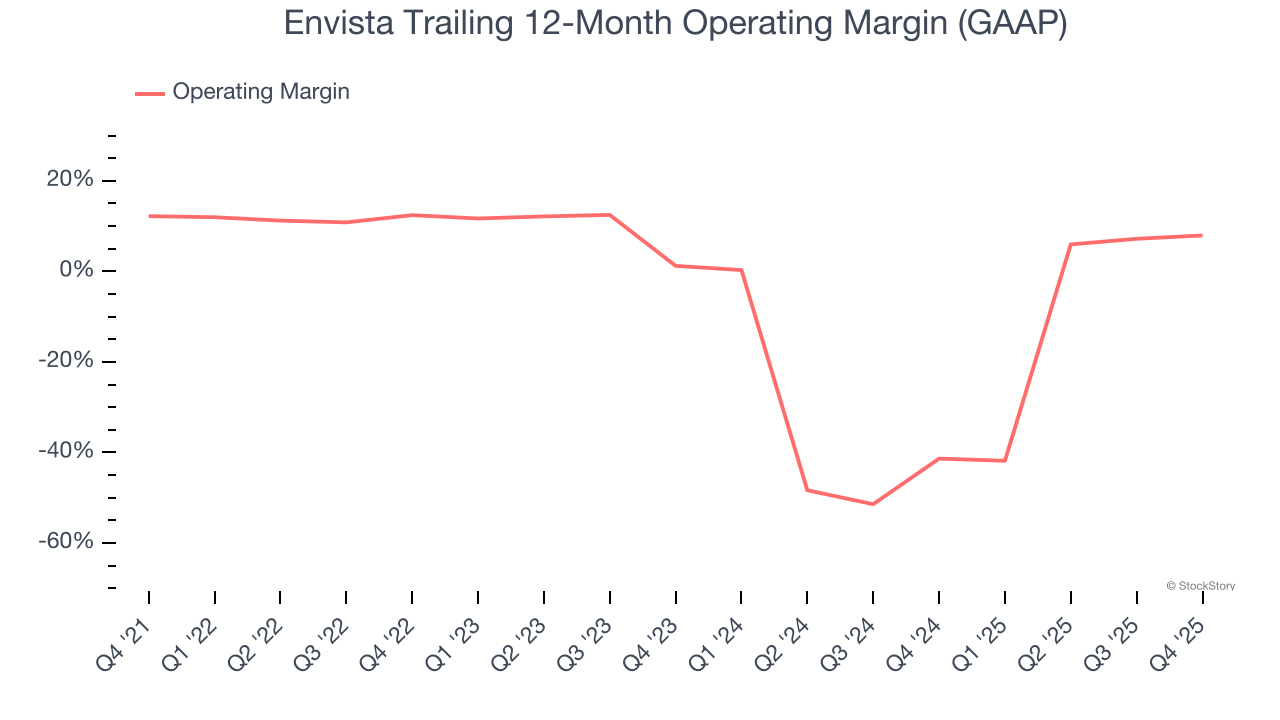
In Q4, Envista generated an operating margin profit margin of 9.8%, up 2.7 percentage points year on year. This increase was a welcome development and shows it was more efficient.
Earnings Per Share
We track the long-term change in earnings per share (EPS) for the same reason as long-term revenue growth. Compared to revenue, however, EPS highlights whether a company’s growth is profitable.
Envista’s EPS grew at an unimpressive 4.3% compounded annual growth rate over the last five years, lower than its 7.1% annualized revenue growth. This tells us the company became less profitable on a per-share basis as it expanded due to non-fundamental factors such as interest expenses and taxes.
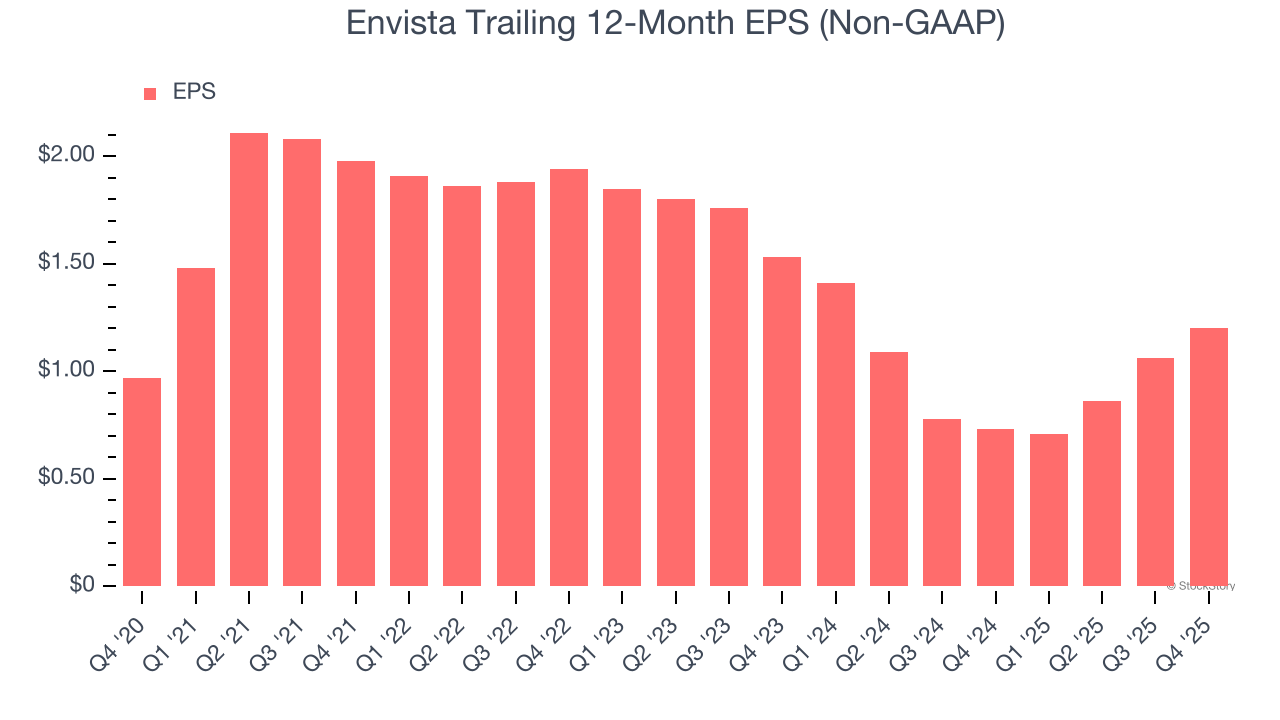
Diving into the nuances of Envista’s earnings can give us a better understanding of its performance. As we mentioned earlier, Envista’s operating margin expanded this quarter but declined by 4.3 percentage points over the last five years. This was the most relevant factor (aside from the revenue impact) behind its lower earnings; interest expenses and taxes can also affect EPS but don’t tell us as much about a company’s fundamentals.
In Q4, Envista reported adjusted EPS of $0.38, up from $0.24 in the same quarter last year. This print easily cleared analysts’ estimates, and shareholders should be content with the results. Over the next 12 months, Wall Street expects Envista’s full-year EPS of $1.20 to grow 6.7%.
Key Takeaways from Envista’s Q4 Results
We were impressed by how significantly Envista blew past analysts’ revenue expectations this quarter. We were also excited its full-year EPS guidance outperformed Wall Street’s estimates by a wide margin. Zooming out, we think this was a solid print. The stock traded up 2.3% to $25.27 immediately after reporting.
Envista had an encouraging quarter, but one earnings result doesn’t necessarily make the stock a buy. Let’s see if this is a good investment. We think that the latest quarter is only one piece of the longer-term business quality puzzle. Quality, when combined with valuation, can help determine if the stock is a buy. We cover that in our actionable full research report which you can read here (it’s free).