Regional banking company Banner Corporation (NASDAQ: BANR) met Wall Street’s revenue expectations in Q1 CY2026, with sales up 3.8% year on year to $169.3 million. Its non-GAAP profit of $1.59 per share was 15.8% above analysts’ consensus estimates.
Is now the time to buy Banner Bank? Find out by accessing our full research report, it’s free.
Banner Bank (BANR) Q1 CY2026 Highlights:
- Net Interest Income: $150.2 million vs analyst estimates of $150 million (6.4% year-on-year growth, in line)
- Net Interest Margin: 4.1% vs analyst estimates of 4% (7.4 basis point beat)
- Revenue: $169.3 million vs analyst estimates of $170 million (3.8% year-on-year growth, in line)
- Efficiency Ratio: 60.6% vs analyst estimates of 61.7% (111.4 basis point beat)
- Adjusted EPS: $1.59 vs analyst estimates of $1.37 (15.8% beat)
- Tangible Book Value per Share: $47 vs analyst estimates of $46.79 (11.2% year-on-year growth, in line)
- Market Capitalization: $2.16 billion
Company Overview
Founded in 1890 in Walla Walla, Washington, and evolving through more than a century of economic cycles, Banner Corporation (NASDAQ: BANR) operates Banner Bank, providing commercial banking services, loans, and financial products to individuals and businesses across Washington, Oregon, California, Idaho, and Utah.
Sales Growth
In general, banks make money from two primary sources. The first is net interest income, which is interest earned on loans, mortgages, and investments in securities minus interest paid out on deposits. The second source is non-interest income, which can come from bank account, credit card, wealth management, investing banking, and trading fees. Over the last five years, Banner Bank grew its revenue at a sluggish 3% compounded annual growth rate. This fell short of our benchmark for the banking sector and is a tough starting point for our analysis.
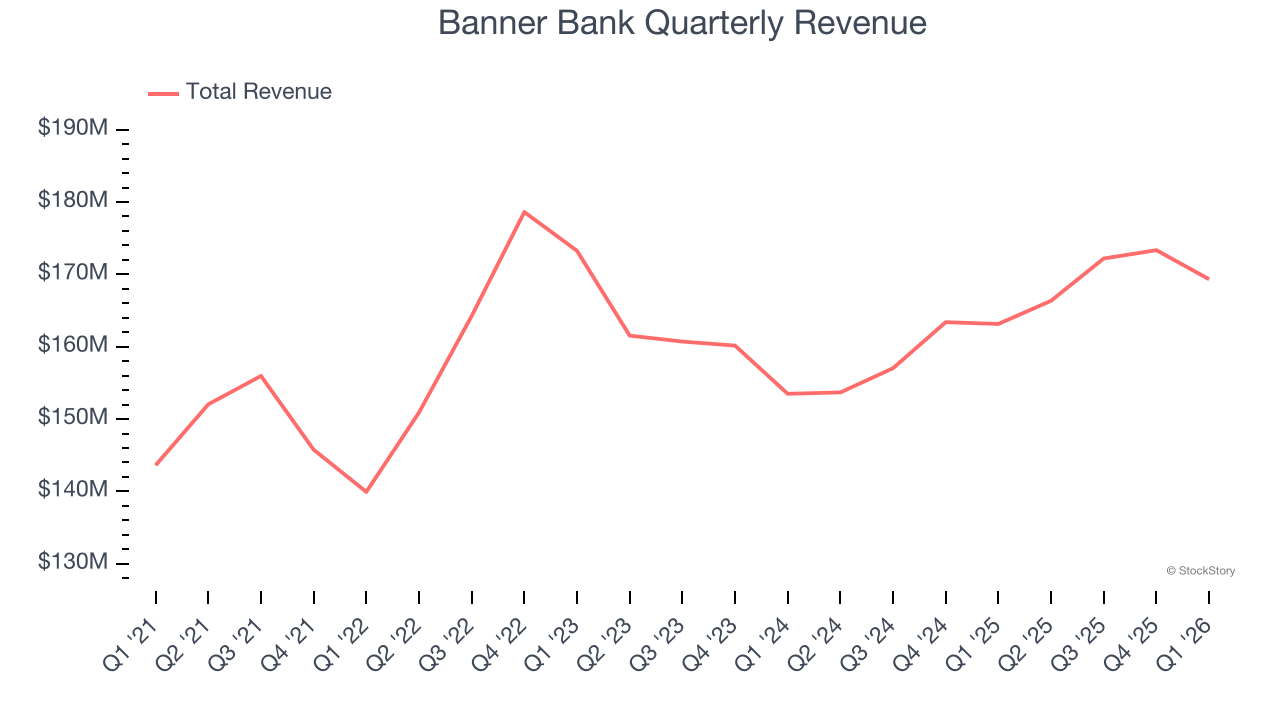
We at StockStory place the most emphasis on long-term growth, but within financials, a half-decade historical view may miss recent interest rate changes, market returns, and industry trends. Banner Bank’s annualized revenue growth of 3.5% over the last two years aligns with its five-year trend, suggesting its demand was consistently weak. 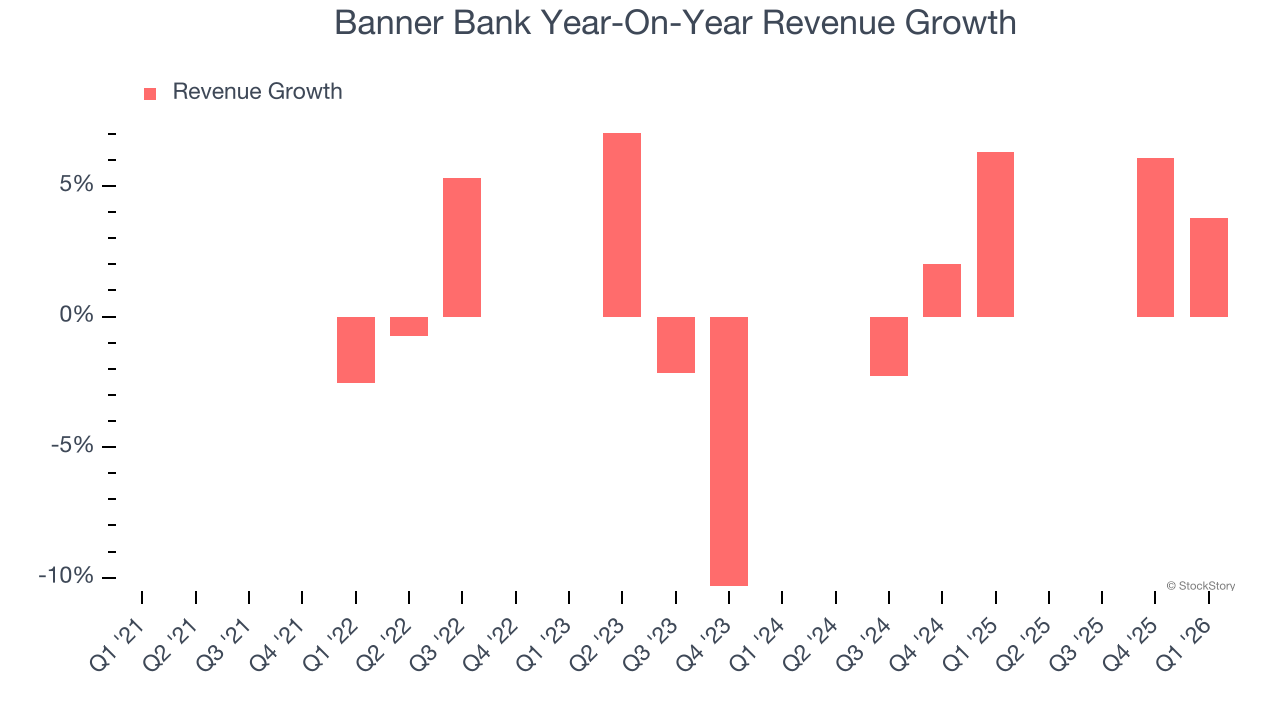 Note: Quarters not shown were determined to be outliers, impacted by outsized investment gains/losses that are not indicative of the recurring fundamentals of the business.
This quarter, Banner Bank grew its revenue by 3.8% year on year, and its $169.3 million of revenue was in line with Wall Street’s estimates.
Net interest income made up 86.6% of the company’s total revenue during the last five years, meaning Banner Bank barely relies on non-interest income to drive its overall growth.
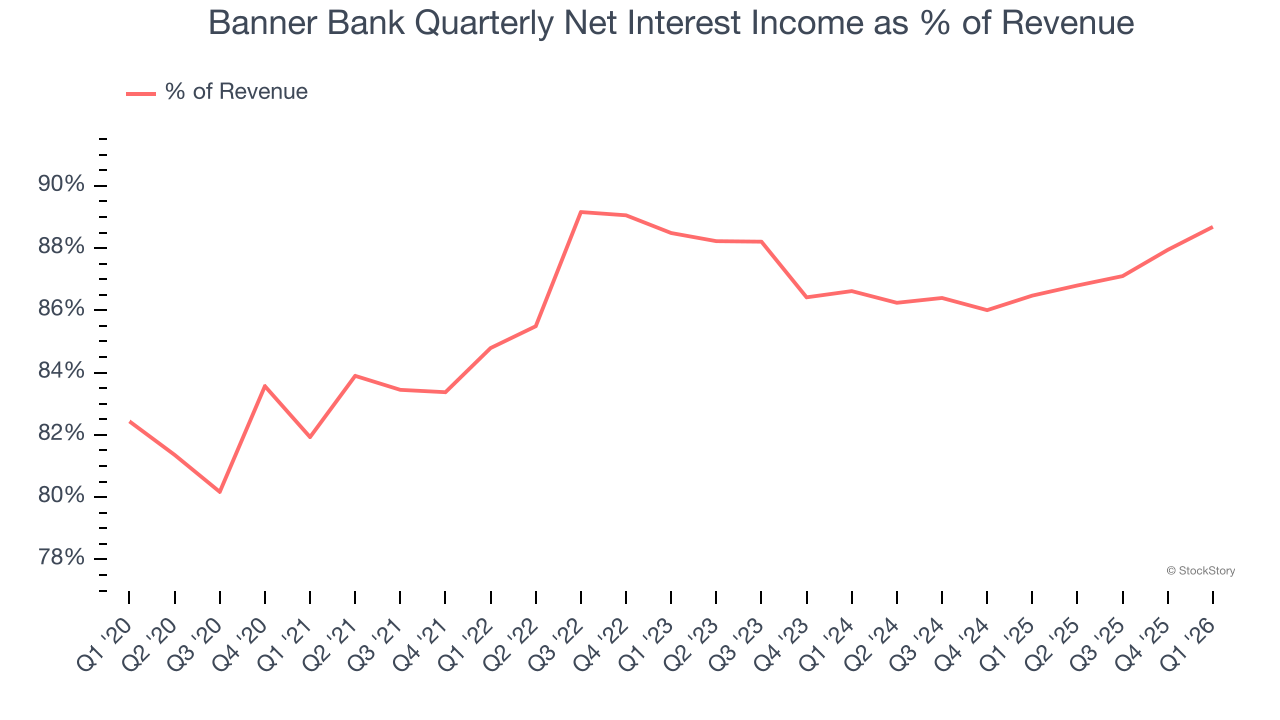
While banks generate revenue from multiple sources, investors view net interest income as the cornerstone - its predictable, recurring characteristics stand in sharp contrast to the volatility of non-interest income.
ONE MORE THING: The $21 AI Application Stock Wall Street Forgot. While Wall Street obsesses over who’s building AI, one company is already using it to print money. And nobody’s paying attention.
AI chip stocks trade at ridiculous valuations. This company processes a trillion consumer signals monthly using AI and trades at a third of the price. The gap won’t last. The institutions will figure it out. You need to see this first. Read the FREE Report Before They Notice.
Tangible Book Value Per Share (TBVPS)
The balance sheet drives banking profitability since earnings flow from the spread between borrowing and lending rates. As such, valuations for these companies concentrate on capital strength and sustainable equity accumulation potential.
This explains why tangible book value per share (TBVPS) stands as the premier banking metric. TBVPS strips away questionable intangible assets, revealing concrete per-share net worth that investors can trust. EPS can become murky due to acquisition impacts or accounting flexibility around loan provisions, and TBVPS resists financial engineering manipulation.
Banner Bank’s TBVPS grew at a decent 5.9% annual clip over the last five years. TBVPS growth has accelerated recently, growing by 12.1% annually over the last two years from $37.40 to $47 per share.
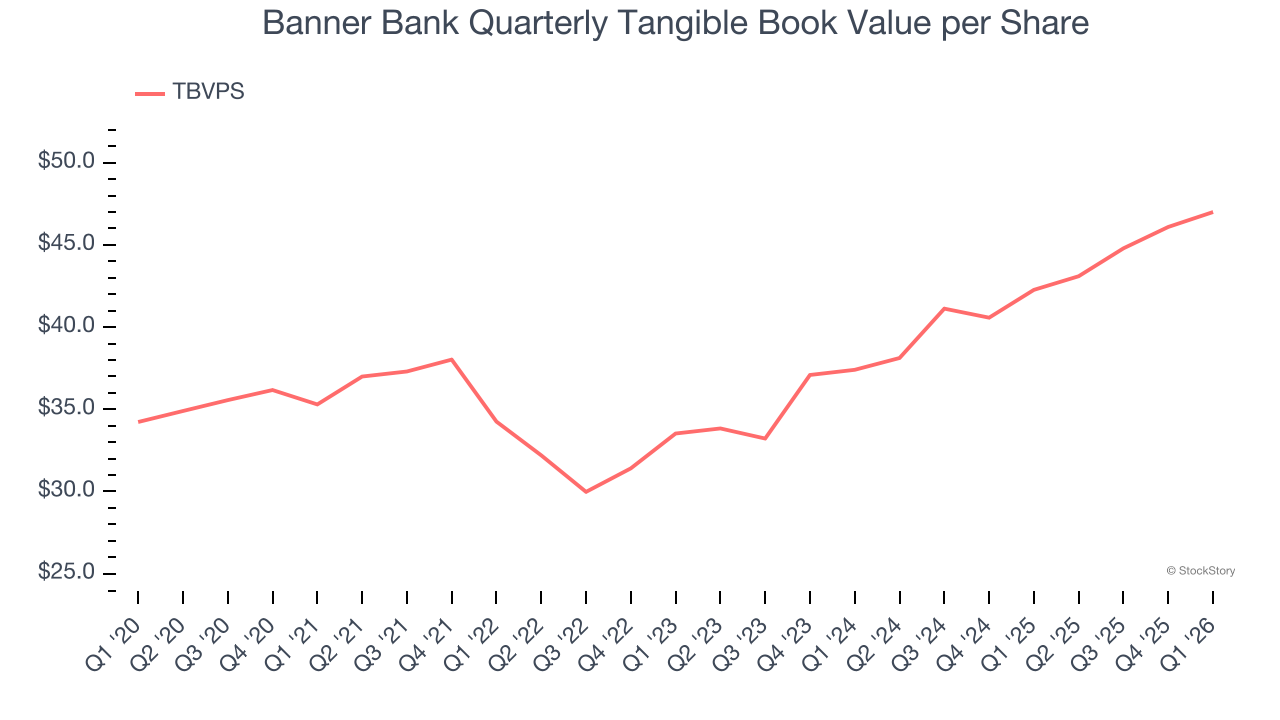
Over the next 12 months, Consensus estimates call for Banner Bank’s TBVPS to grow by 8.6% to $51.06, paltry growth rate.
Key Takeaways from Banner Bank’s Q1 Results
It was good to see Banner Bank beat analysts’ EPS expectations this quarter. On the other hand, its revenue was in line. Overall, this print had some key positives. The stock remained flat at $63.54 immediately following the results.
Indeed, Banner Bank had a rock-solid quarterly earnings result, but is this stock a good investment here? What happened in the latest quarter matters, but not as much as longer-term business quality and valuation, when deciding whether to invest in this stock. We cover that in our actionable full research report which you can read here (it’s free).