Technology and consulting giant IBM (NYSE: IBM) beat Wall Street’s revenue expectations in Q1 CY2026, with sales up 9.5% year on year to $15.92 billion. Its non-GAAP profit of $1.91 per share was 5.5% above analysts’ consensus estimates.
Is now the time to buy IBM? Find out by accessing our full research report, it’s free.
IBM (IBM) Q1 CY2026 Highlights:
- Revenue: $15.92 billion vs analyst estimates of $15.71 billion (9.5% year-on-year growth, 1.3% beat)
- Segment revenue: Software revenue of $7.05 billion vs analyst estimates of $7.03 billion (slight beat)
- Adjusted EPS: $1.91 vs analyst estimates of $1.81 (5.5% beat)
- Adjusted EBITDA: $4 billion vs analyst estimates of $3.54 billion (25.1% margin, 13% beat)
- Operating Margin: 11.7%, up from 10% in the same quarter last year
- Free Cash Flow Margin: 13.9%, similar to the same quarter last year
- Market Capitalization: $239.9 billion
"The first quarter was a strong start to the year with broad-based revenue growth across our segments. These results reflect the integrated value of our portfolio and the trust clients put in us to improve their operations. As clients scale use cases, AI continues to be a tailwind for our global business. IBM products and services are helping clients orchestrate, deploy and govern AI across hybrid environments," said Arvind Krishna, IBM chairman, president and chief executive officer.
Company Overview
With a corporate history spanning over a century and once known for its iconic mainframe computers, IBM (NYSE: IBM) provides hybrid cloud computing platforms, AI solutions, consulting services, and enterprise infrastructure to help businesses modernize their operations.
Revenue Growth
A company’s long-term sales performance is one signal of its overall quality. Any business can put up a good quarter or two, but the best consistently grow over the long haul.
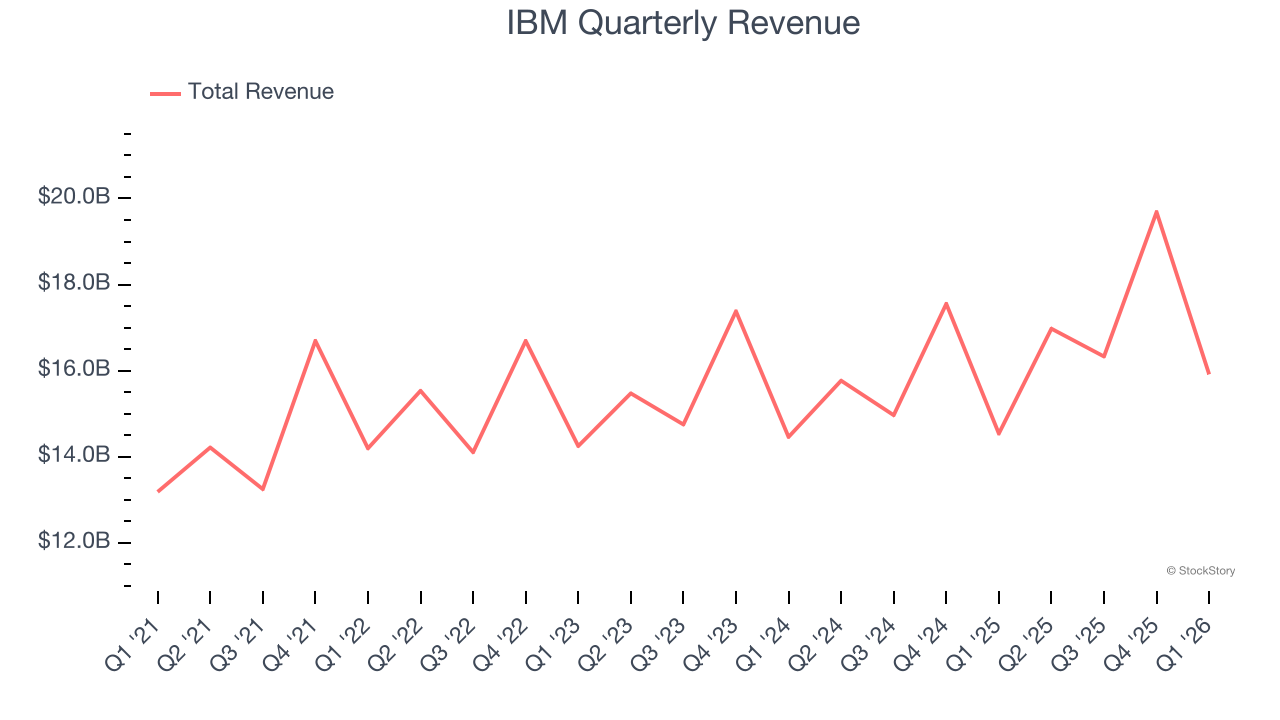
With $68.91 billion in revenue over the past 12 months, IBM is a behemoth in the business services sector and benefits from economies of scale, giving it an edge in distribution. This also enables it to gain more leverage on its fixed costs than smaller competitors and the flexibility to offer lower prices. However, its scale is a double-edged sword because finding new avenues for growth becomes difficult when you already have a substantial market presence. To accelerate sales, IBM likely needs to optimize its pricing or lean into new offerings and international expansion.
As you can see below, IBM’s 4.5% annualized revenue growth over the last five years was mediocre. This shows it couldn’t generate demand in any major way and is a tough starting point for our analysis.
Long-term growth is the most important, but within business services, a half-decade historical view may miss new innovations or demand cycles. IBM’s annualized revenue growth of 5.4% over the last two years aligns with its five-year trend, suggesting its demand was stable. 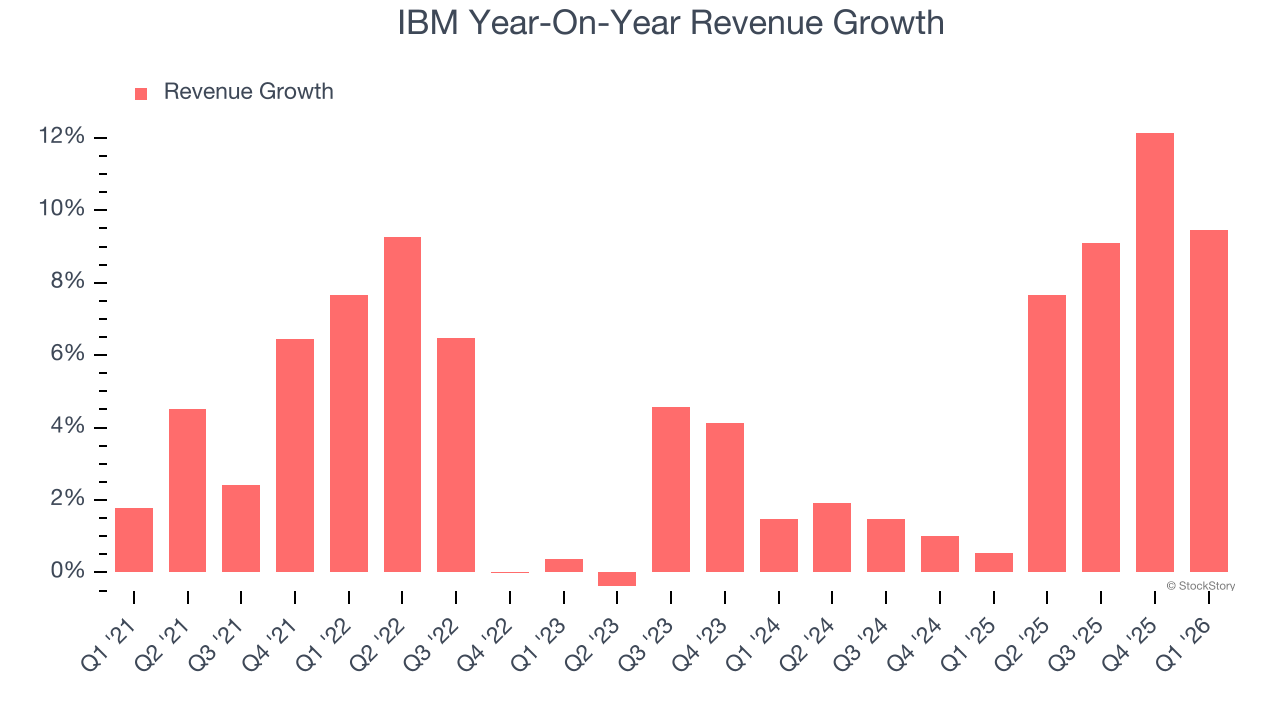
We can better understand the company’s revenue dynamics by analyzing its most important segment, Software. Over the last two years, IBM’s Software revenue averaged 10.6% year-on-year growth. This segment has outperformed its total sales during the same period, lifting the company’s performance. 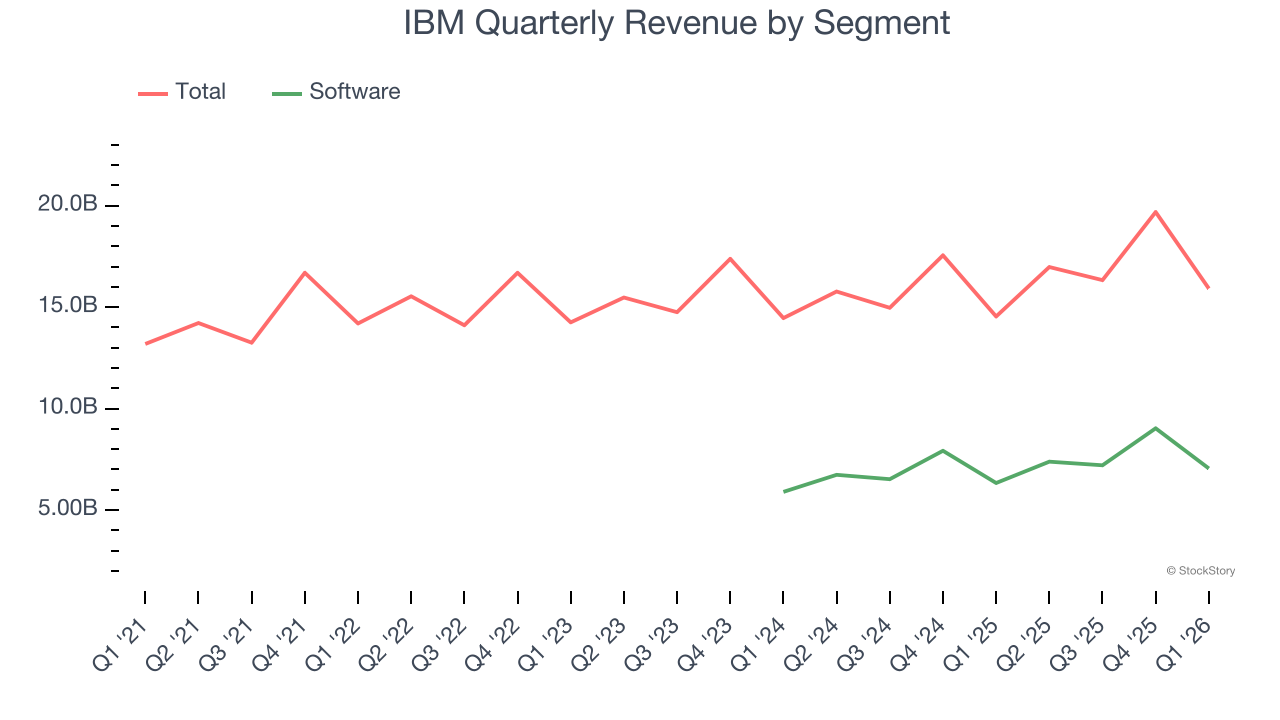
This quarter, IBM reported year-on-year revenue growth of 9.5%, and its $15.92 billion of revenue exceeded Wall Street’s estimates by 1.3%.
Looking ahead, sell-side analysts expect revenue to grow 4.4% over the next 12 months, similar to its two-year rate. This projection doesn't excite us and implies its newer products and services will not lead to better top-line performance yet.
ONE MORE THING: 3 Hidden Platforms Growing 3X Faster than Amazon, Google, and PayPal. Amazon, Google, and Meta all followed the same playbook: Dominate an ignored market. Build an unbeatable moat. Scale until you’re unstoppable.
These three platforms are running that exact playbook right now. The early investors in Amazon made fortunes. The early investors in these could do the same. Get All 3 Stocks Here for FREE.
Adjusted Operating Margin
Adjusted operating margin is a key measure of profitability. Think of it as net income (the bottom line) excluding the impact of non-recurring expenses, taxes, and interest on debt - metrics less connected to business fundamentals.
IBM has been an efficient company over the last five years. It was one of the more profitable businesses in the business services sector, boasting an average adjusted operating margin of 17.9%.
Analyzing the trend in its profitability, IBM’s adjusted operating margin rose by 5.5 percentage points over the last five years, as its sales growth gave it operating leverage.
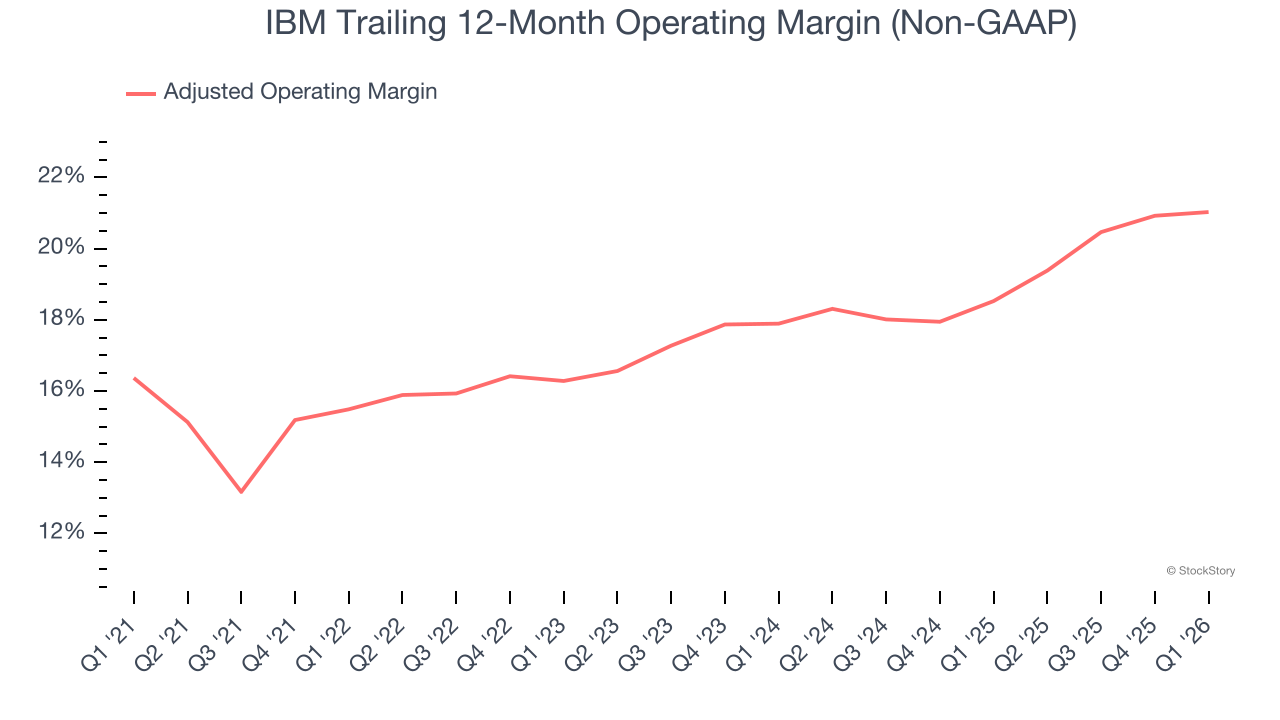
This quarter, IBM generated an adjusted operating margin profit margin of 14.9%, up 1.1 percentage points year on year. This increase was a welcome development and shows it was more efficient.
Earnings Per Share
Revenue trends explain a company’s historical growth, but the long-term change in earnings per share (EPS) points to the profitability of that growth – for example, a company could inflate its sales through excessive spending on advertising and promotions.
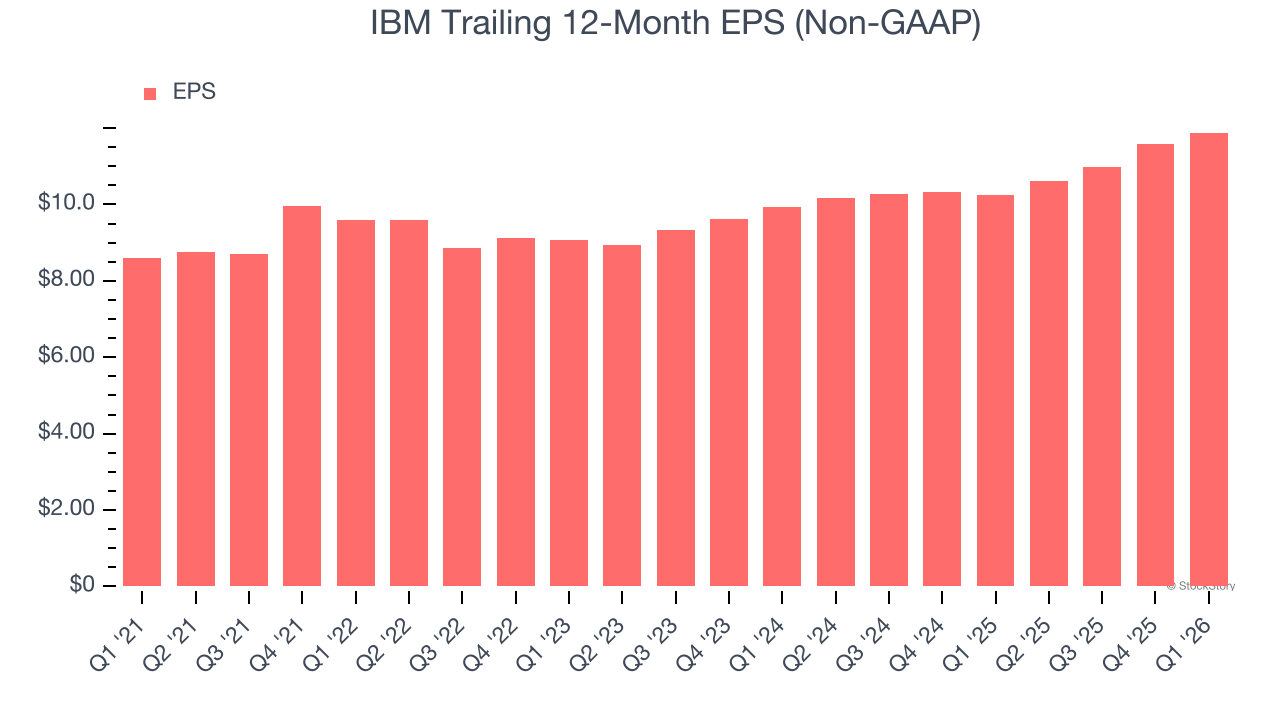
IBM’s EPS grew at 6.7% compounded annual growth rate over the last five years. On the bright side, this performance was better than its 4.5% annualized revenue growth and tells us the company became more profitable on a per-share basis as it expanded.
We can take a deeper look into IBM’s earnings to better understand the drivers of its performance. As we mentioned earlier, IBM’s adjusted operating margin expanded by 5.5 percentage points over the last five years. This was the most relevant factor (aside from the revenue impact) behind its higher earnings; interest expenses and taxes can also affect EPS but don’t tell us as much about a company’s fundamentals.
Like with revenue, we analyze EPS over a more recent period because it can provide insight into an emerging theme or development for the business.
For IBM, its two-year annual EPS growth of 9.4% was higher than its five-year trend. Accelerating earnings growth is almost always an encouraging data point.
In Q1, IBM reported adjusted EPS of $1.91, up from $1.60 in the same quarter last year. This print beat analysts’ estimates by 5.5%. Over the next 12 months, Wall Street expects IBM’s full-year EPS of $11.88 to grow 5.7%.
Key Takeaways from IBM’s Q1 Results
It was good to see IBM beat analysts’ EPS expectations this quarter. While its revenue narrowly outperformed Wall Street’s estimates, it seems that the outperformance, especially in the Software, was not enough to quell AI concerns. The market seemed to be hoping for more, and the stock traded down 6.6% to $235.19 immediately after reporting.
Big picture, is IBM a buy here and now? If you’re making that decision, you should consider the bigger picture of valuation, business qualities, as well as the latest earnings. We cover that in our actionable full research report which you can read here (it’s free).