Regional banking company Renasant (NYSE: RNST) met Wall Street’s revenue expectations in Q1 CY2026, with sales up 57.5% year on year to $273.8 million. Its non-GAAP profit of $0.93 per share was 10.7% above analysts’ consensus estimates.
Is now the time to buy Renasant? Find out by accessing our full research report, it’s free.
Renasant (RNST) Q1 CY2026 Highlights:
- Net Interest Income: $223.6 million vs analyst estimates of $227.3 million (66.6% year-on-year growth, 1.7% miss)
- Net Interest Margin: 3.6% vs analyst estimates of 3.9% (24.4 basis point miss)
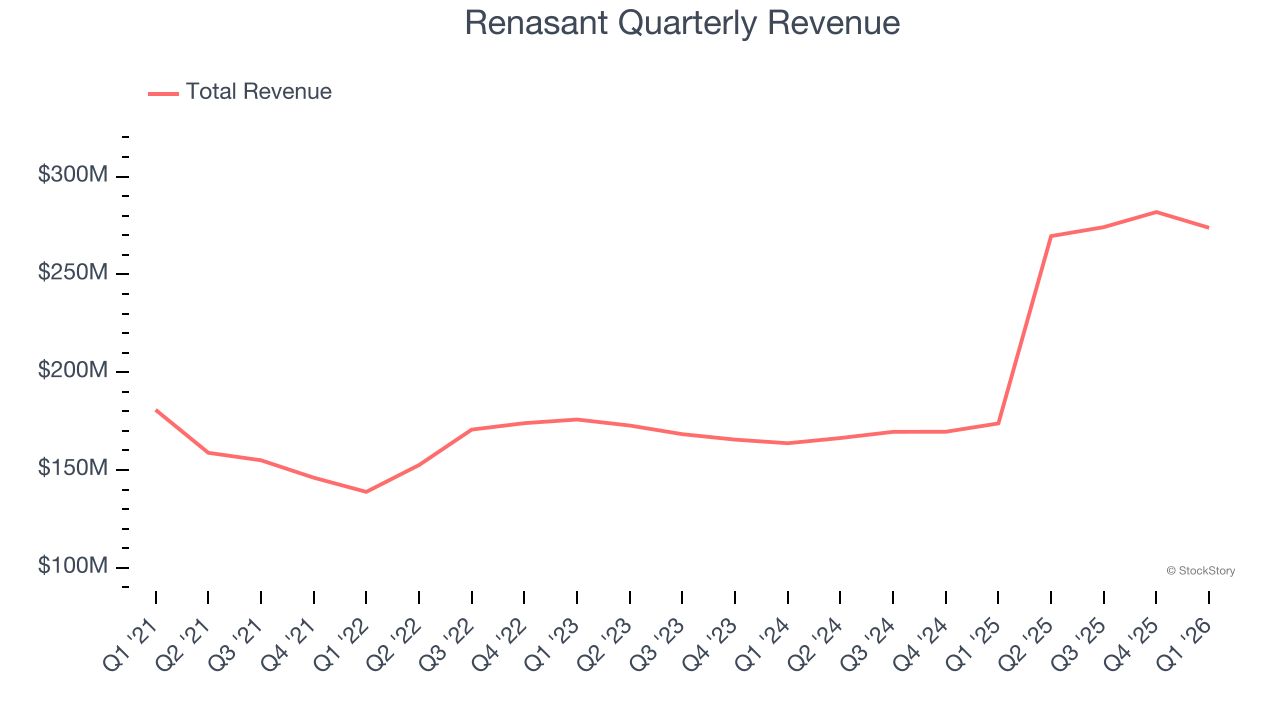
- Revenue: $273.8 million vs analyst estimates of $275.2 million (57.5% year-on-year growth, in line)
- Efficiency Ratio: 55.7% vs analyst estimates of 56.8% (106.4 basis point beat)
- Adjusted EPS: $0.93 vs analyst estimates of $0.84 (10.7% beat)
- Tangible Book Value per Share: $25 vs analyst estimates of $25.23 (7.6% year-on-year decline, 0.9% miss)
- Market Capitalization: $3.71 billion
Company Overview
Founded in 1904 during a time when the South was rebuilding its economy, Renasant (NYSE: RNST) is a regional bank holding company that offers banking, wealth management, insurance, and specialized lending services throughout the Southeast.
Sales Growth
Net interest income and and fee-based revenue are the two pillars supporting bank earnings. The former captures profit from the gap between lending rates and deposit costs, while the latter encompasses charges for banking services, credit products, wealth management, and trading activities. Regrettably, Renasant’s revenue grew at a mediocre 9.3% compounded annual growth rate over the last five years. This was below our standard for the banking sector and is a rough starting point for our analysis.
We at StockStory place the most emphasis on long-term growth, but within financials, a half-decade historical view may miss recent interest rate changes, market returns, and industry trends. Renasant’s annualized revenue growth of 28.1% over the last two years is above its five-year trend, suggesting its demand recently accelerated. 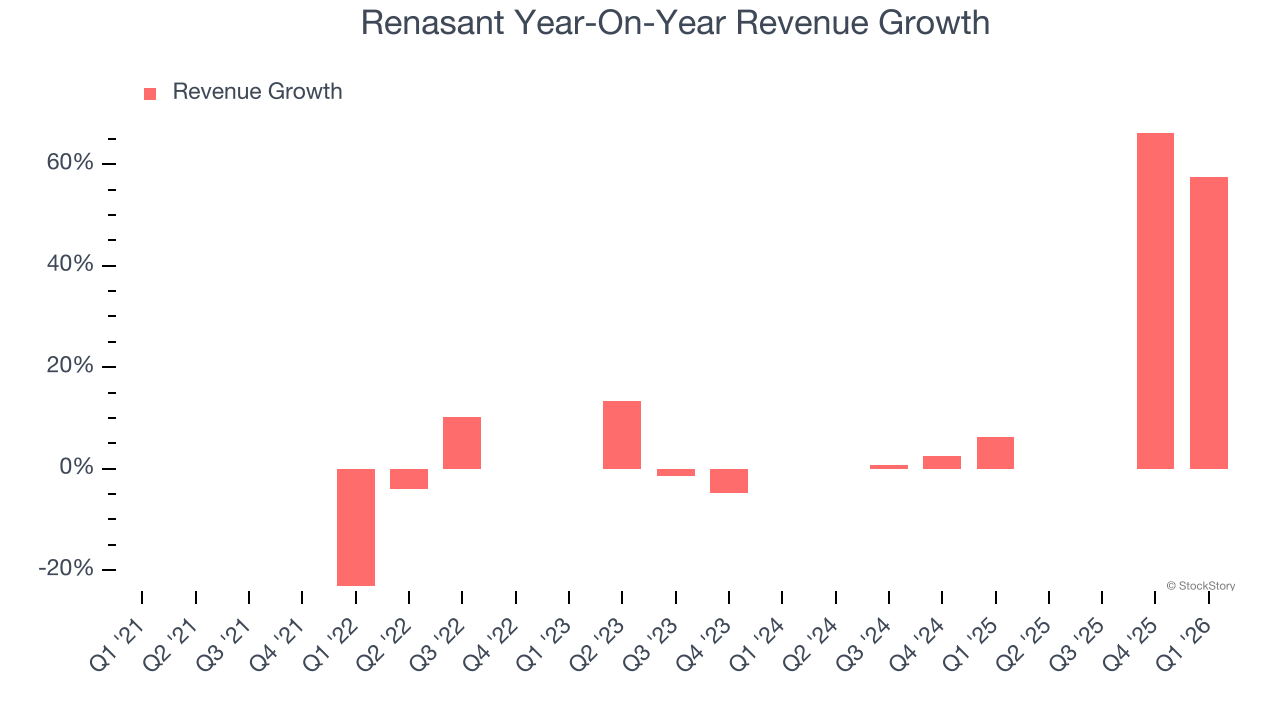 Note: Quarters not shown were determined to be outliers, impacted by outsized investment gains/losses that are not indicative of the recurring fundamentals of the business.
This quarter, Renasant’s year-on-year revenue growth of 57.5% was magnificent, and its $273.8 million of revenue was in line with Wall Street’s estimates.
Net interest income made up 76% of the company’s total revenue during the last five years, meaning lending operations are Renasant’s largest source of revenue.
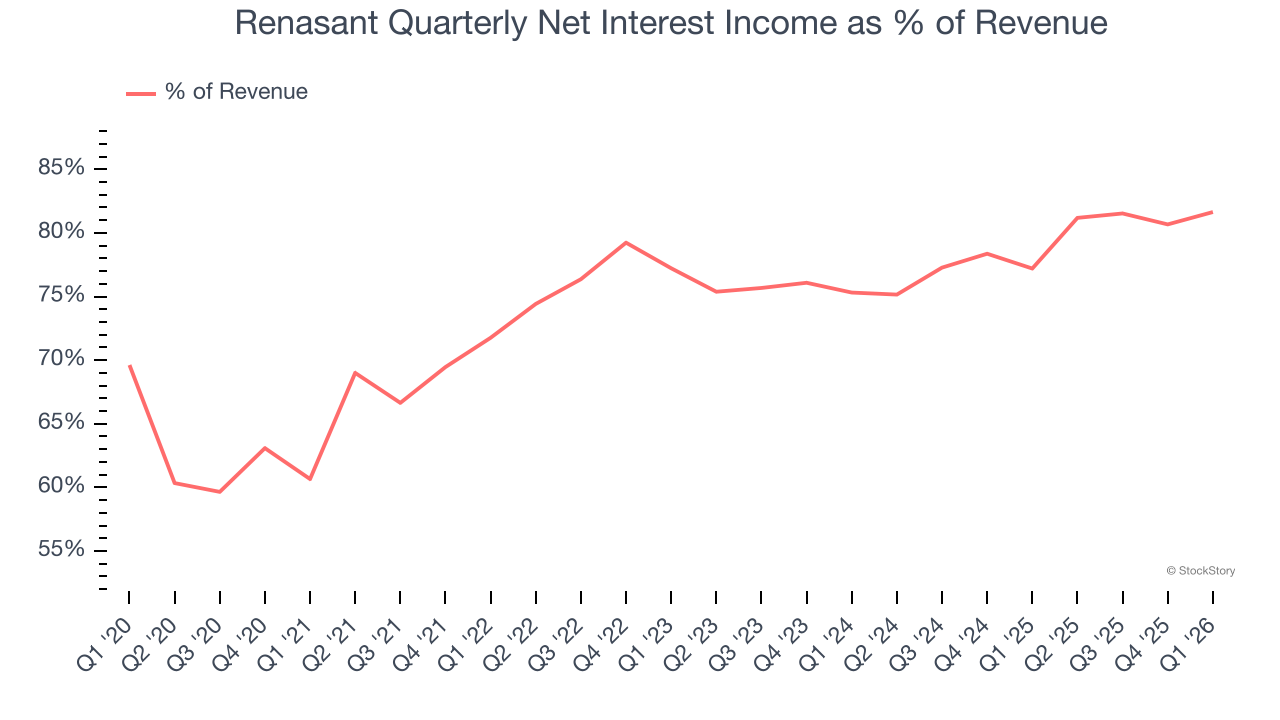
Our experience and research show the market cares primarily about a bank’s net interest income growth as non-interest income is considered a lower-quality and non-recurring revenue source.
ALSO WORTH WATCHING: Nvidia’s Quiet Partner. Nvidia’s chips cost a hundred grand. The connectors that make them work cost even more. One company makes them all.
Every AI server needs specialized infrastructure the chip companies don’t make. High-speed cables. Power connectors. Thermal sensors. This 90-year-old company built a monopoly on it. The AI boom just started. This stock is still flying under the radar. Claim The Stock Ticker Here for FREE.
Tangible Book Value Per Share (TBVPS)
Banks are balance sheet-driven businesses because they generate earnings primarily through borrowing and lending. They’re also valued based on their balance sheet strength and ability to compound book value (another name for shareholders’ equity) over time.
Because of this, tangible book value per share (TBVPS) emerges as the critical performance benchmark. By excluding intangible assets with uncertain liquidation values, this metric captures real, liquid net worth per share. Other (and more commonly known) per-share metrics like EPS can sometimes be murky due to M&A or accounting rules allowing for loan losses to be spread out.
Renasant’s TBVPS grew at a tepid 3.1% annual clip over the last five years. The last two years show a similar trajectory as TBVPS grew by 3.5% annually from $23.32 to $25 per share.
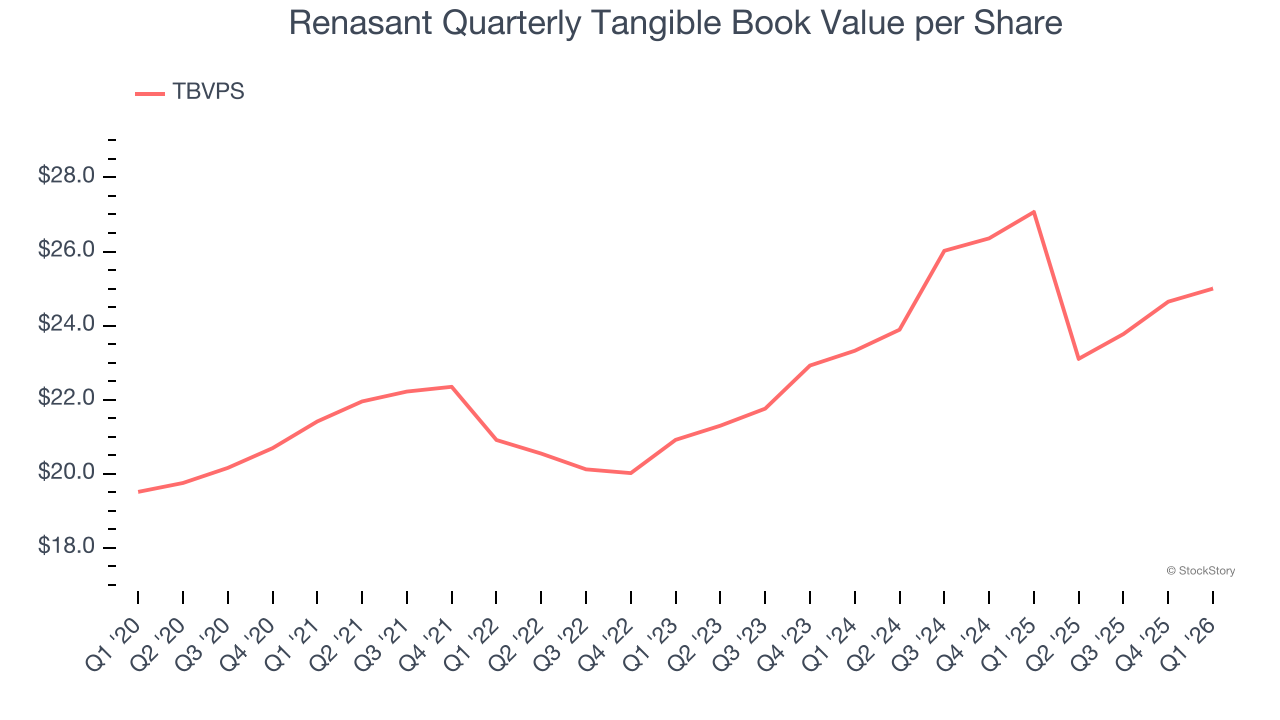
Over the next 12 months, Consensus estimates call for Renasant’s TBVPS to grow by 12% to $28.01, mediocre growth rate.
Key Takeaways from Renasant’s Q1 Results
It was good to see Renasant beat analysts’ efficiency ratio and EPS expectations this quarter. On the other hand, its net interest income missed and its revenue was just in line with Wall Street’s estimates. Overall, this quarter was mixed. The stock remained flat at $39.94 immediately after reporting.
So should you invest in Renasant right now? If you’re making that decision, you should consider the bigger picture of valuation, business qualities, as well as the latest earnings. We cover that in our actionable full research report which you can read here (it’s free).