Luxury cruise operator Viking (NYSE: VIK) reported revenue ahead of Wall Street’s expectations in Q1 CY2026, with sales up 17.5% year on year to $1.05 billion. Its non-GAAP loss of $0.11 per share was in line with analysts’ consensus estimates.
Is now the time to buy Viking? Find out by accessing our full research report, it’s free.
Viking (VIK) Q1 CY2026 Highlights:
- Revenue: $1.05 billion vs analyst estimates of $1.01 billion (17.5% year-on-year growth, 3.9% beat)
- Adjusted EPS: -$0.11 vs analyst estimates of -$0.11 (in line)
- Adjusted EBITDA: $104.8 million vs analyst estimates of $100.8 million (9.9% margin, 4% beat)
- Operating Margin: 1.1%, up from -1% in the same quarter last year
- Free Cash Flow Margin: 20%, down from 49.2% in the same quarter last year
- Market Capitalization: $36.65 billion
“This leadership transition reflects the strength and depth of Viking’s management team and the succession planning we have built over many years,” said Mr. Hagen.
Company Overview
From a single river cruise offering to a fleet of 96 vessels across multiple continents, Viking (NYSE: VIK) operates a fleet of small luxury cruise ships offering river, ocean, and expedition voyages focused on cultural enrichment and destination immersion.
Revenue Growth
A company’s top-line performance can indicate its business quality. Rapid growth can signal it’s benefiting from an innovative new product or burgeoning market trend. Viking’s annualized revenue growth rate of 17.8% over the last two years was weak for a consumer discretionary business.
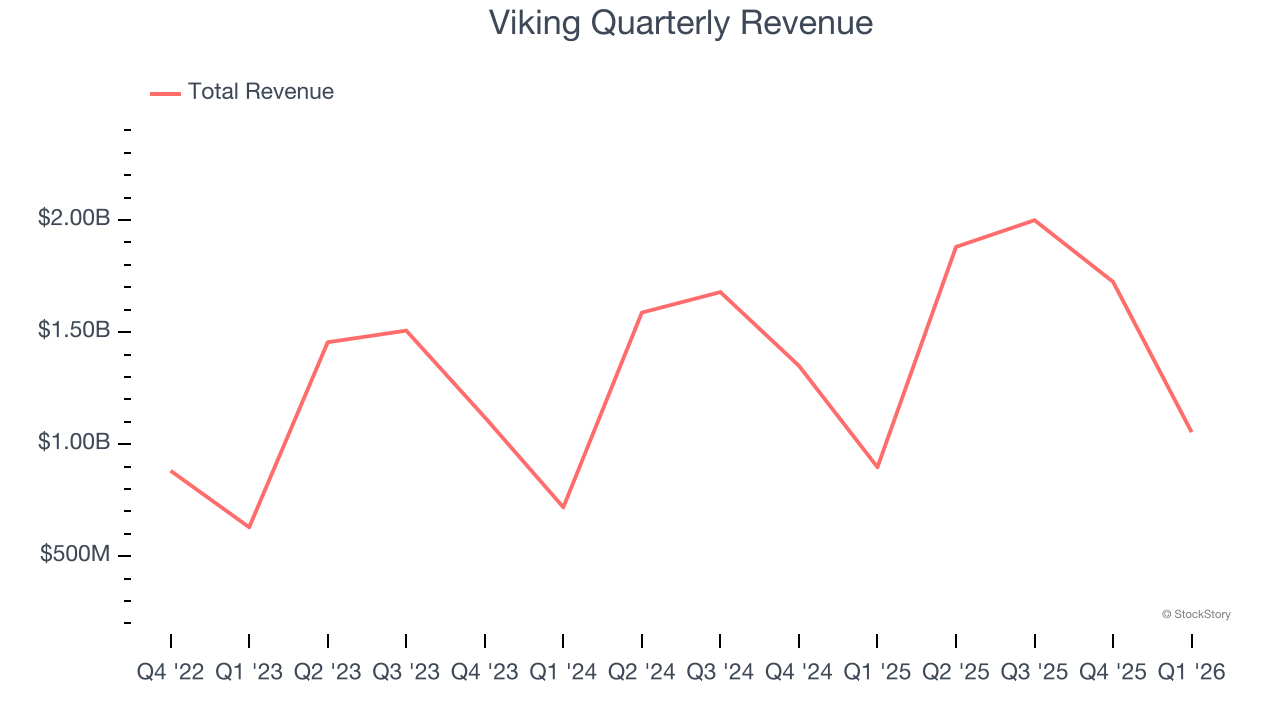
This quarter, Viking reported year-on-year revenue growth of 17.5%, and its $1.05 billion of revenue exceeded Wall Street’s estimates by 3.9%.
Looking ahead, sell-side analysts expect revenue to grow 13% over the next 12 months, a deceleration versus the last two years. Despite the slowdown, this projection is above average for the sector and suggests the market sees some success for its newer products and services.
ONE MORE THING: The $21 AI Application Stock Wall Street Forgot. While Wall Street obsesses over who’s building AI, one company is already using it to print money. And nobody’s paying attention.
AI chip stocks trade at ridiculous valuations. This company processes a trillion consumer signals monthly using AI and trades at a third of the price. The gap won’t last. The institutions will figure it out. You need to see this first. Read the FREE Report Before They Notice.
Operating Margin
Viking’s operating margin has been trending up over the last 12 months and averaged 21.9% over the last two years. The company’s higher efficiency is a breath of fresh air, but its suboptimal cost structure means it still sports lousy profitability for a consumer discretionary business.
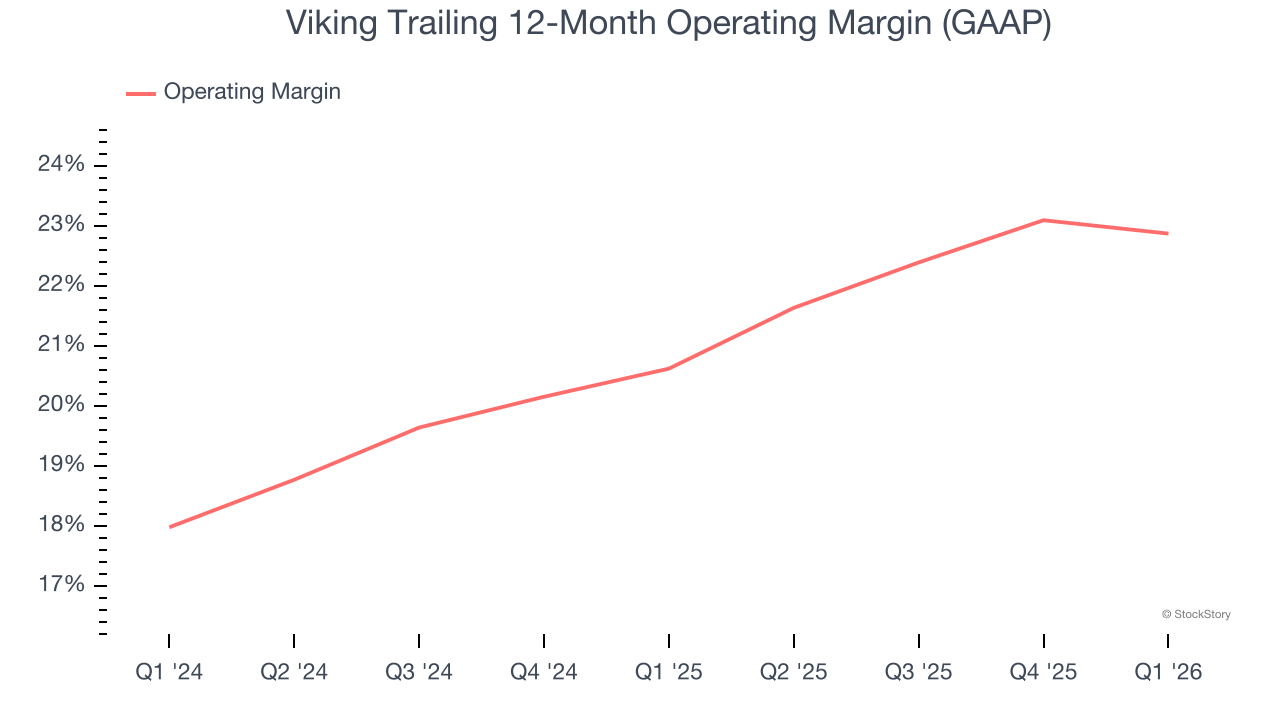
In Q1, Viking generated an operating margin profit margin of 1.1%, up 2.2 percentage points year on year. This increase was a welcome development and shows it was more efficient.
Cash Is King
Although earnings are undoubtedly valuable for assessing company performance, we believe cash is king because you can’t use accounting profits to pay the bills.
Viking has shown poor cash profitability relative to peers over the last two years, giving the company fewer opportunities to return capital to shareholders. Its free cash flow margin averaged 20.9%, below what we’d expect for a consumer discretionary business.
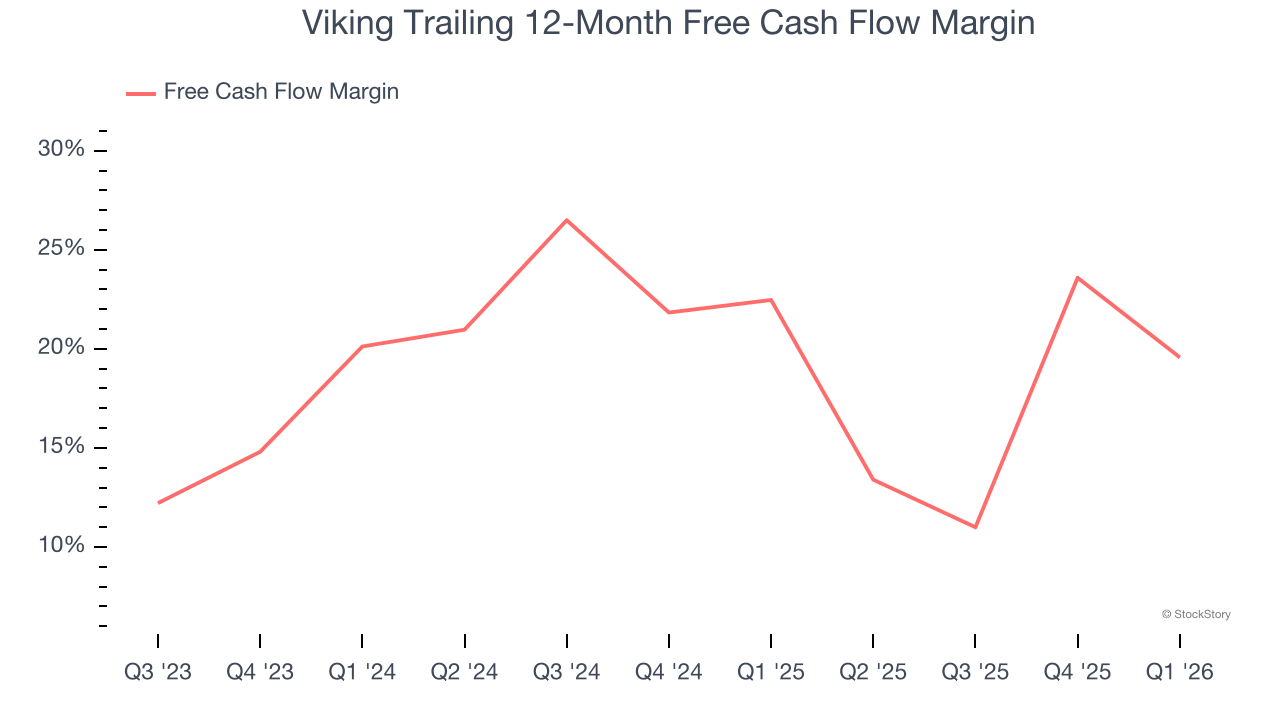
Viking’s free cash flow clocked in at $211.2 million in Q1, equivalent to a 20% margin. The company’s cash profitability regressed as it was 29.2 percentage points lower than in the same quarter last year, prompting us to pay closer attention. Short-term fluctuations typically aren’t a big deal because investment needs can be seasonal, but we’ll be watching to see if the trend extrapolates into future quarters.
Over the next year, analysts predict Viking’s cash conversion will improve. Their consensus estimates imply its free cash flow margin of 19.6% for the last 12 months will increase to 27.8%, giving it more flexibility for investments, share buybacks, and dividends.
Key Takeaways from Viking’s Q1 Results
We liked that Viking beat revenue and adjusted operating income expectations this quarter. On the other hand, its EPS was in line. Overall, we think this was a solid quarter with some key areas of upside. The stock traded up 1.2% to $83.16 immediately following the results.
Viking put up rock-solid earnings, but one quarter doesn’t necessarily make the stock a buy. Let’s see if this is a good investment. If you’re making that decision, you should consider the bigger picture of valuation, business qualities, as well as the latest earnings. We cover that in our actionable full research report which you can read here (it’s free).