
Freight rail services provider CSX (NASDAQ: CSX) reported revenue ahead of Wall Street’s expectations in Q2 CY2026, with sales up 10.1% year on year to $3.94 billion. Its GAAP profit of $0.54 per share was 4.2% above analysts’ consensus estimates.
Is now the time to buy CSX? Find out by accessing our full research report, it’s free.
CSX (CSX) Q2 CY2026 Highlights:
- Revenue: $3.94 billion vs analyst estimates of $3.90 billion (10.1% year-on-year growth, 1% beat)
- EPS (GAAP): $0.54 vs analyst estimates of $0.52 (4.2% beat)
- Operating Margin: 38.3%, up from 35.9% in the same quarter last year
- Free Cash Flow was $687 million, up from -$115 million in the same quarter last year
- Sales Volumes rose 6.1% year on year (0.1% in the same quarter last year)
- Market Capitalization: $92.7 billion
Company Overview
Established as part of the Chessie System and Seaboard Coast Line Industries merger, CSX (NASDAQ: CSX) is a transportation company specializing in freight rail services.
Revenue Growth
A company’s long-term performance is an indicator of its overall quality. Even a bad business can shine for one or two quarters, but a top-tier one grows for years. Regrettably, CSX’s sales grew at a tepid 5.2% compounded annual growth rate over the last five years. This was below our standard for the industrials sector and is a rough starting point for our analysis.
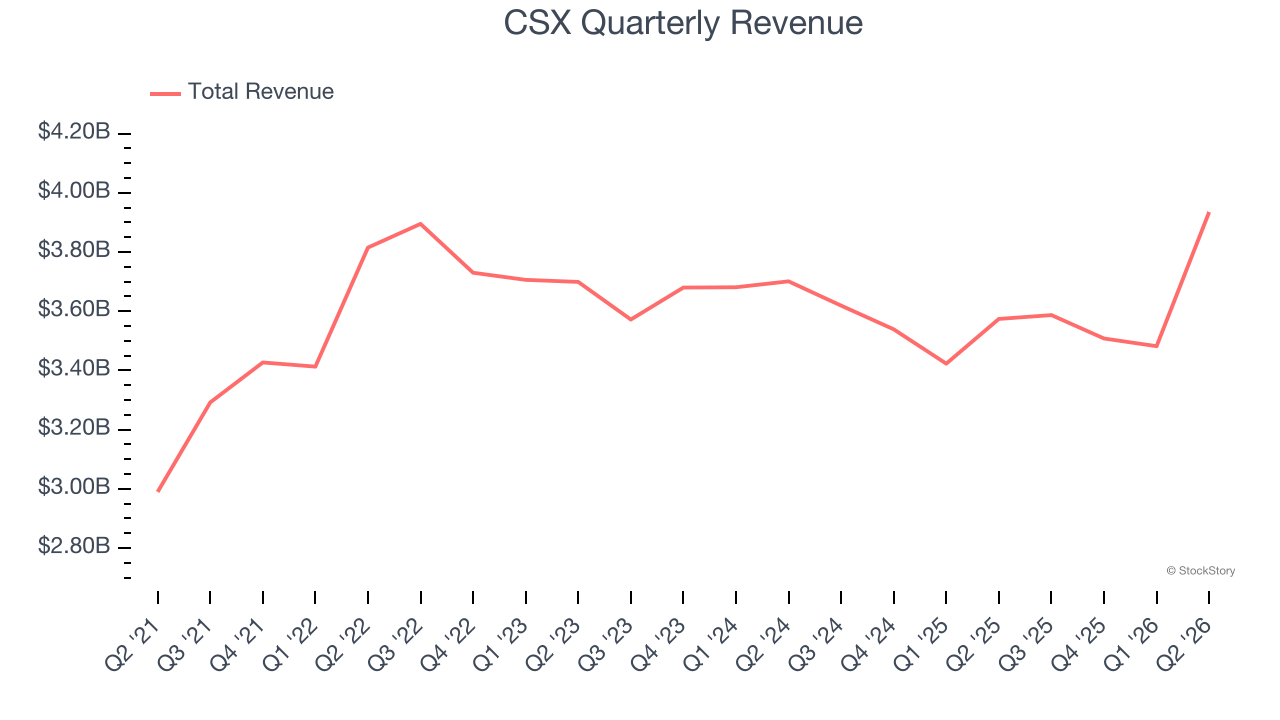
Long-term growth is the most important, but within industrials, a half-decade historical view may miss new industry trends or demand cycles. CSX’s recent performance shows its demand has slowed as its revenue was flat over the last two years. 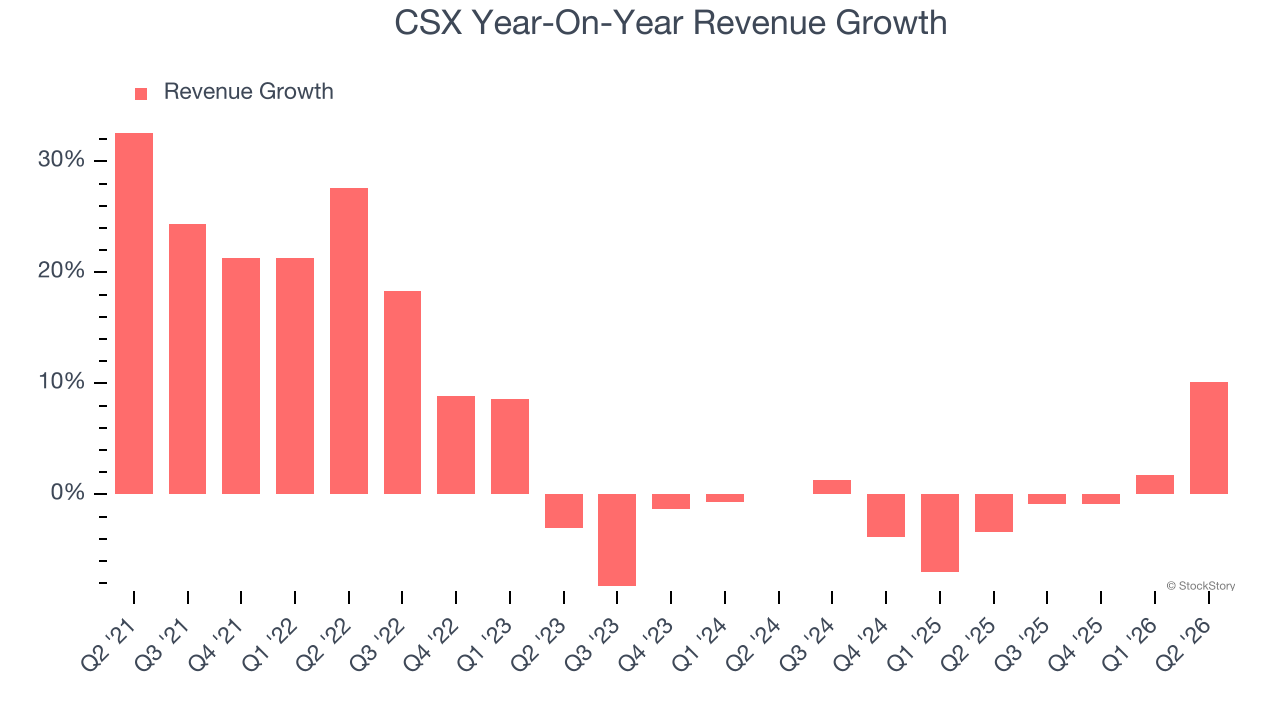
We can better understand the company’s revenue dynamics by analyzing its number of units sold, which reached 1.68 million in the latest quarter. Over the last two years, CSX’s units sold averaged 1.8% year-on-year growth. Because this number is better than its revenue growth, we can see the company’s average selling price decreased. 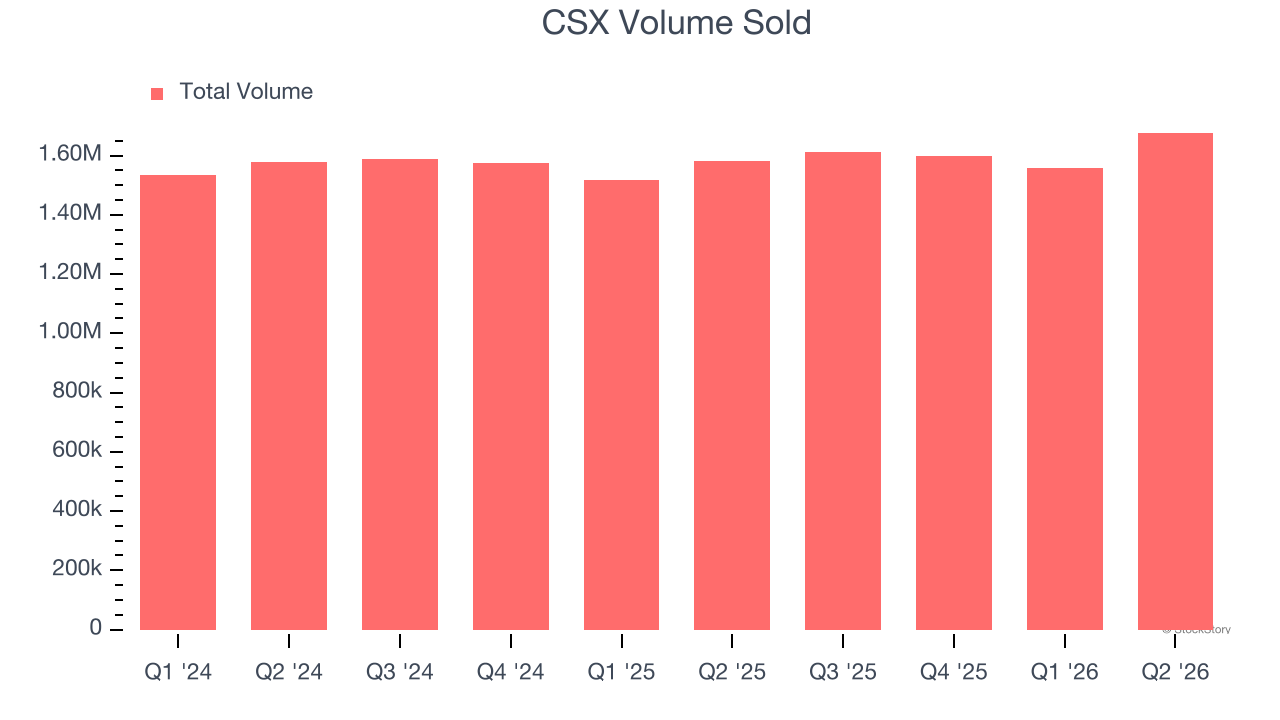
This quarter, CSX reported year-on-year revenue growth of 10.1%, and its $3.94 billion of revenue exceeded Wall Street’s estimates by 1%.
Looking ahead, sell-side analysts expect revenue to grow 6.1% over the next 12 months. While this projection implies its newer products and services will fuel better top-line performance, it is still below average for the sector.
WHILE YOU’RE HERE: The Next Palantir? One satellite company captures images of every point on Earth. Every single day. The Pentagon wants it. Hedge funds are using it to beat earnings. You’ve probably never heard of it.
This is what the early days of Palantir looked like before it became a giant. Same playbook. Different technology. If you missed Palantir, you need to see this. Claim The Stock Ticker for Free HERE.
Operating Margin
CSX has been a well-oiled machine over the last five years. It demonstrated elite profitability for an industrials business, boasting an average operating margin of 37.1%. This result isn’t surprising as its high gross margin gives it a favorable starting point.
Looking at the trend in its profitability, CSX’s operating margin decreased by 7.3 percentage points over the last five years. This raises questions about the company’s expense base because its revenue growth should have given it leverage on its fixed costs, resulting in better economies of scale and profitability.
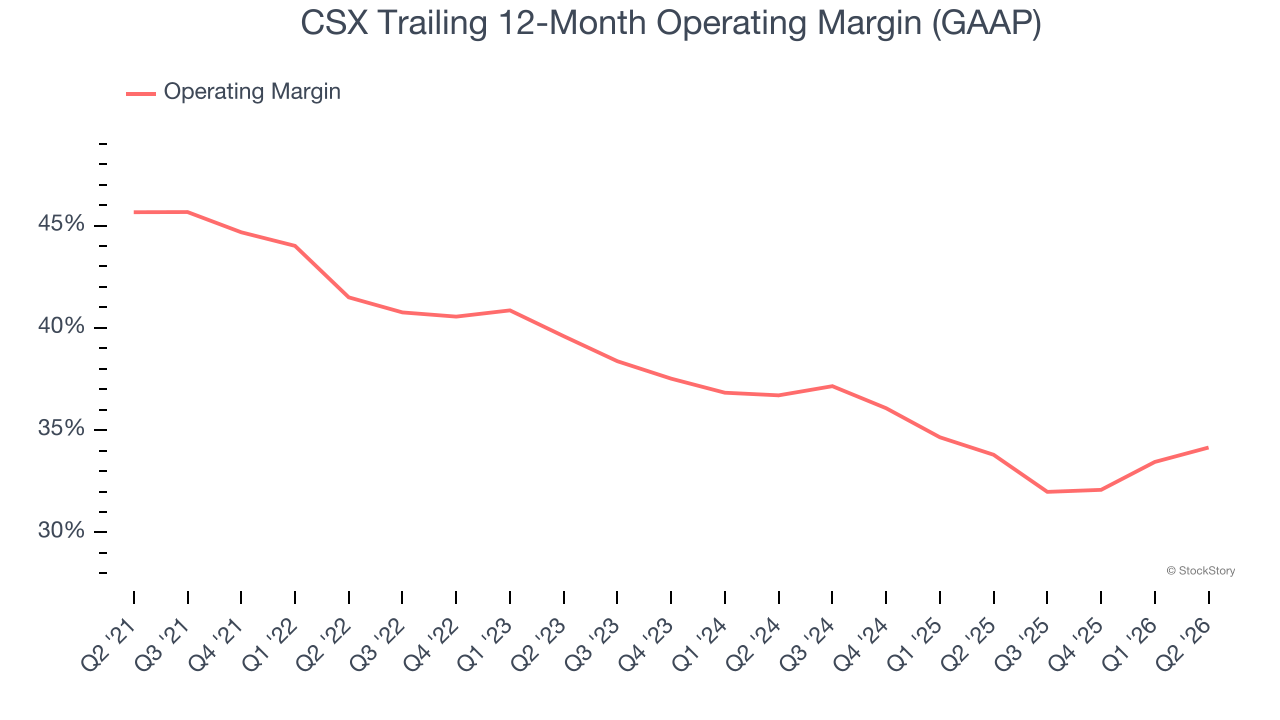
This quarter, CSX generated an operating margin profit margin of 38.3%, up 2.4 percentage points year on year. The increase was encouraging, and because its operating margin rose more than its gross margin, we can infer it was more efficient with expenses such as marketing, R&D, and administrative overhead.
Earnings Per Share
We track the long-term change in earnings per share (EPS) for the same reason as long-term revenue growth. Compared to revenue, however, EPS highlights whether a company’s growth is profitable.
CSX’s weak 3.3% annual EPS growth over the last five years aligns with its revenue performance. This tells us it maintained its per-share profitability as it expanded.
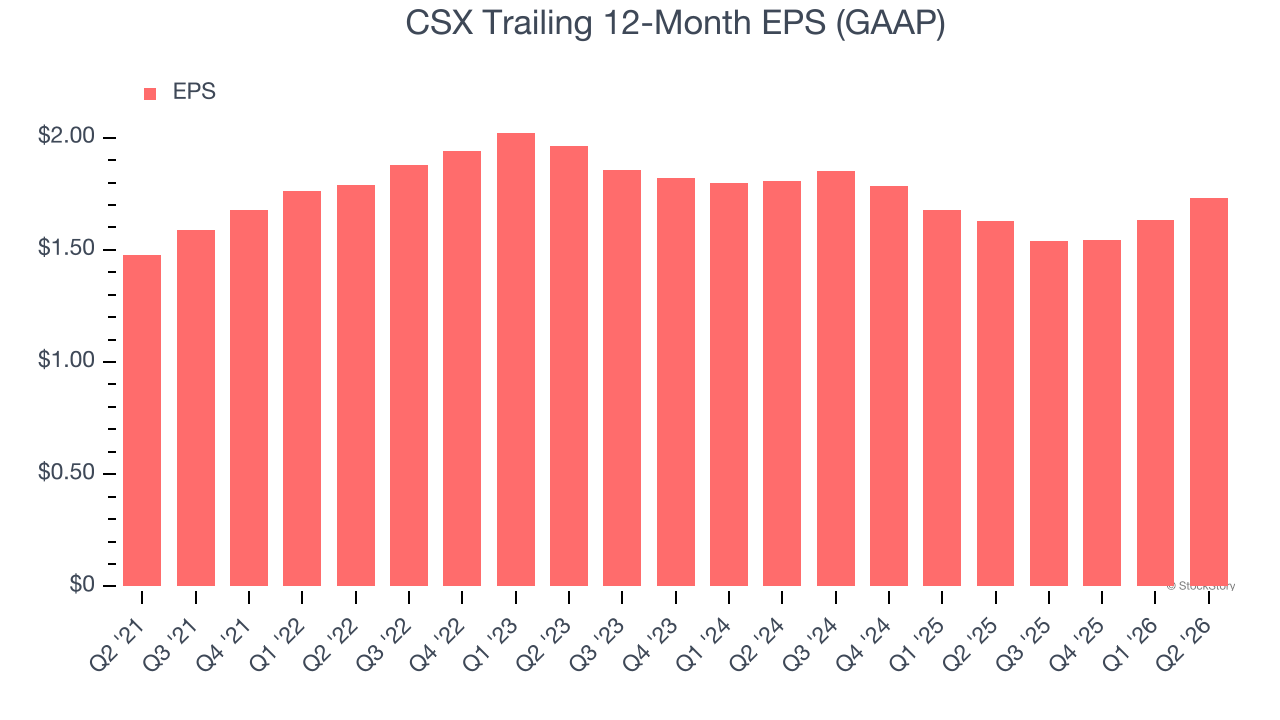
Like with revenue, we analyze EPS over a shorter period to see if we are missing a change in the business.
For CSX, its two-year annual EPS declines of 2.1% show it’s continued to underperform. These results were bad no matter how you slice the data.
In Q2, CSX reported EPS of $0.54, up from $0.44 in the same quarter last year. This print beat analysts’ estimates by 4.2%. Over the next 12 months, Wall Street expects CSX’s full-year EPS to grow 21% from $1.73 to $2.09.
Key Takeaways from CSX’s Q2 Results
It was good to see CSX narrowly top analysts’ revenue expectations this quarter. We were also glad its EPS outperformed Wall Street’s estimates. Overall, this print had some key positives. The stock traded up 3.7% to $51.74 immediately after reporting.
CSX had an encouraging quarter, but one earnings result doesn’t necessarily make the stock a buy. Let’s see if this is a good investment. We think that the latest quarter is only one piece of the longer-term business quality puzzle. Quality, when combined with valuation, can help determine if the stock is a buy. We cover that in our actionable full research report which you can read here (it’s free).