Solar tracker company Nextpower (NASDAQ: NXT) fell short of the market’s revenue expectations in Q2 CY2026, but sales rose 8.2% year on year to $935.2 million. The company’s full-year revenue guidance of $4.25 billion at the midpoint came in 2.3% below analysts’ estimates. Its non-GAAP profit of $1.20 per share was 14.9% above analysts’ consensus estimates.
Is now the time to buy Nextpower? Find out by accessing our full research report, it’s free.
Nextpower (NXT) Q2 CY2026 Highlights:
- Revenue: $935.2 million vs analyst estimates of $943.7 million (8.2% year-on-year growth, 0.9% miss)
- Adjusted EPS: $1.20 vs analyst estimates of $1.04 (14.9% beat)
- Adjusted EBITDA: $233 million vs analyst estimates of $206 million (24.9% margin, 13.1% beat)
- The company lifted its revenue guidance for the full year to $4.25 billion at the midpoint from $3.95 billion, a 7.6% increase
- Management raised its full-year Adjusted EPS guidance to $4.58 at the midpoint, a 4% increase
- EBITDA guidance for the full year is $900 million at the midpoint, below analyst estimates of $923.2 million
- Operating Margin: 20.4%, down from 21.5% in the same quarter last year
- Free Cash Flow Margin: 11.2%, up from 8.1% in the same quarter last year
- Backlog: $5.5 billion at quarter end, up 15.8% year on year
- Market Capitalization: $14.05 billion
Company Overview
With its technology playing a key role in the massive 1.2 gigawatt Noor Abu Dhabi solar farm project, Nextpower (NASDAQ: NXT) is a provider of solar tracker systems that help solar panels follow the sun.
Revenue Growth
Examining a company’s long-term performance can provide clues about its quality. Any business can put up a good quarter or two, but the best consistently grow over the long haul. Luckily, Nextpower’s sales grew at an incredible 23.9% compounded annual growth rate over the last five years. Its growth surpassed the average industrials company and shows its offerings resonate with customers, a great starting point for our analysis.
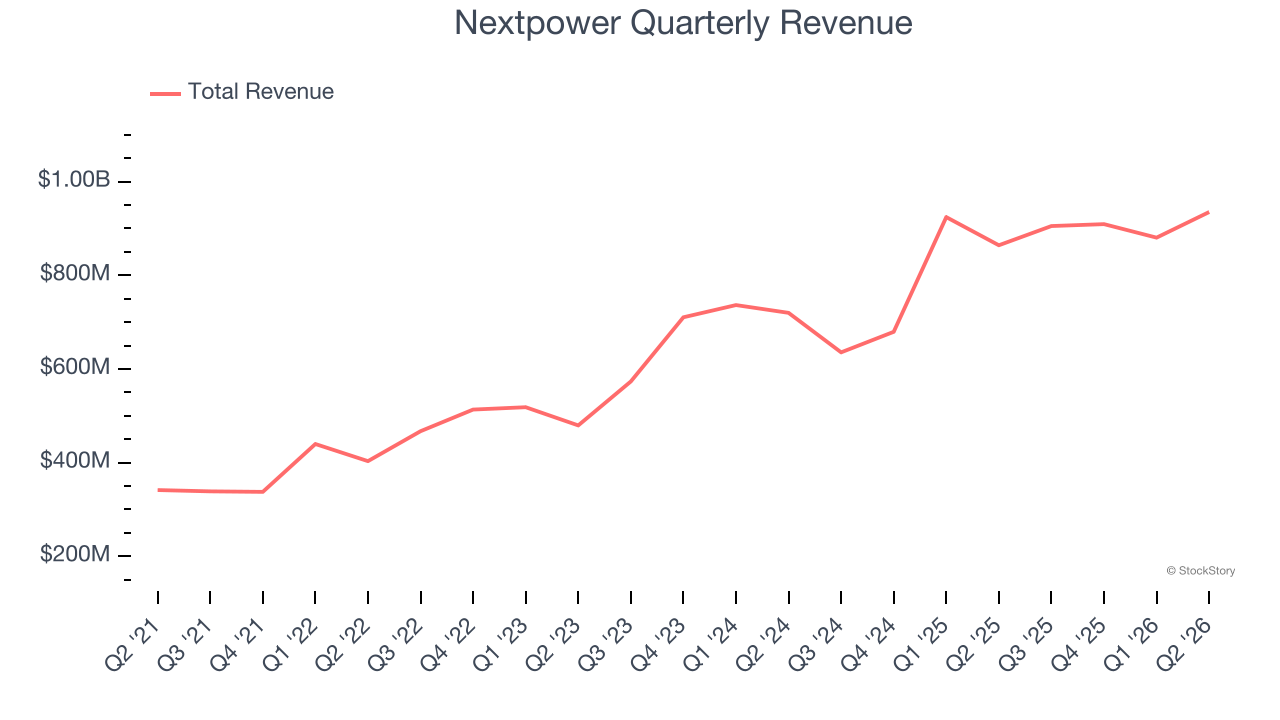
Long-term growth is the most important, but within industrials, a half-decade historical view may miss new industry trends or demand cycles. Nextpower’s annualized revenue growth of 15.1% over the last two years is below its five-year trend, but we still think the results suggest healthy demand. 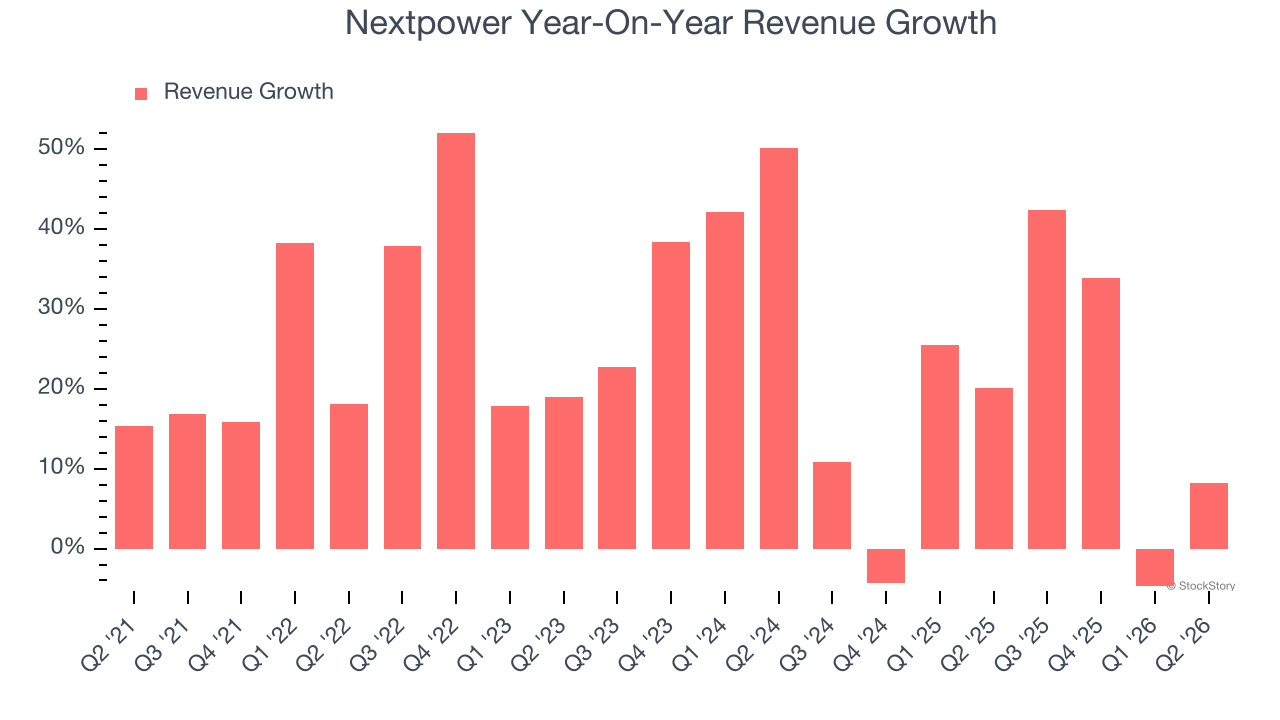
This quarter, Nextpower’s revenue grew by 8.2% year on year to $935.2 million, missing Wall Street’s estimates.
Looking ahead, sell-side analysts expect revenue to grow 24.2% over the next 12 months, an improvement versus the last two years. This projection is eye-popping and implies its newer products and services will catalyze better top-line performance.
ONE MORE THING: 3 Hidden Platforms Growing 3X Faster than Amazon, Google, and PayPal. Amazon, Google, and Meta all followed the same playbook: Dominate an ignored market. Build an unbeatable moat. Scale until you’re unstoppable.
These three platforms are running that exact playbook right now. The early investors in Amazon made fortunes. The early investors in these could do the same. Get All 3 Stocks Here for FREE.
Operating Margin
Nextpower has been a well-oiled machine over the last five years. It demonstrated elite profitability for an industrials business, boasting an average operating margin of 17.9%. This result was particularly impressive because of its low gross margin, which is mostly a factor of what it sells and takes huge shifts to move meaningfully. Companies have more control over their operating margins, and it’s a show of well-managed operations if they’re high when gross margins are low.
Analyzing the trend in its profitability, Nextpower’s operating margin rose by 14.4 percentage points over the last five years, as its sales growth gave it immense operating leverage.
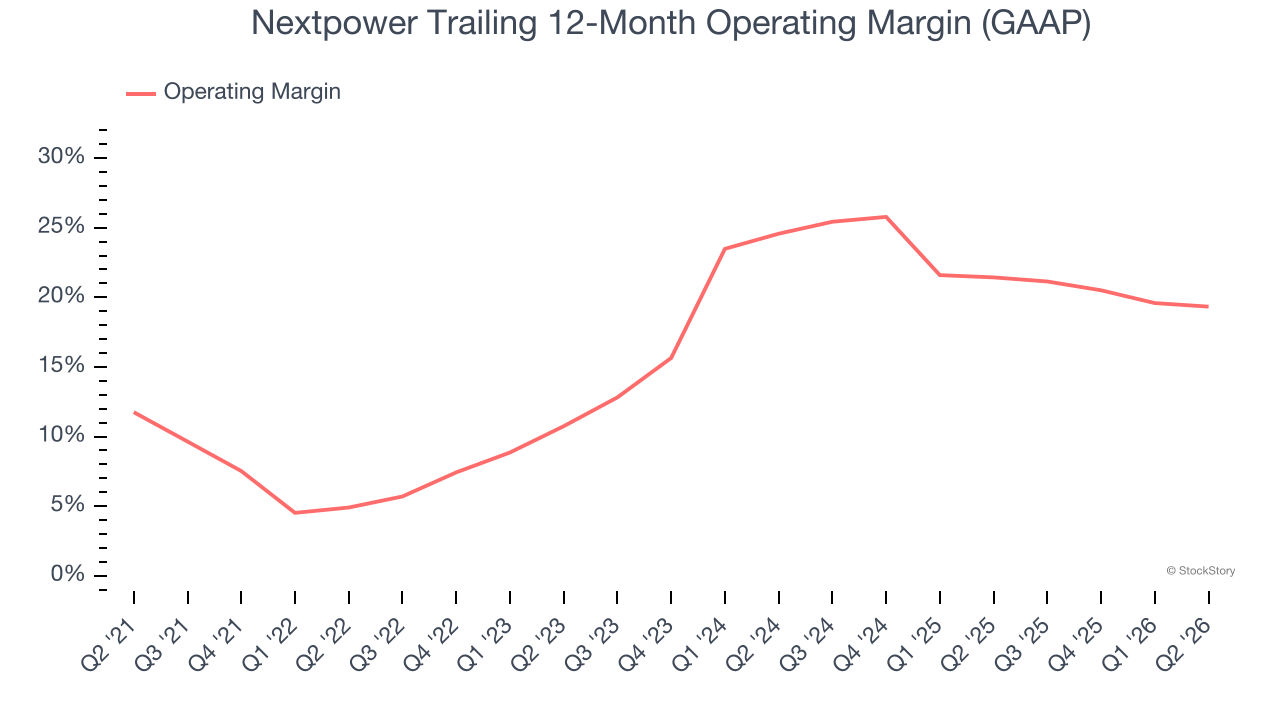
In Q2, Nextpower generated an operating margin profit margin of 20.4%, down 1.1 percentage points year on year. Conversely, its revenue and gross margin actually rose, so we can assume it was less efficient because its operating expenses like marketing, R&D, and administrative overhead grew faster than its revenue.
Cash Is King
Although earnings are undoubtedly valuable for assessing company performance, we believe cash is king because you can’t use accounting profits to pay the bills.
Nextpower has shown robust cash profitability, enabling it to comfortably ride out cyclical downturns while investing in plenty of new offerings and returning capital to investors. The company’s free cash flow margin averaged 12.6% over the last five years, quite impressive for an industrials business.
Taking a step back, we can see that Nextpower’s margin expanded by 23.4 percentage points during that time. This is encouraging, and we can see it became a less capital-intensive business because its free cash flow profitability rose more than its operating profitability.
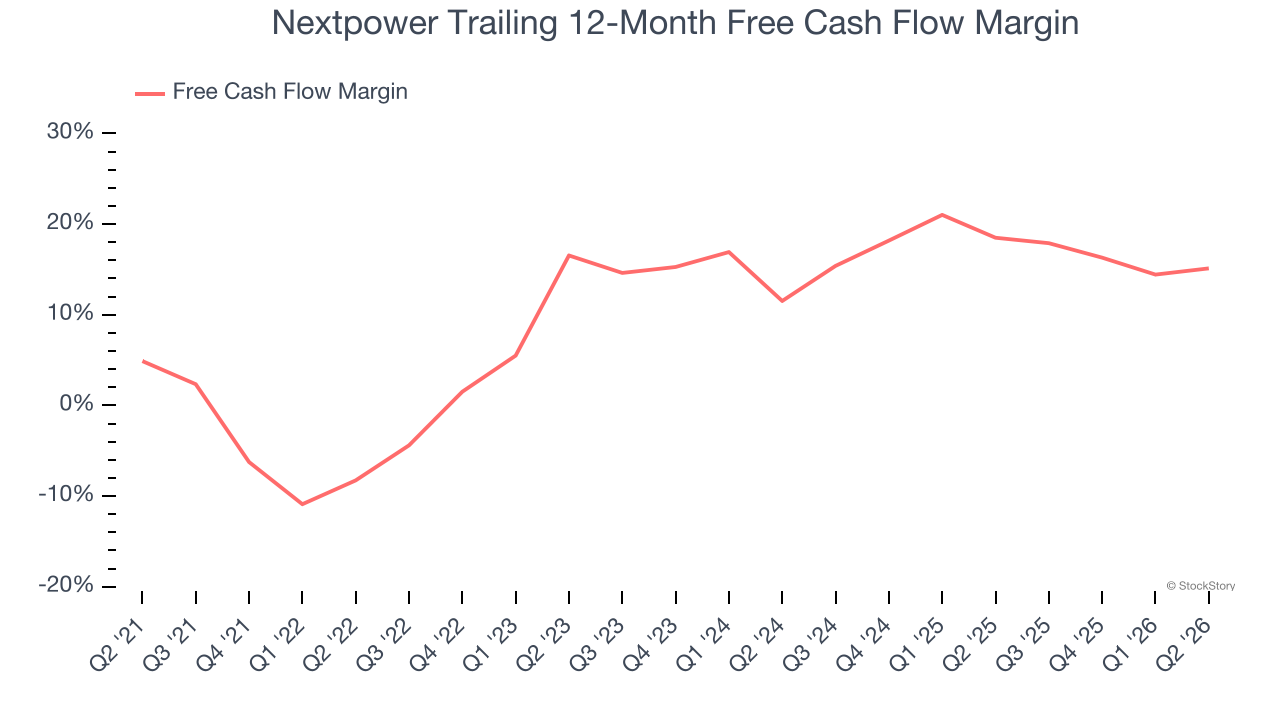
Nextpower’s free cash flow clocked in at $105.2 million in Q2, equivalent to a 11.2% margin. This result was good as its margin was 3.1 percentage points higher than in the same quarter last year, building on its favorable historical trend.
Key Takeaways from Nextpower’s Q2 Results
We were impressed by how significantly Nextpower blew past analysts’ EBITDA expectations this quarter. We were also glad its EPS outperformed Wall Street’s estimates. On the other hand, its full-year EBITDA guidance missed and its full-year revenue guidance fell short of Wall Street’s estimates. Overall, this was a weaker quarter. The stock traded up 2.2% to $97.87 immediately after reporting.
Should you buy the stock or not? What happened in the latest quarter matters, but not as much as longer-term business quality and valuation, when deciding whether to invest in this stock. We cover that in our actionable full research report which you can read here (it’s free).