Children’s apparel manufacturer Carter’s (NYSE: CRI) beat Wall Street’s revenue expectations in Q2 CY2026, with sales up 5.2% year on year to $615.5 million. On the other hand, next quarter’s revenue guidance of $750 million was less impressive, coming in 6.1% below analysts’ estimates. Its non-GAAP profit of $0.26 per share was significantly above analysts’ consensus estimates.
Is now the time to buy Carter's? Find out by accessing our full research report, it’s free.
Carter's (CRI) Q2 CY2026 Highlights:
- Revenue: $615.5 million vs analyst estimates of $605.7 million (5.2% year-on-year growth, 1.6% beat)
- Adjusted EPS: $0.26 vs analyst estimates of $0.06 (significant beat)
- Adjusted EBITDA: $30.8 million vs analyst estimates of $26.43 million (5% margin, 16.5% beat)
- Revenue Guidance for Q3 CY2026 is $750 million at the midpoint, below analyst estimates of $798.5 million
- Adjusted EPS guidance for Q3 CY2026 is $0.85 at the midpoint, below analyst estimates of $0.89
- Operating Margin: 22.7%, up from 0.7% in the same quarter last year
- Free Cash Flow Margin: 30.8%, up from 4.1% in the same quarter last year
- Same-Store Sales rose 5.1% year on year (2.2% in the same quarter last year)
- Market Capitalization: $1.39 billion
“Demonstrating continued momentum, the Company posted positive results for the second quarter as net sales increased 5% and adjusted operating profit increased 54%, exceeding the prior outlook. While there were a number of moving parts in the quarter, we believe these results are largely reflective of improved marketing efforts, the early benefit of productivity initiatives, and continued progress in the critical Baby segment,” said Sharon Price John, Chief Executive Officer & President.
Company Overview
Rumored to sell more than 10 products for every child born in the United States, Carter's (NYSE: CRI) is an American designer and marketer of children's apparel.
Revenue Growth
Reviewing a company’s long-term sales performance reveals insights into its quality. Any business can have short-term success, but a top-tier one grows for years. Carter’s demand was weak over the last five years as its sales fell at a 2.5% annual rate. This wasn’t a great result and suggests it’s a low quality business.
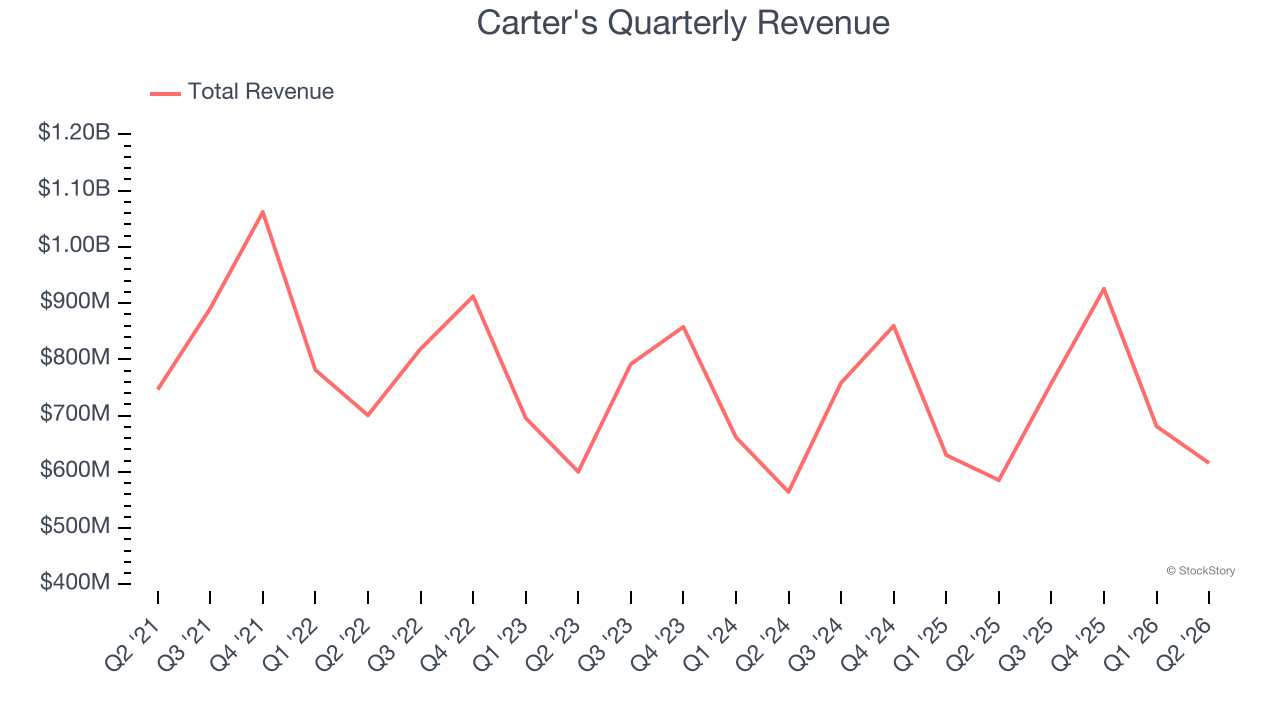
We at StockStory place the most emphasis on long-term growth, but within consumer discretionary, a stretched historical view may miss a company riding a successful new product or trend. Carter’s annualized revenue growth of 1.8% over the last two years is above its five-year trend, which is encouraging. 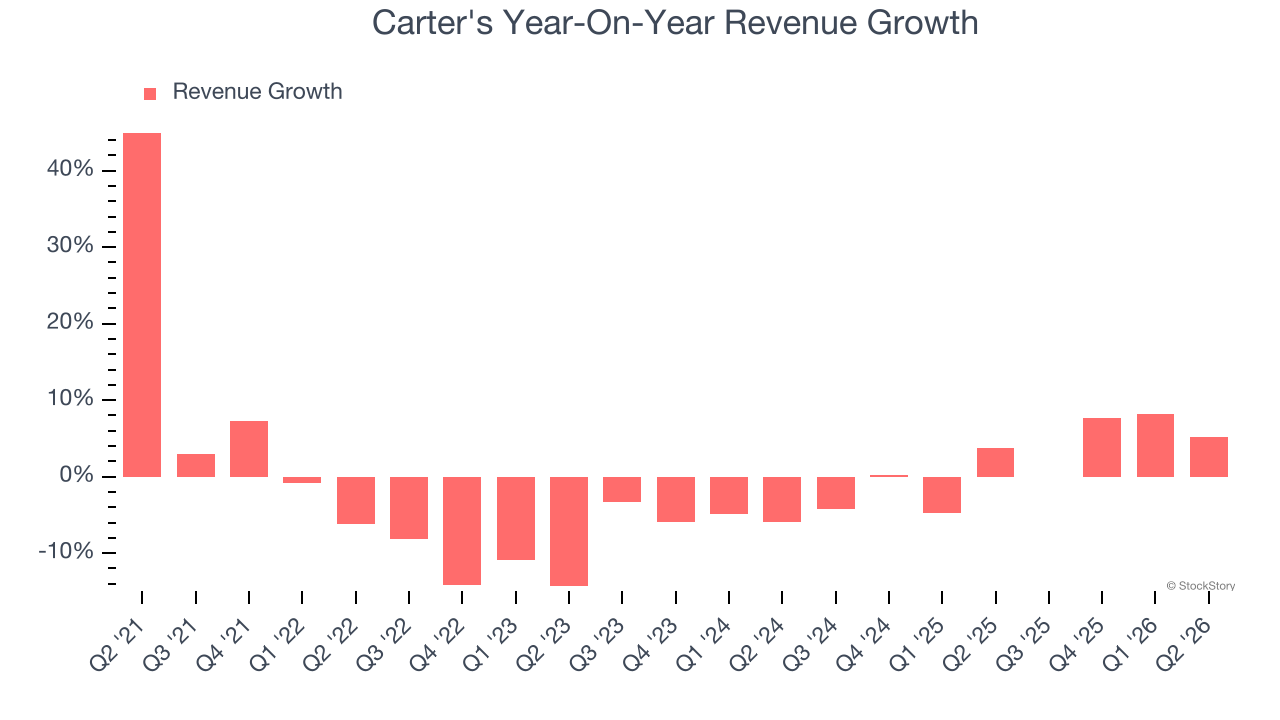
We can dig further into the company’s revenue dynamics by analyzing its same-store sales, which show how much revenue its established locations generate. Over the last two years, Carter’s same-store sales averaged 1.1% year-on-year growth. This number doesn’t surprise us as it’s in line with its revenue growth. 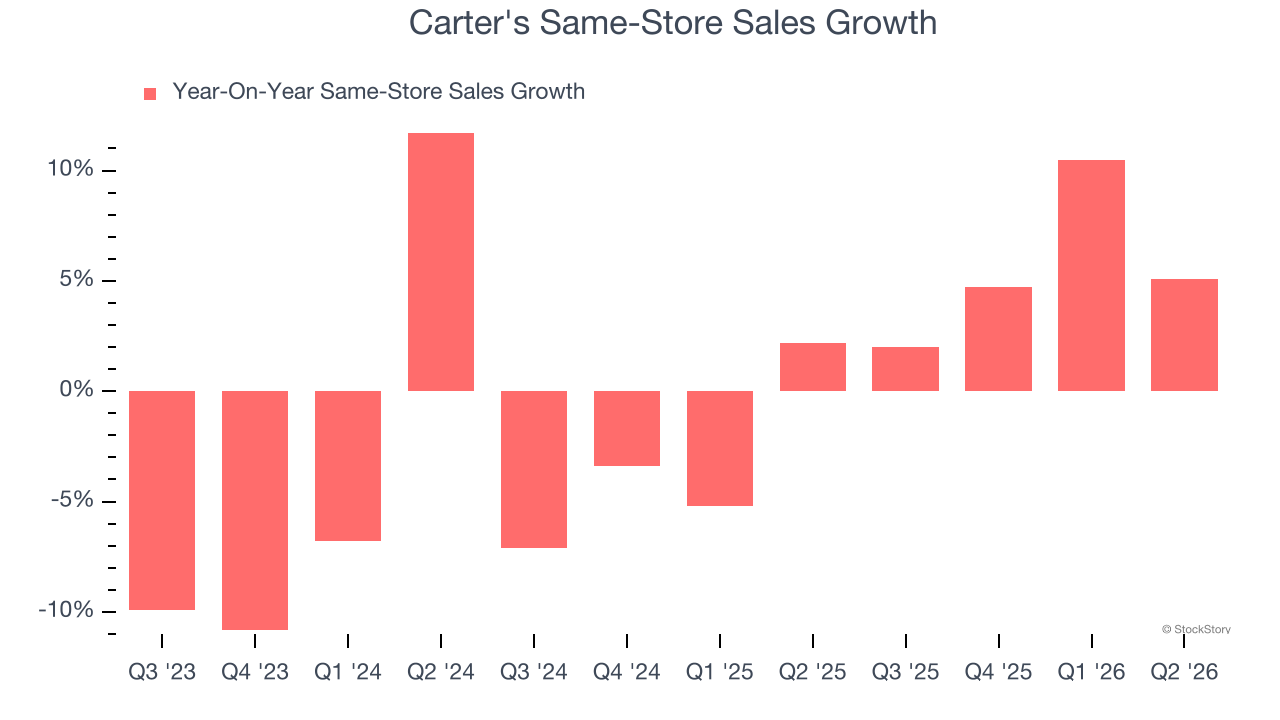
This quarter, Carter's reported year-on-year revenue growth of 5.2%, and its $615.5 million of revenue exceeded Wall Street’s estimates by 1.6%. Company management is currently guiding for a 1% year-on-year decline in sales next quarter.
Looking further ahead, sell-side analysts expect revenue to grow 1.9% over the next 12 months, similar to its two-year rate. This projection doesn’t excite us and implies its newer products and services will not catalyze better top-line performance yet.
ONE MORE THING: 3 Hidden Platforms Growing 3X Faster than Amazon, Google, and PayPal. Amazon, Google, and Meta all followed the same playbook: Dominate an ignored market. Build an unbeatable moat. Scale until you’re unstoppable.
These three platforms are running that exact playbook right now. The early investors in Amazon made fortunes. The early investors in these could do the same. Get All 3 Stocks Here for FREE.
Operating Margin
Carter’s operating margin has risen over the last 12 months and averaged 8.1% over the last two years. The company’s higher efficiency is a breath of fresh air, but its suboptimal cost structure means it still sports inadequate profitability for a consumer discretionary business.
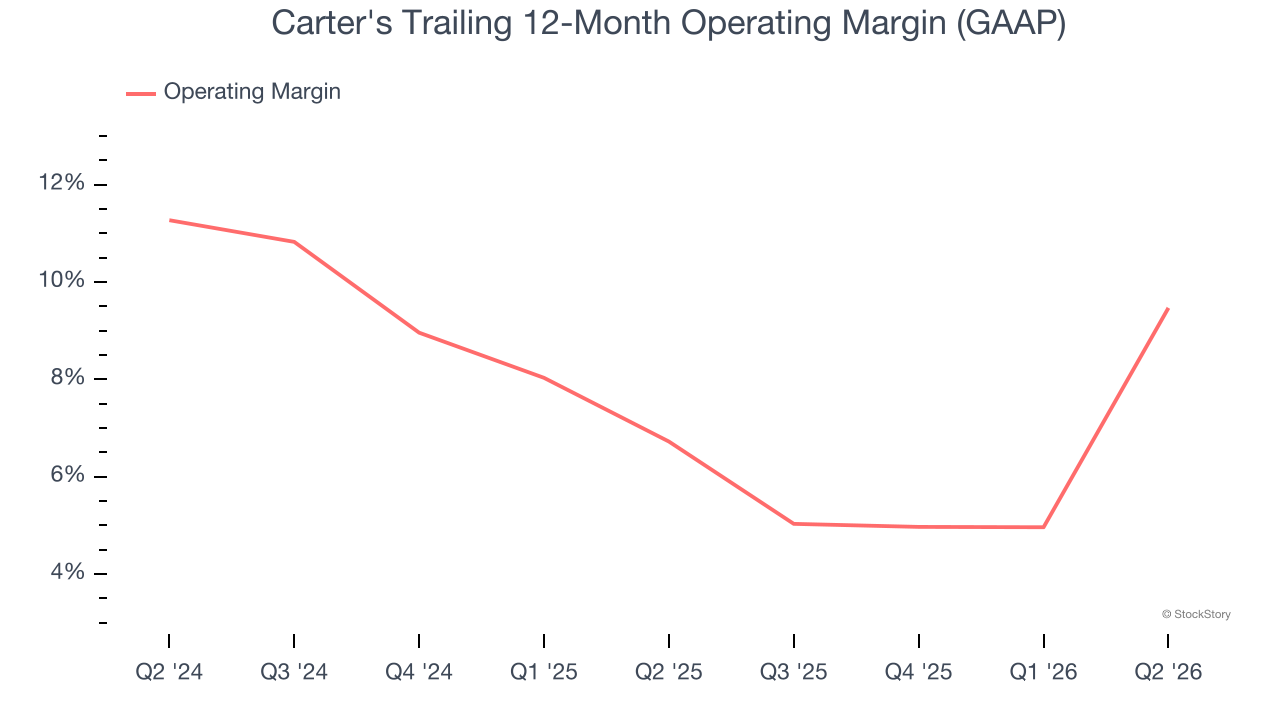
In Q2, Carter's generated an operating margin profit margin of 22.7%, up 22 percentage points year on year. This increase was a welcome development and shows it was more efficient.
Earnings Per Share
Revenue trends explain a company’s historical growth, but the long-term change in earnings per share (EPS) points to the profitability of that growth — for example, a company could inflate its sales through excessive spending on advertising and promotions.
Sadly for Carter's, its EPS declined by 16.4% annually over the last five years, more than its revenue. We can see the difference stemmed from higher interest expenses or taxes as the company actually improved its operating margin and repurchased its shares during this time.
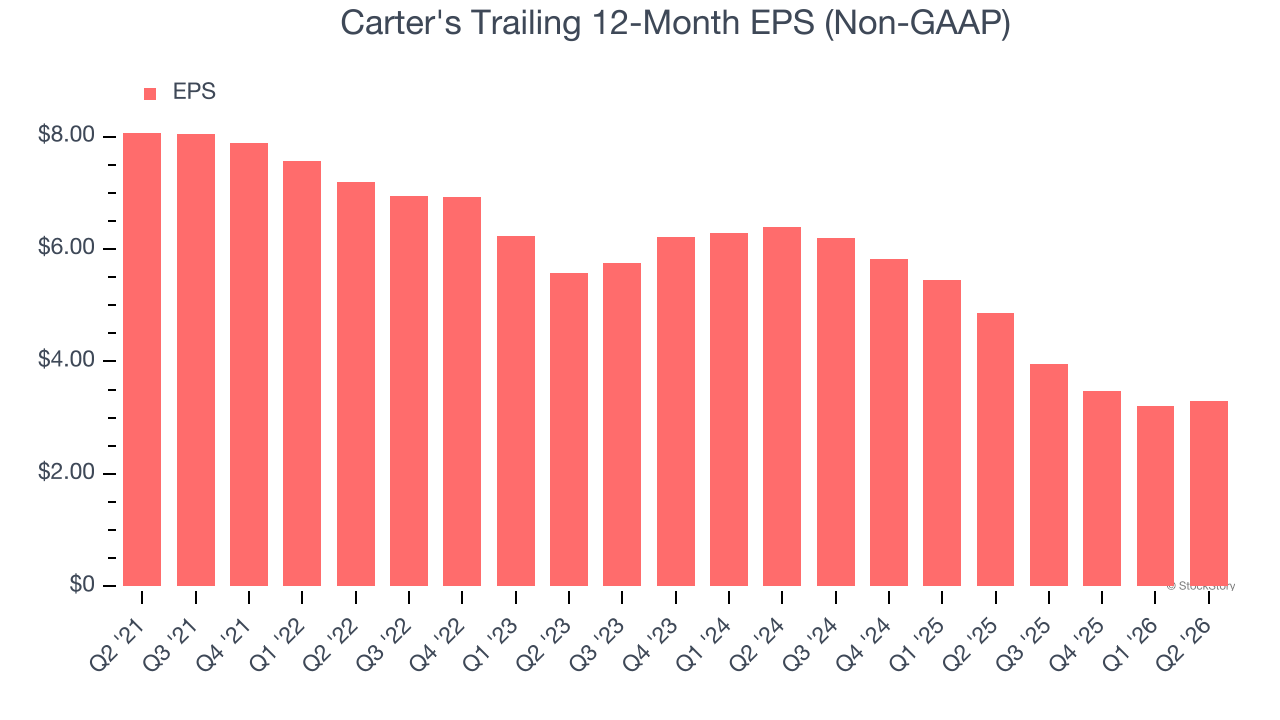
In Q2, Carter's reported adjusted EPS of $0.26, up from $0.17 in the same quarter last year. This print easily cleared analysts’ estimates, and shareholders should be content with the results. Over the next 12 months, Wall Street expects Carter’s full-year EPS to grow 6.2% from $3.29 to $3.50.
Key Takeaways from Carter’s Q2 Results
It was good to see Carter's beat analysts’ EPS expectations this quarter. We were also glad its EBITDA outperformed Wall Street’s estimates. On the other hand, its revenue guidance for next quarter missed and its EPS guidance for next quarter fell short of Wall Street’s estimates. Overall, this print could have been better. The market seemed to be hoping for more, and the stock traded down 3.2% to $36.59 immediately after reporting.
Should you buy the stock or not? What happened in the latest quarter matters, but not as much as longer-term business quality and valuation, when deciding whether to invest in this stock. We cover that in our actionable full research report which you can read here (it’s free).