Oil and gas producer ConocoPhillips (NYSE: COP) announced better-than-expected revenue in Q2 CY2026, with sales up 32.4% year on year to $19.52 billion. Its GAAP profit of $3.23 per share was 6.1% above analysts’ consensus estimates.
Is now the time to buy ConocoPhillips? Find out by accessing our full research report, it’s free.
ConocoPhillips (COP) Q2 CY2026 Highlights:
- Revenue: $19.52 billion vs analyst estimates of $17.81 billion (32.4% year-on-year growth, 9.6% beat)
- EPS (GAAP): $3.23 vs analyst estimates of $3.04 (6.1% beat)
- Free Cash Flow Margin: 22.6%, up from 1.4% in the same quarter last year
- Oil production: down -5.3% year on year
- Market Capitalization: $140.2 billion
Company Overview
Operating the famous Prudhoe Bay field discovered in 1968 that transformed Alaska's economy, ConocoPhillips (NYSE: COP) explores for and produces crude oil, natural gas, and liquefied natural gas across North America, Europe, Asia, and Africa.
Revenue Growth
Cyclical sectors like Energy often flatter weaker operators during favorable price environments, but a longer-term lens separates those from businesses that can consistently perform across market cycles. Thankfully, ConocoPhillips’s 15.9% annualized revenue growth over the last five years was solid. Its growth surpassed the average energy upstream and integrated energy company and shows its offerings resonate with customers, a great starting point for our analysis.
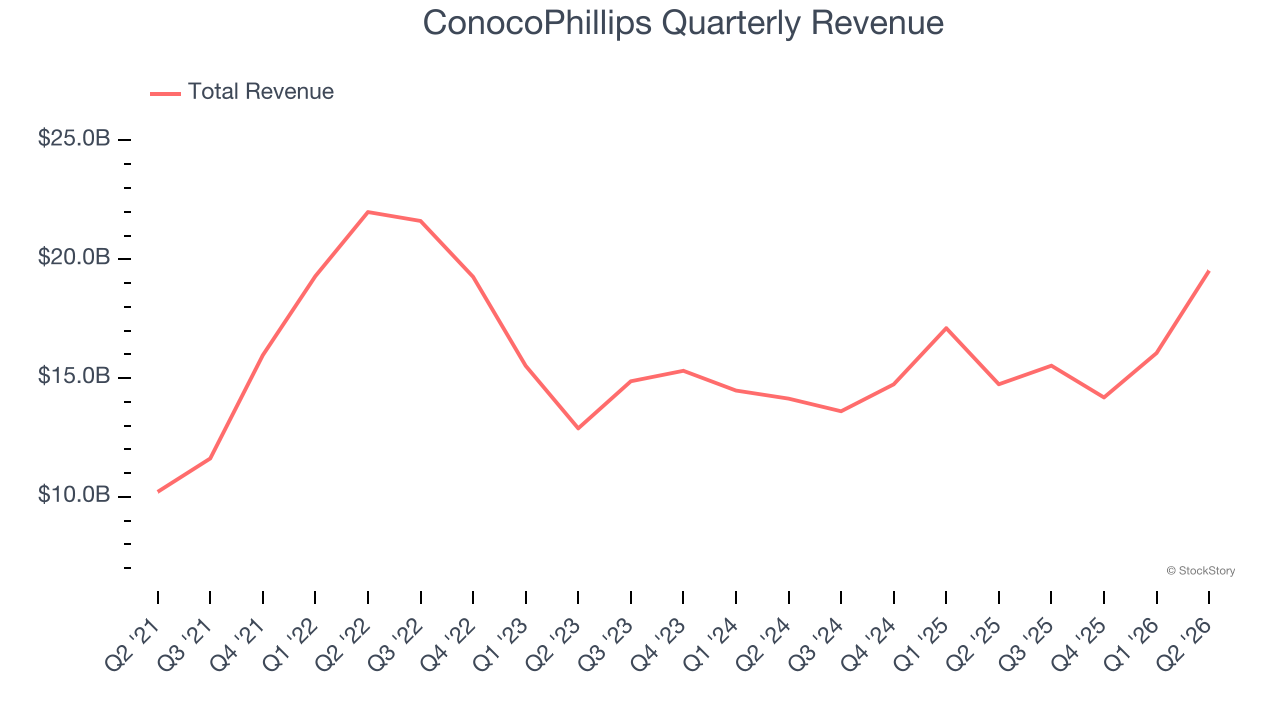
Even a long stretch in Energy can be shaped by a single commodity cycle, so extending the view to ten years adds another perspective and reveals which companies are built to grow regardless of the pricing regime. ConocoPhillips’s annualized revenue growth of 10.1% over the last ten years is below its five-year trend, but we still think the results suggest decent demand.
While looking at revenue is important, it can also introduce noise around commodity prices and M&A. Analyzing production, on the other hand, highlights what is happening inside the asset base and whether the economic footprint of a company is expanding. Over the last two years, ConocoPhillips’s oil production averaged 9.3% year-on-year growth while its natural gas production averaged 11.1% year-on-year growth. 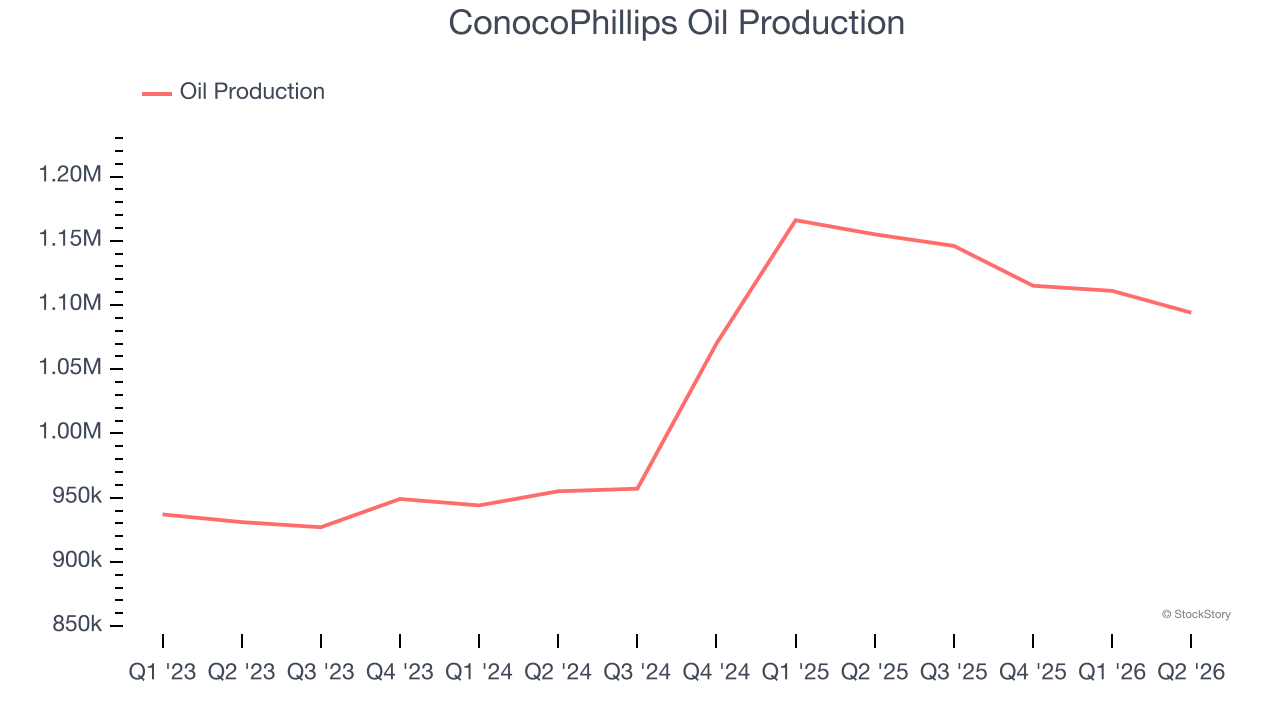
This quarter, ConocoPhillips reported wonderful year-on-year revenue growth of 32.4%, and its $19.52 billion of revenue exceeded Wall Street’s estimates by 9.6%. This quarter, ConocoPhillips’s Oil production fell by 5.3% year on year.
ALSO WORTH WATCHING: Nvidia’s Quiet Partner. Nvidia’s chips cost a hundred grand. The connectors that make them work cost even more. One company makes them all.
Every AI server needs specialized infrastructure the chip companies don’t make. High-speed cables. Power connectors. Thermal sensors. This 90-year-old company built a monopoly on it. The AI boom just started. This stock is still flying under the radar. Claim The Stock Ticker Here for FREE.
Adjusted EBITDA Margin
ConocoPhillips has managed its cost base well over the last five years. It demonstrated solid profitability for an upstream and integrated energy business, producing an average EBITDA margin of 42.7%.
Analyzing the trend in its profitability, ConocoPhillips’s EBITDA margin decreased by 7.1 percentage points over the last year. This raises questions about the company’s expense base because its revenue growth should have given it leverage on its fixed costs, resulting in better economies of scale and profitability.
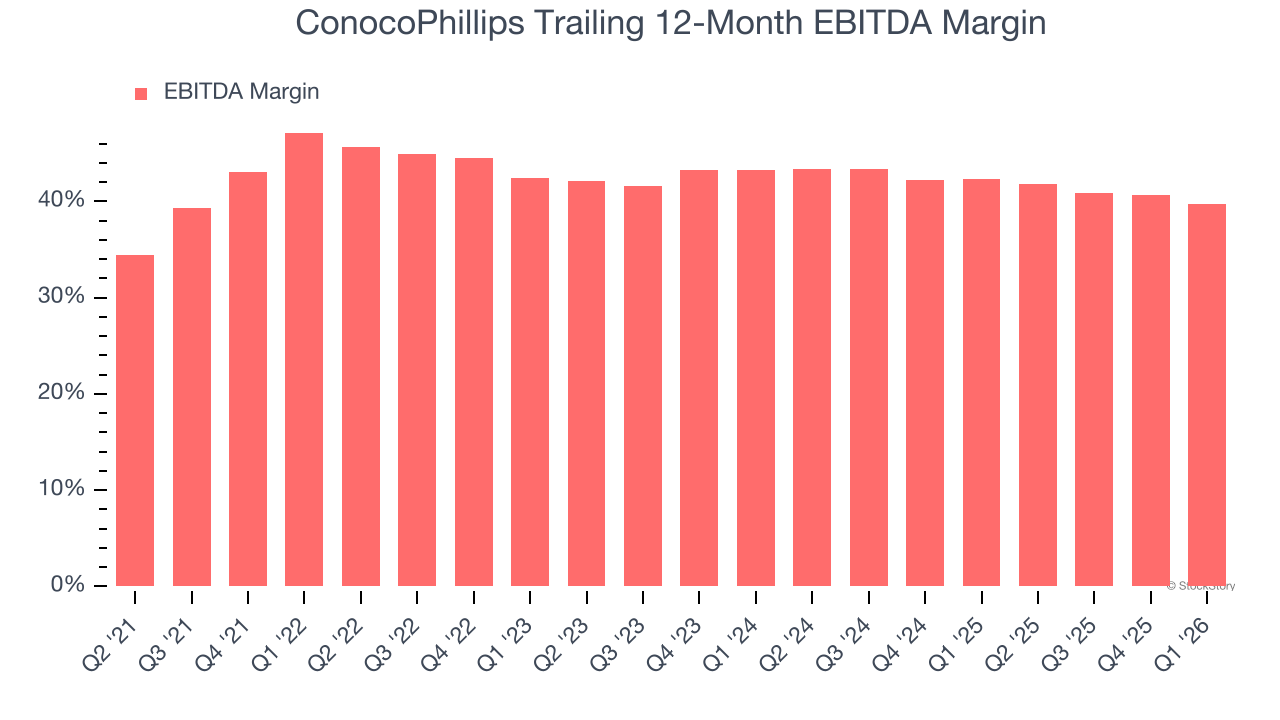
in line with the same quarter last year. This indicates the company’s overall cost structure has been relatively stable.
Cash Is King
As mentioned above, adjusted EBITDA ignores capital structure and drilling expenditure decisions. These are two huge aspects of an Energy producer, so in order to understand a comprehensive picture of business quality, an investor needs to account for these. Said differently, adjusted EBITDA margins could be solid but free cash flow is abysmal because decline rates of the asset are extreme and the drilling is expensive. Free cash flow tells you about not only the economics of the production that has happened but how much it costs to stay in business as well (further drilling or extraction).
ConocoPhillips has shown robust cash profitability, giving it an edge over its competitors and the ability to reinvest or return capital to investors. The company’s free cash flow margin averaged 17.3% over the last five years, quite impressive for an upstream and integrated energy business.
The level of free cash flow is important, but its durability across cycles is just as critical. Consistent margins are far more valuable than volatile swings driven by commodity prices.
ConocoPhillips’s ratio of quarterly free cash flow volatility to WTI Crude price volatility over the past five years was 3.8 (lower is better), indicating unusually strong insulation from commodity swings. This stability supports superior capital access in downturns and positions ConocoPhillips to act as a consolidator when weaker peers are forced to retrench.
You may be asking why we wait until the free cash flow line to perform this stability analysis versus commodity prices. Why not compare revenue or EBITDA to WTI Crude prices in the case of ConocoPhillips? Because what ultimately matters is not how much revenue or profit you earn when prices are high but how much cash you can generate when prices are low. Free cash flow is the superior metric because it includes everything from hedging prowess to growth and maintenance capex to management behavior during good times and bad.
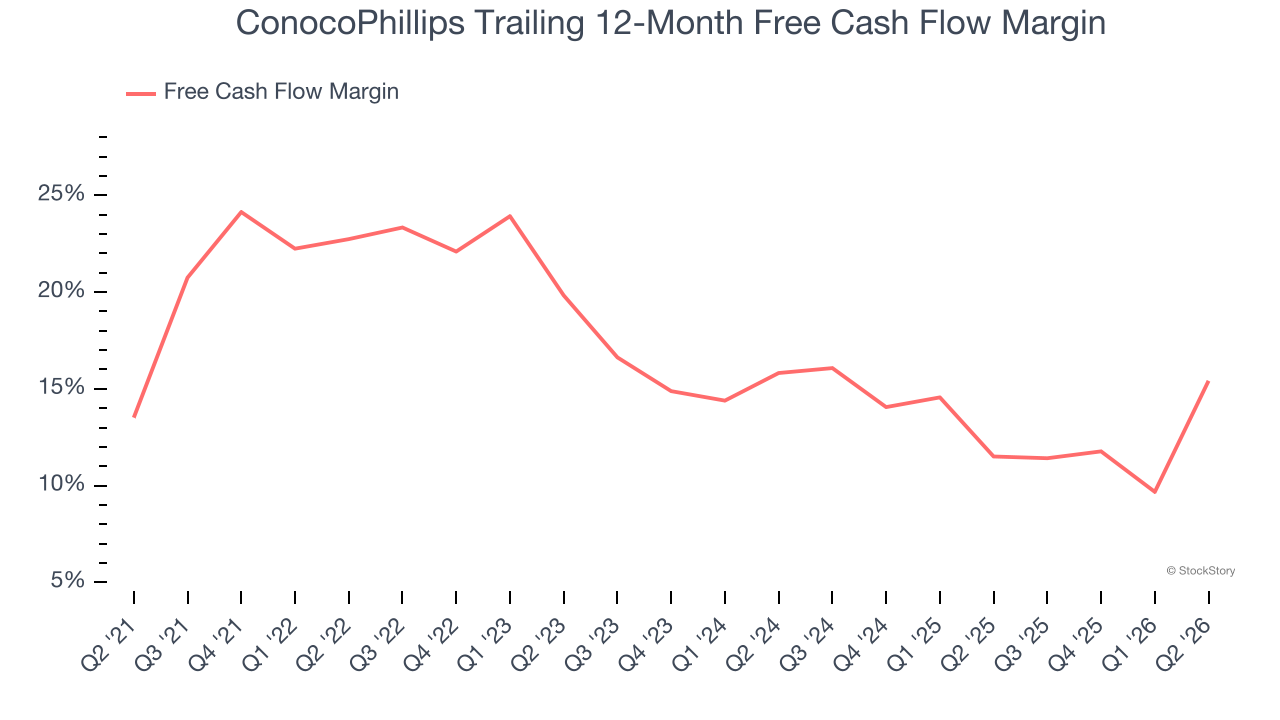
ConocoPhillips’s free cash flow clocked in at $4.41 billion in Q2, equivalent to a 22.6% margin. This result was good as its margin was 21.2 percentage points higher than in the same quarter last year. Its cash profitability was also above its five-year level, and we hope the company can build on this trend.
Key Takeaways from ConocoPhillips’s Q2 Results
We were impressed by how significantly ConocoPhillips blew past analysts’ revenue expectations this quarter. We were also glad its EPS outperformed Wall Street’s estimates. Zooming out, we think this was a solid print. The stock traded up 1.3% to $116.57 immediately after reporting.
Sure, ConocoPhillips had a solid quarter, but if we look at the bigger picture, is this stock a buy? When making that decision, it’s important to consider its valuation, business qualities, as well as what has happened in the latest quarter. We cover that in our actionable full research report which you can read here (it’s free).