
Chip powerhouse QUALCOMM Incorporated (QCOM) recently reported its fiscal fourth quarter (ended September 24) results, which showed declines in the company’s top and bottom-line figures compared to the prior year period.
For the fourth quarter, QCOM’s non-GAAP revenues declined 24% year-over-year to $8.67 billion, while its non-GAAP EPS came in at $2.02, down 35% from the prior-year quarter. However, both figures topped the analyst estimates of $8.51 billion and $1.91, respectively.
The company remains optimistic about its prospects due to the potential turnaround in smartphone sales. QCOM’s fourth-quarter revenue from smartphone handsets was $5.46 billion, beating the analyst estimate of $5.34 billion, on the backs of renewed demand from China.
QCOM expects revenue between $9.1 billion and $9.9 billion for the first quarter of fiscal 2024, with a midpoint value above analysts' expectations of $9.2 billion, while it projects non-GAAP EPS between $2.25 and $2.45, compared to the expected $2.23.
Given this positive outlook, let’s look at the trends of QCOM’s key financial metrics to understand why it could be wise to invest in the stock now.
Analyzing QUALCOMM's Financial Performance, Price Ratios, and Analyst Targets (2020-2023)
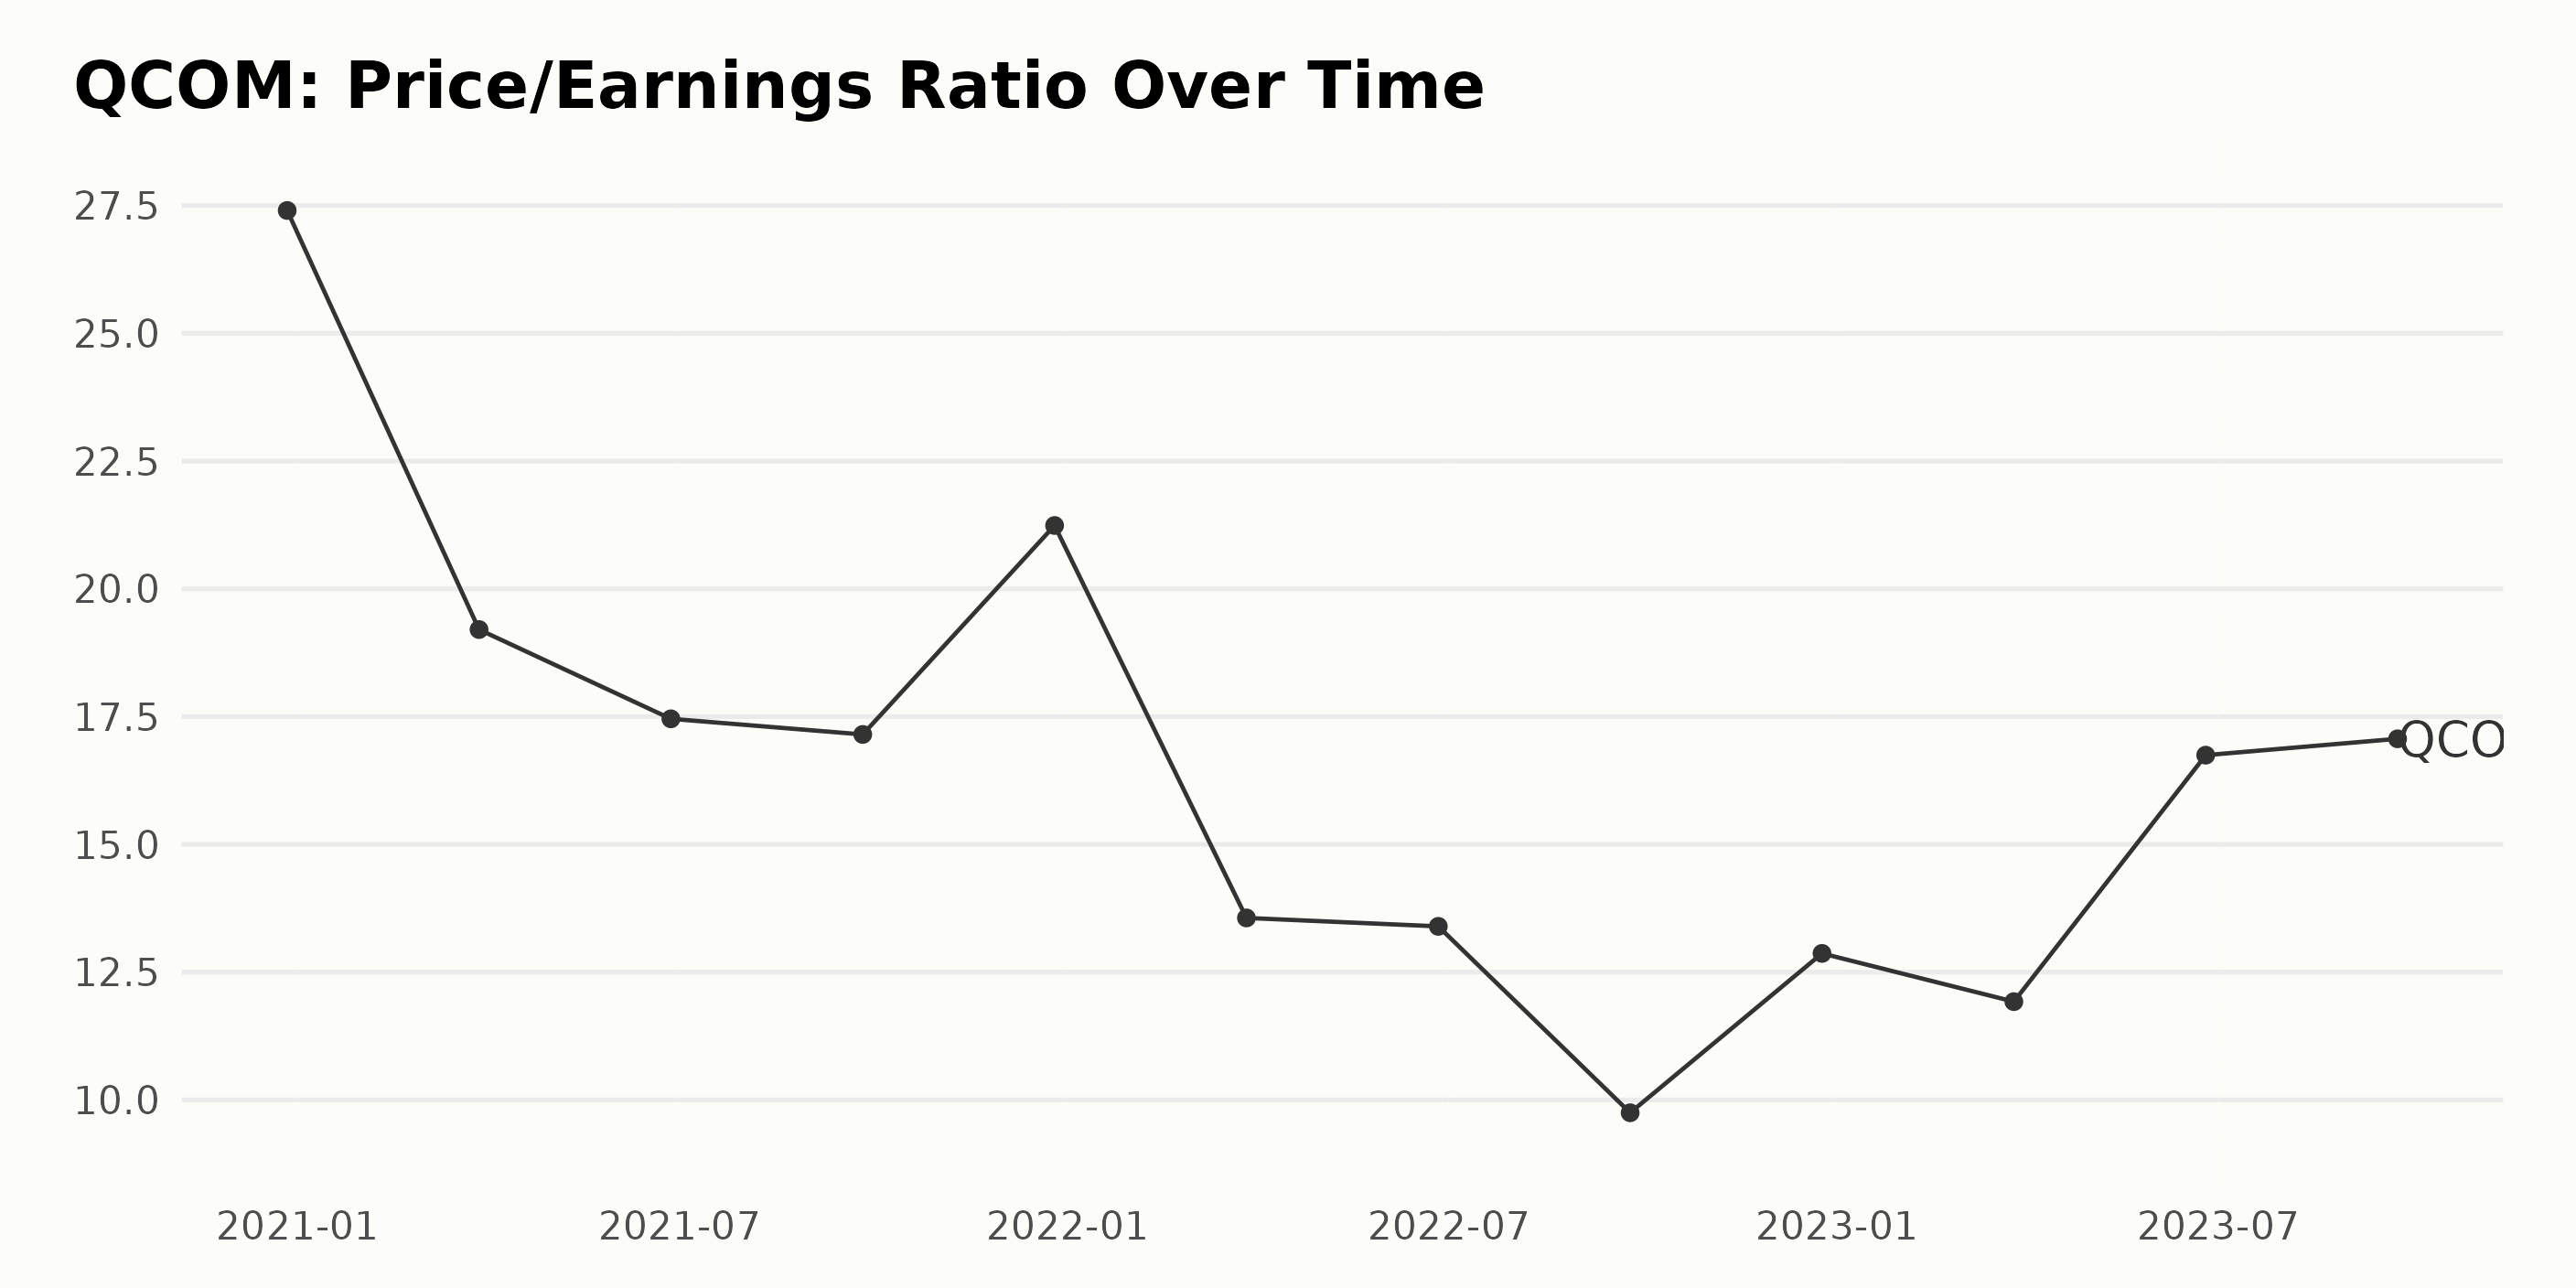
The data provided reveals the trend and fluctuations of the Price/Earnings Ratio (P/E) for QCOM over a period spanning from December 27, 2020, to September 24, 2023.
- From December 2020 to September 2021, there is an overall decreasing trend in P/E from 27.40 to 9.75.
- The biggest drop was seen between March 2021 and June 2021, where the P/E decreased from 19.20 to 17.46.
- The lowest P/E in this period was recorded on September 25, 2022, with a value of 9.75.
- However, after reaching the lowest point, an upward trend can be observed starting from December 25, 2022, with the P/E rising from 9.75 to 17.07 on September 24, 2023.
- Note the strongest growth within this period from March 2023 to June 2023, when P/E rose from 11.92 to 16.75.
When considering the growth rate calculated from the difference between the first value (December 27, 2020; 27.40) and the last value provided (September 24, 2023; 17.07), a decrease of approximately 38% can be noted throughout the series. This suggests although there were periods of recovery, the overall long-term trend for this period indicates a decrease in the Price/Earnings Ratio.
QCOM has experienced a series of fluctuations in its trailing-12-month revenue over the observed period, with an overall trend towards growth until a downturn in recent quarters:
- From December 2020 through June 2022, QCOM’s revenue progressively increased. The company's revenue went from $26.69 billion in December 2020, peaking at $44.2 billion in September 2022.
- However, after September 2022, the revenue started to decline and continued the downward trajectory through September 2023. By September 2023, the revenue had fallen to $35.82 billion.
- Recent data shows that QCOM's revenue decreased first from $42.96 billion in December 2022 to $41.07 billion in March 2023, then further dropped to its last reported value of $35.82 billion in September 2023.
Comparing the first reported value in December 2020 ($26.69 billion) and the last reported value in September 2023 ($35.82 billion), the growth rate during this period was approximately 34.18%, indicating a substantial increase in revenue despite the recent reductions.

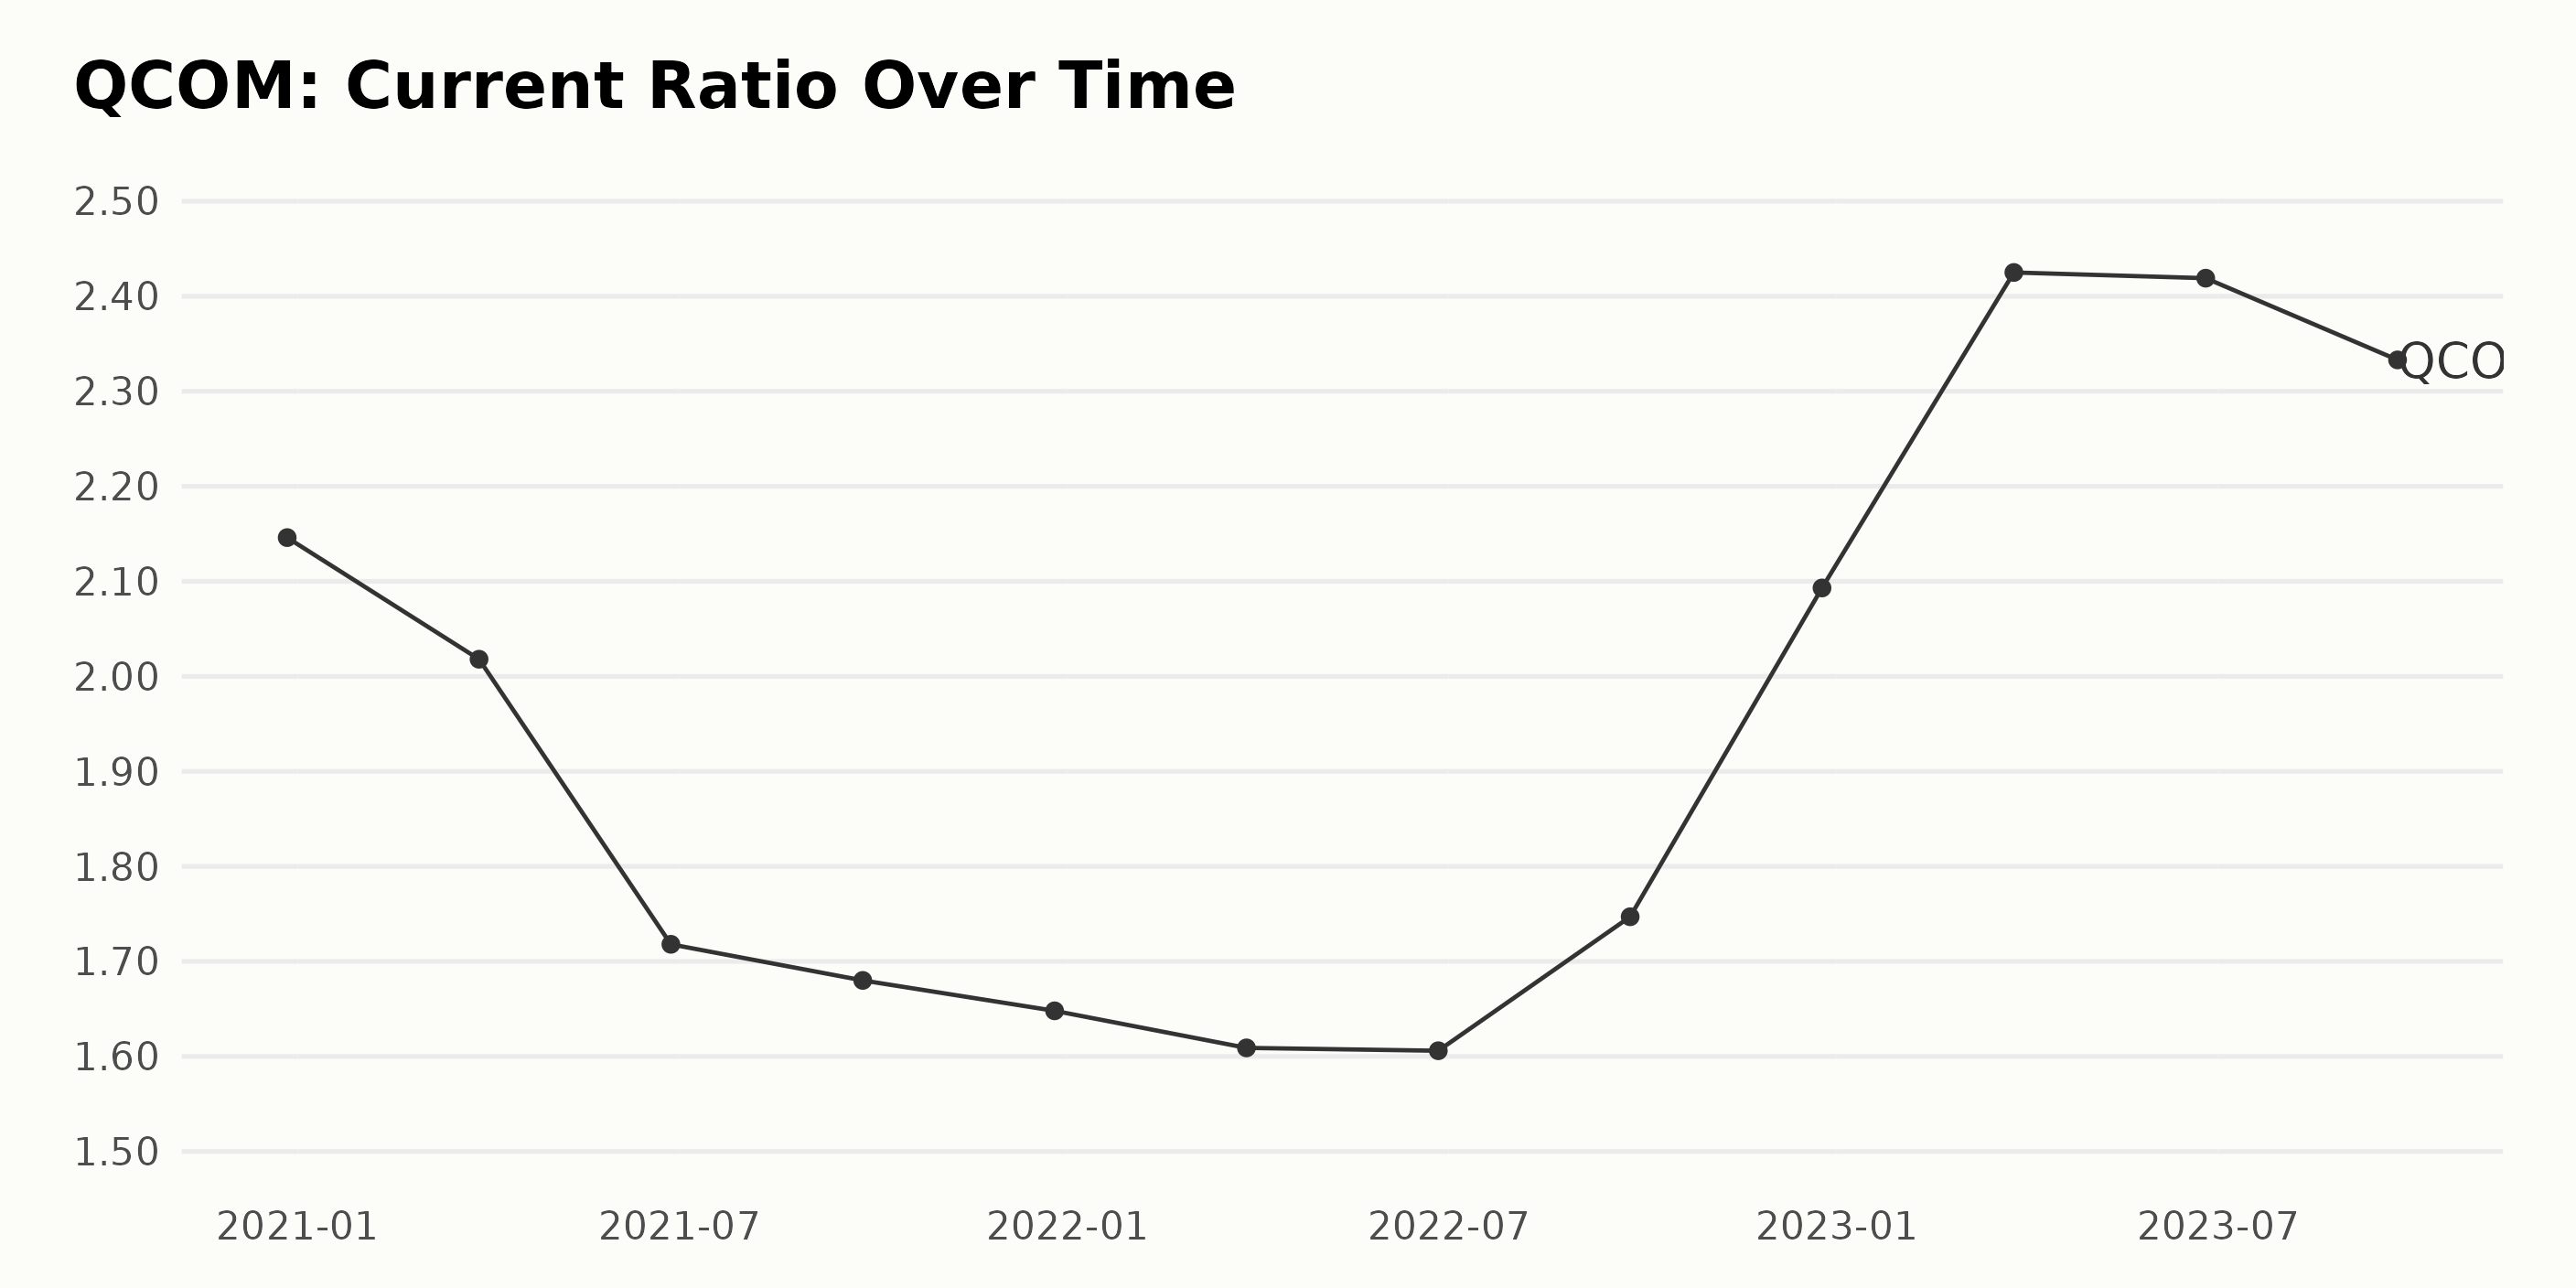
The data represents the fluctuations in the current ratio of QCOM from December 2020 to September 2023.
- On December 27, 2020, the current ratio was 2.15.
- The ratio continually decreased until June 26, 2022, when it was reported at 1.61, representing a reduction of about 25% compared to the first value.
- The current ratio showed a slight increase on September 25, 2022, reaching 1.75. - There was a significant increase by the end of December 2022, with the ratio reaching 2.09.
- By March 26, 2023, the ratio had reached a peak of 2.43, an improvement of around 35% from the lowest value recorded in June 2022.
- From there, the following months (June and September 2023) showed a downward trend, with the ratio moderately decreasing to 2.33 by September 24, 2023.
Overall, the current ratio of QCOM in this series shows marked fluctuation but ends with an upward growth trend of approximately 9% compared to the starting figure. Emphasizing the most recent data, the trend suggests a slow downward adjustment from March to September 2023, though the current ratio remains significantly above its mid-2022 levels.
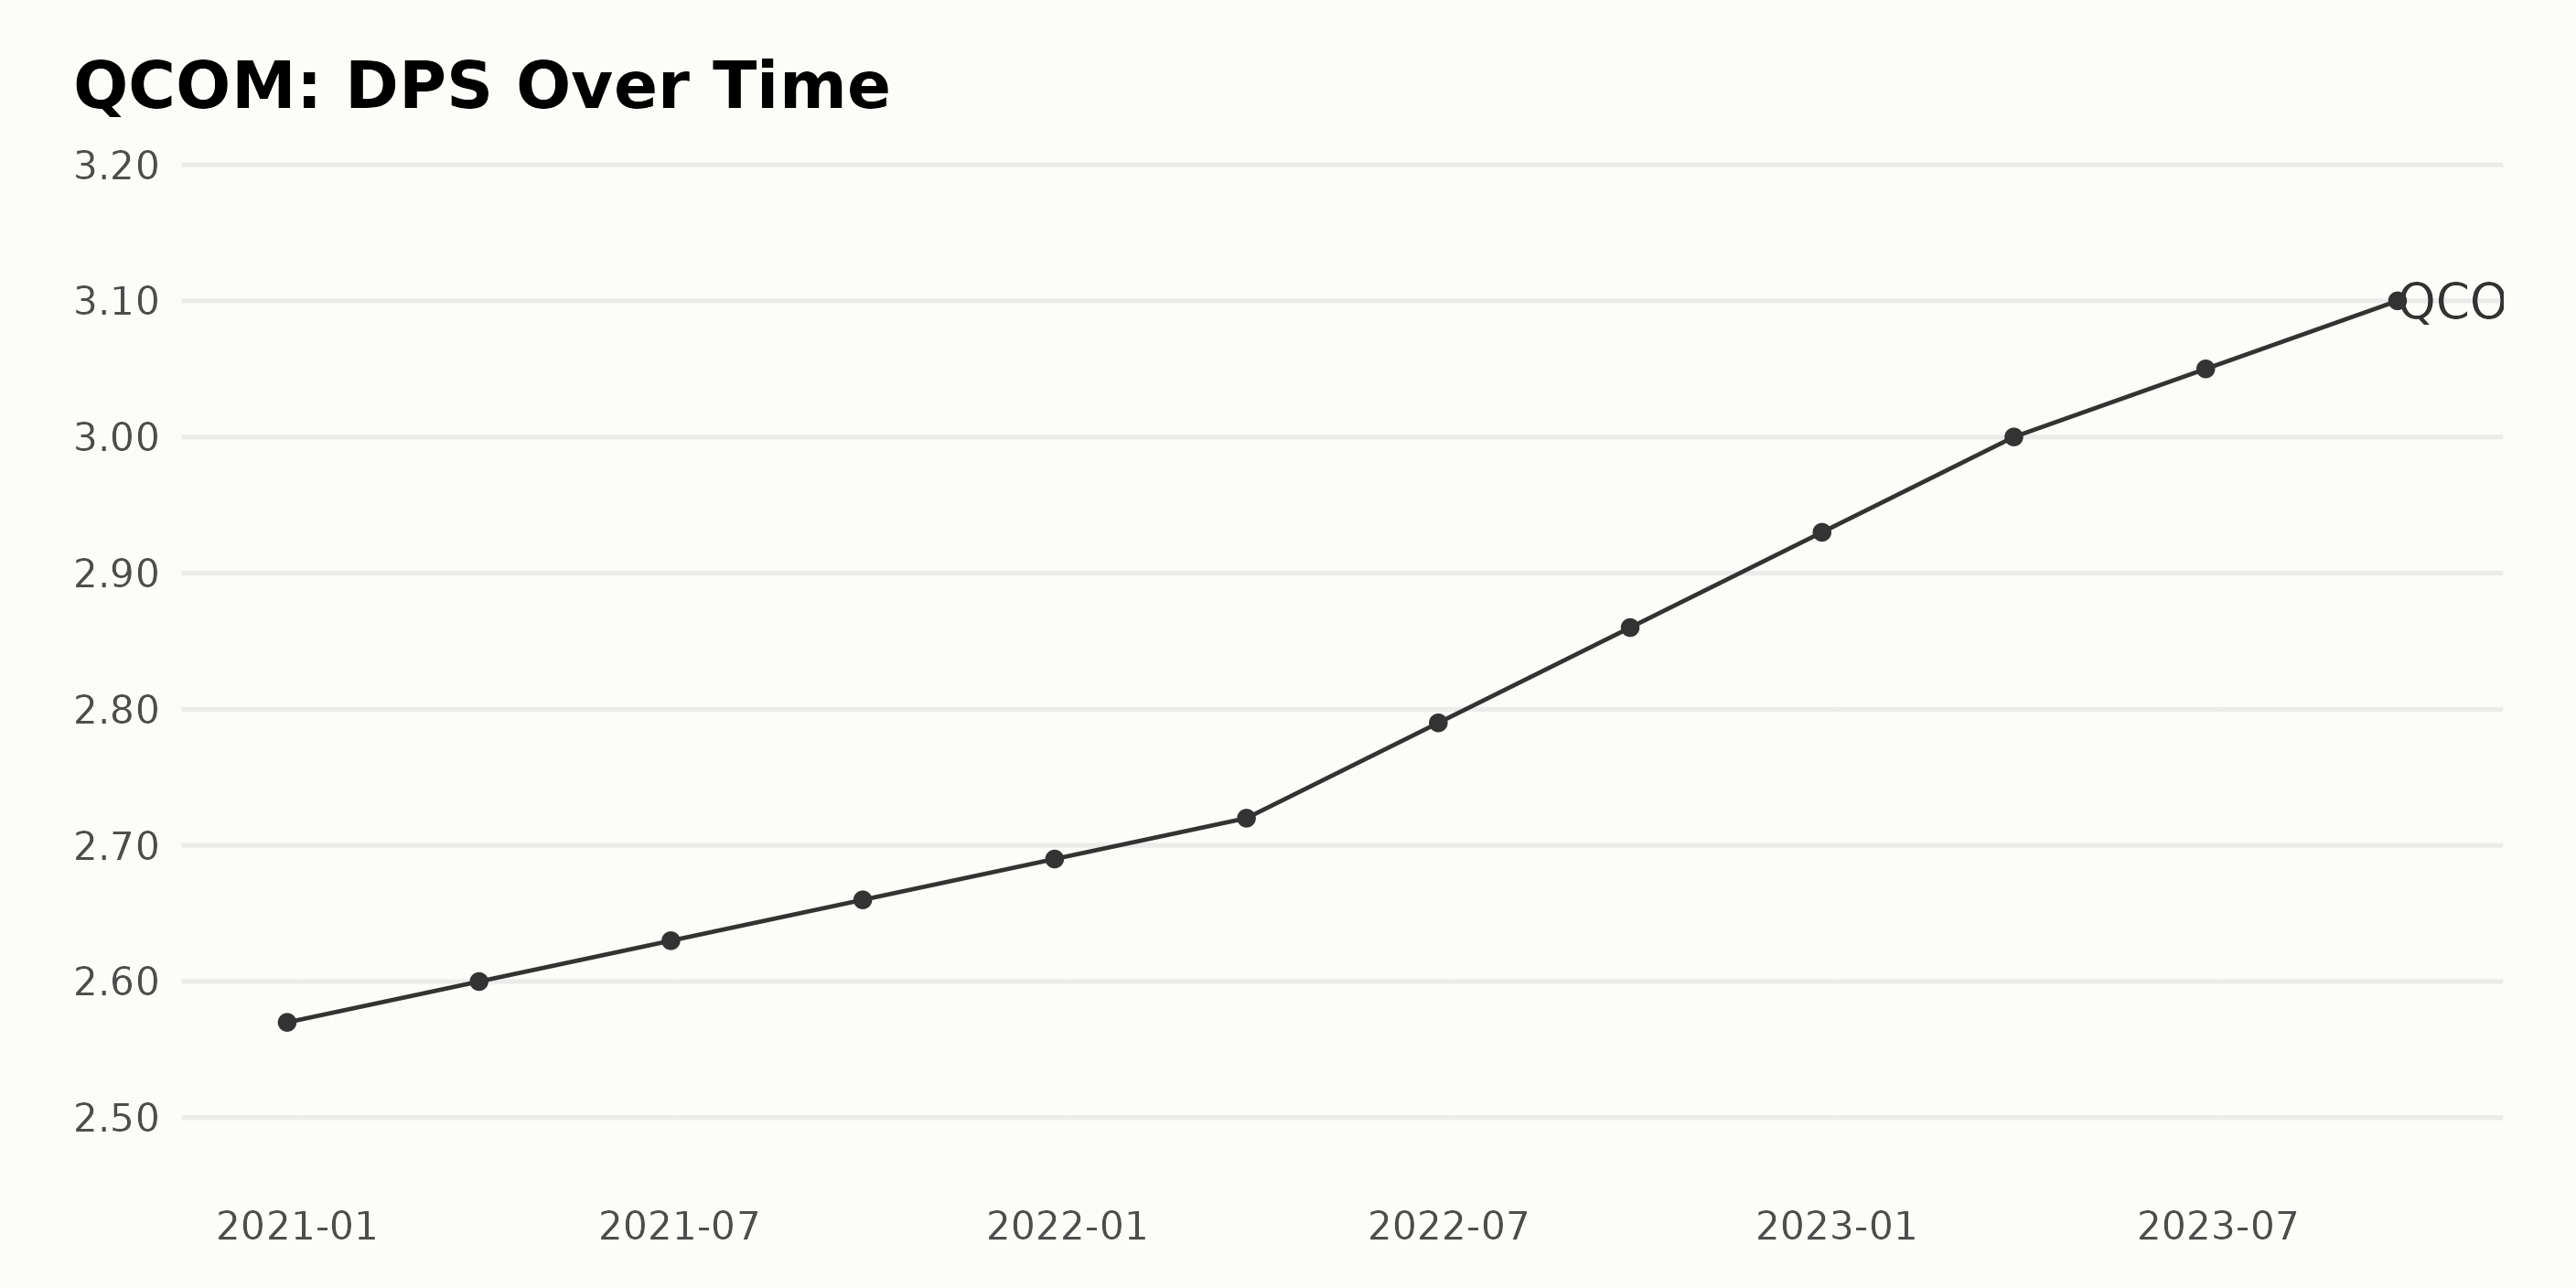
The DPS of QCOM showcases a steady upward trend from December 2020 to September 2023, according to the dataset. The data reflects incremental yet consistent growth over this span, signaling a positive financial prospect for QCOM. Notable points include:
- QCOM posted a DPS of $2.57 in December 2020, which advanced to $2.6 in March 2021.
- A consistent climb was observed thereafter, reaching $2.72 by March 2022.
- More recently, on December 25th, 2022, QCOM's DPS clocked in at $2.93.
- Finally, the last value in this dataset as of September 24, 2023, reports QCOM's DPS standing at $3.1.
By comparing the first and last DPS figures within the given series, the growth rate can be computed as approximately 20.62%. These statistics indicate a strong and steady upward trend for QCOM's DPS, highlighting its progressive financial performance over recent years. It demonstrates QCOM's commitment to provide returns to its shareholders while maintaining consistent growth.
Assessing QUALCOMM's Fluctuating Share Price Trends: A Six-Month Analysis
Upon examining the share price data for QCOM, the following trends can be observed:
- On May 12, 2023, the share price was $105.71. By May 19, 2023, a slight decrease to $105.36 was noted.
- Between May 26, 2023, and June 2, 2023, there was an increase in the share price from $104.71 to $114.83 - indicating a sharp growth. This upward trend continued until June 16, 2023, with the share price reaching its peak at $123.09.
- However, by June 23, 2023, the value had dropped to $116.66 - marking a deceleration in the growth rate before settling at $117.91 by the end of June.
- The month of July saw modest growth, starting from $117.10 on July 7, 2023, and ending at $125.96 on August 4, 2023.
- Subsequently, a noticeable downward trend is observed in mid-August, with the share price dipping to as low as $110.13 by August 25, 2023.
- Throughout September, the share price fluctuated moderately between $113.43 and $110.08.
- In October, the prices remained relatively stable, ranging from $110.25 to $107.23.
- By early November, the share price climbed slightly up to $117.36 on November 2, 2023.
Overall, the data suggests that QCOM experienced both rising and falling trends within this time frame. The rapid growth seen in early June decelerated through late June and July. Another sharp decline occurred in mid-August, followed by a more stable period from September to November.
Here is a chart of QCOM's price over the past 180 days.

Assessing QUALCOMM's Outstanding Ratings in Value, Quality and Momentum.
The POWR Ratings grade of QCOM, a stock in the Semiconductor & Wireless Chip category with 91 stocks in total, fluctuates between B (Buy) and C (Neutral) over the observed period from May 13, 2023 to November 2, 2023. Here is a summarized analysis:
- In the week of May 13, 2023, to June 10, 2023, QCOM maintains a POWR grade of C (Neutral) and ranks between position #30 to #34 in its category.
- However, the stock showed improvement starting from June 17, 2023, till September 23, 2023, with its POWR grade boosted to B (Buy). The rank in its category varied from #17 to #29 during this period.
- There was a brief setback on September 23, 2023, when its POWR grade dropped back to C (Neutral), but it quickly rebounded back to B (Buy) a week later.
- The rank within its category had slight fluctuations toward the end of the observed period, happening from September 30, 2023, to November 2, 2023. But, throughout these fluctuations, the POWR grade remained steady at B (Buy).
Therefore, as of the latest date, which is November 3, 2023, the company has a POWR grade of B (Buy) and ranks #17 within its category.
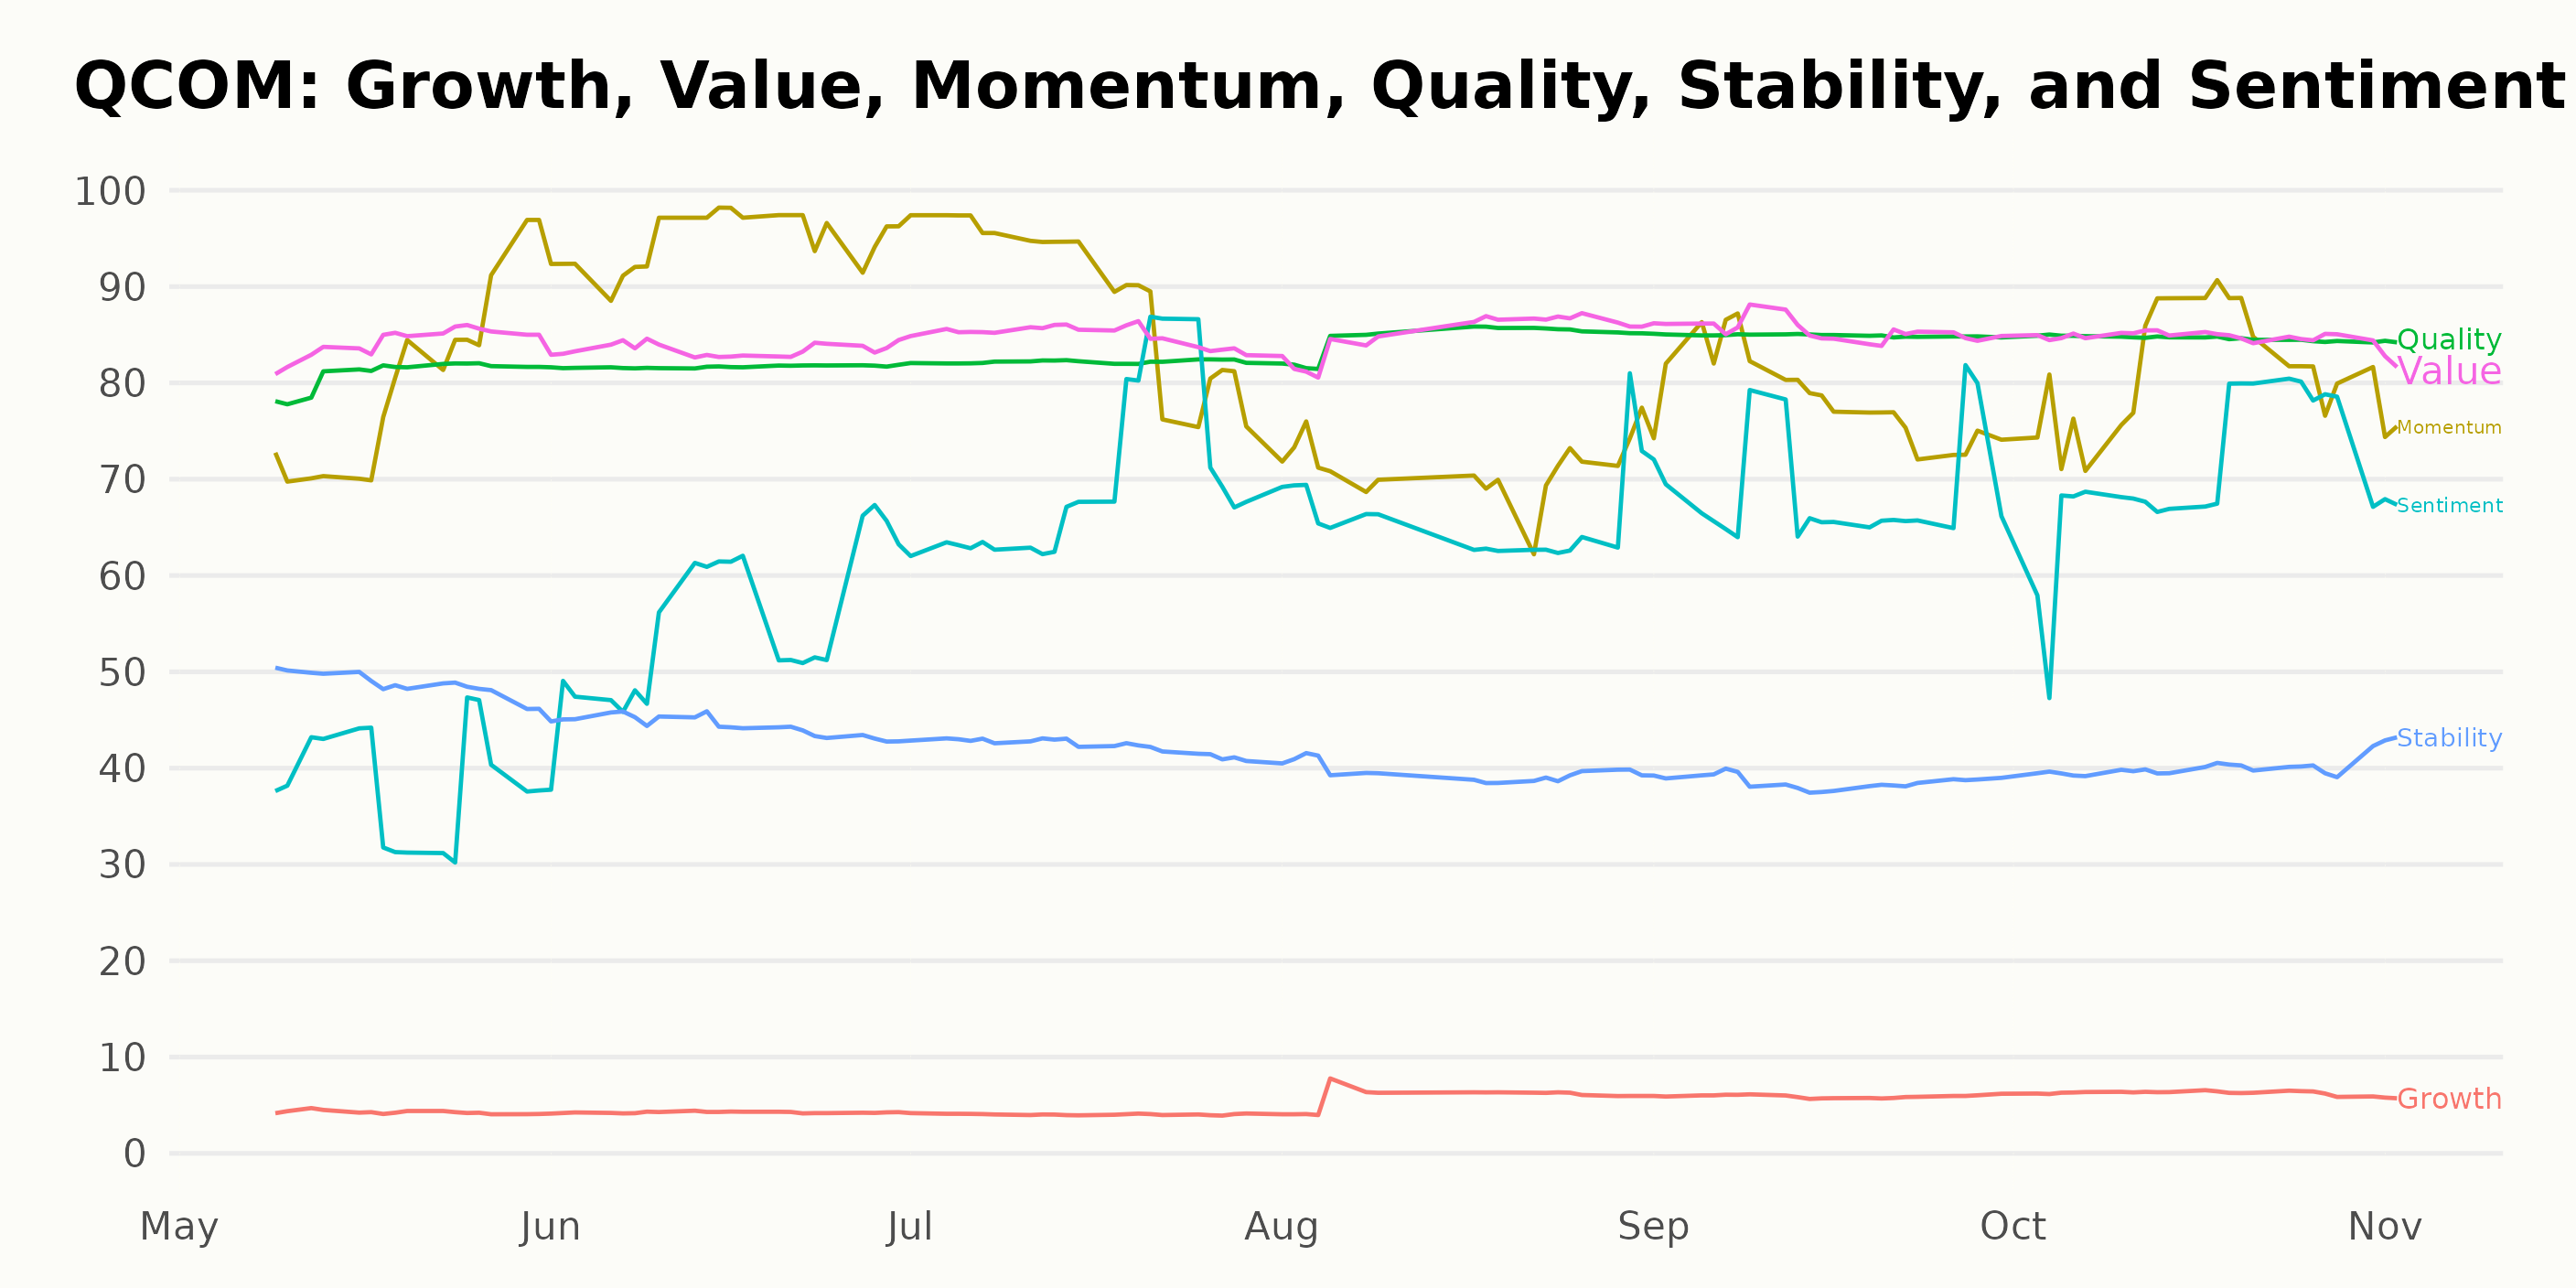
Based on the POWR Ratings for QCOM, the three most noteworthy dimensions are Value, Quality, and Momentum. They consistently reflect the highest ratings across the indicated timeline. Below are the observations and trends for these dimensions:
Value: The Value dimension shows consistently high ratings throughout. It starts with a strong 84 in May 2023 and ends with a similar value of 82 in November 2023. The peak value for this dimension is observed in July, August, September, and October 2023, where it reaches 85.
Quality: The Quality dimension also exhibits high ratings, starting from 81 in May 2023 and increasing to a steady rating of 85 from August to October 2023. A slight dip is observed in November 2023 to 84. This demonstrates an overall increasing trend in quality ratings during this period.
Momentum: The Momentum dimension showed dynamic changes with a clear upward trend from May 2023 (80) to June 2023 (95). Then, it has a fluctuating yet high rating ranging between 71 and 82 from July to November 2023. Despite fluctuations, the Momentum dimension maintained high values, indicating a strong performance.
In summary, the consistently high ratings in Value, Quality, and Momentum suggest a strong position for QCOM based on these dimensions.
How does QUALCOMM Incorporated (QCOM) Stack Up Against its Peers?
Other stocks in the Semiconductor & Wireless Chip sector that may be worth considering are ChipMOS TECHNOLOGIES INC. (IMOS), Everspin Technologies, Inc. (MRAM), and Infineon Technologies AG (IFNNY). Click here to explore more Semiconductor & Wireless Chip stocks.
What To Do Next?
Discover 10 widely held stocks that our proprietary model shows have tremendous downside potential. Please make sure none of these “death trap” stocks are lurking in your portfolio:
QCOM shares were trading at $119.43 per share on Friday afternoon, up $2.07 (+1.76%). Year-to-date, QCOM has gained 10.83%, versus a 15.19% rise in the benchmark S&P 500 index during the same period.
About the Author: Anushka Dutta

Anushka is an analyst whose interest in understanding the impact of broader economic changes on financial markets motivated her to pursue a career in investment research.
The post QUALCOMM (QCOM) Faces Q4 Revenue and EPS Setback but Remains Optimistic for Future: Buy, Hold, or Sell? appeared first on StockNews.com