
It has consistently yielded more than 10% since its inception more than three years ago. It expectedly sank when interest rates gyrated lower. And it is in one of the hottest styles the ETF market has ever seen, covered-call-writing funds. But despite all of that, you probably have not heard of it. So it’s time you did.
I’m talking about the iShares 20+ Year T-Bond Buywrite Strategy ETF (TLTW), a $1.5 billion fund. That’s not a small number, but nothing compared to the uber-popular proxy for long bonds, the nearly $50 billion iShares 20+ Year Treasury ETF (TLT). TLT owns the longest end of the Treasury curve, 20-30 year maturities. Those typically offer higher yields than short-term bonds, although in recent years that has not been the case.
Instead, T-bill rates, which mature in up to 12 months, have been the high yielders.
But as the bond market finally settles into a more normal up-sloping curve following a few years of a non-traditional “inverted” look, the potential for long-term bonds to appreciate in price while still providing nice yield is more likely to be a double-barrelled winning situation.
TLTW simply owns TLT and some cash, and sells covered call options on TLT using custom-designed FLEX options. That produces covered call income on top of TLT’s current payout of around 4%.
TLT looks quite good technically. I’ve used a very long-term view here, so we can see how it has been forming what could be a solid price base. And the Percentage Price Oscillator (PPO) indicator at the bottom is starting to rise in a bullish pattern.
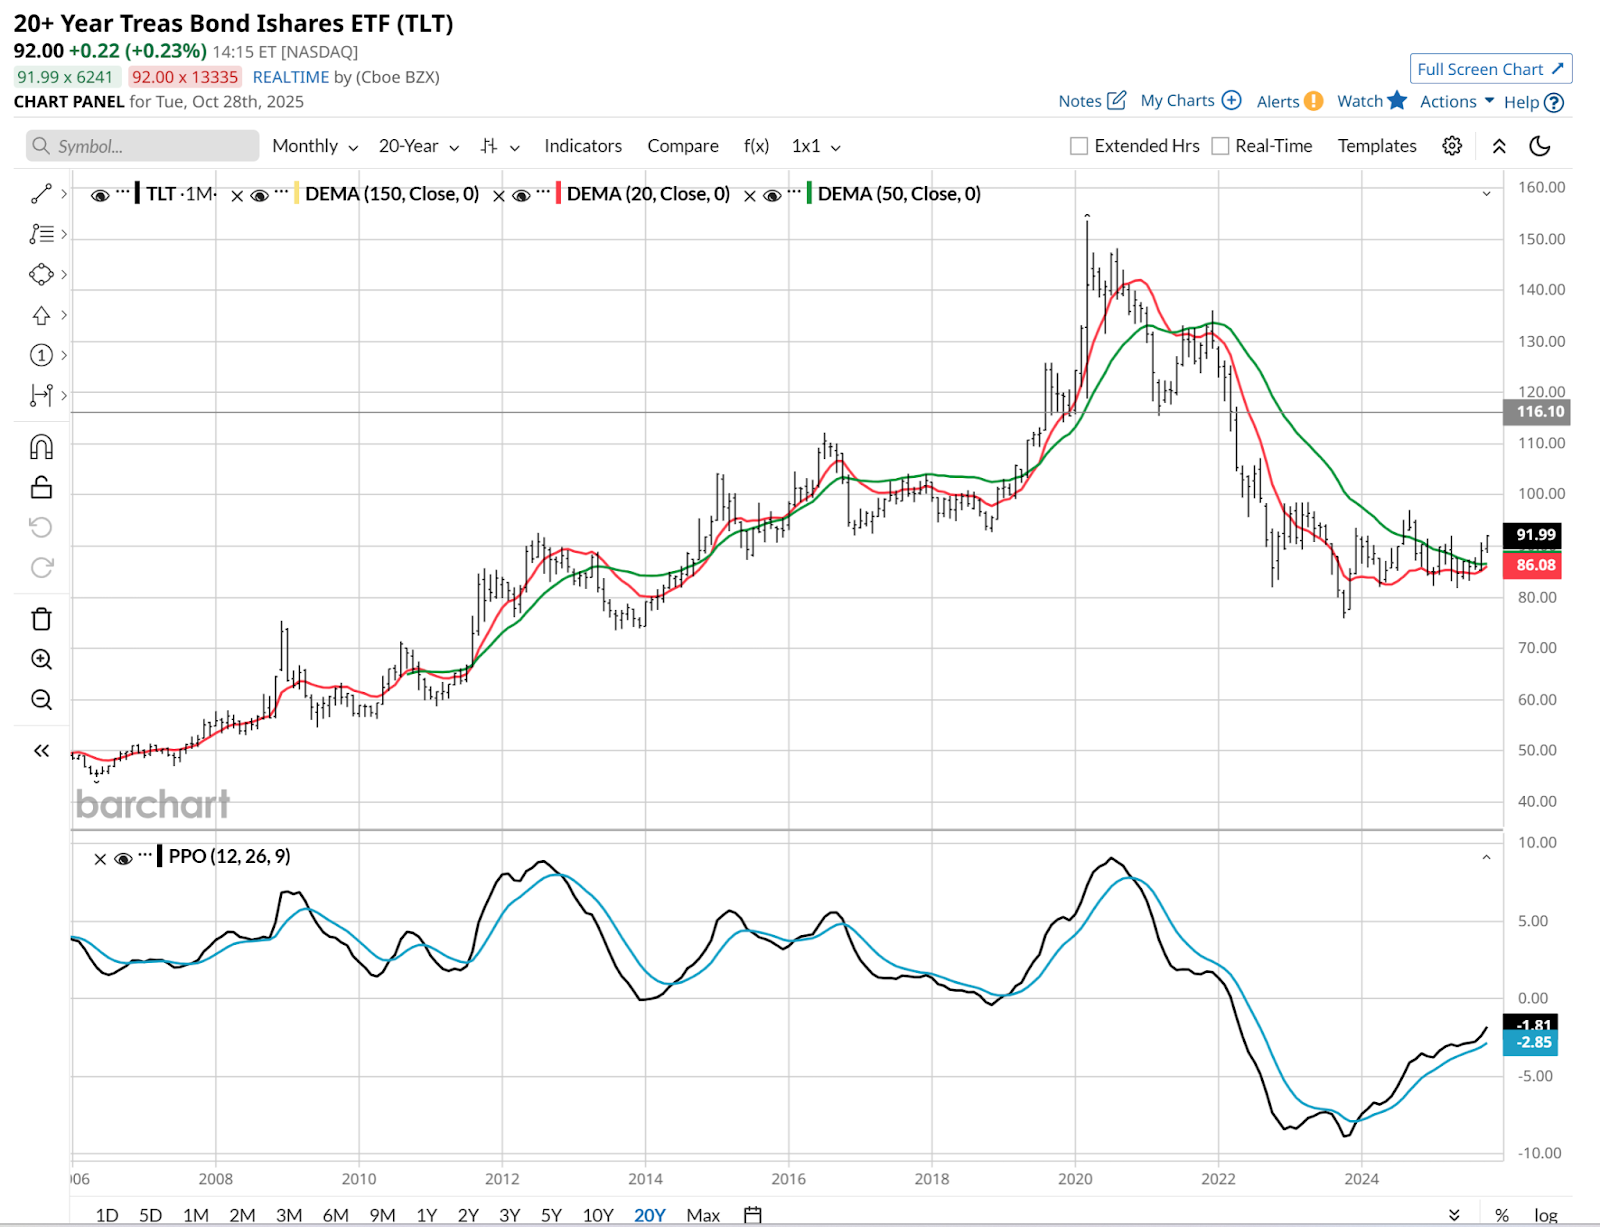
While the Federal Reserve’s interest rate actions last week – and those to come in December – do not impact long-term bonds directly, the Fed’s discussion of market and economic conditions often do. So that is one place for traders to look for clues to confirm that TLT’s price looks higher.
A look at the full yield curve from four months ago (in red) and this week (in blue) indicates that a yield drop has begun. That’s what helps drive that second part of TLTW’s return, since the covered call income and regular TLT income already create a non-price return of more than 10% annually.
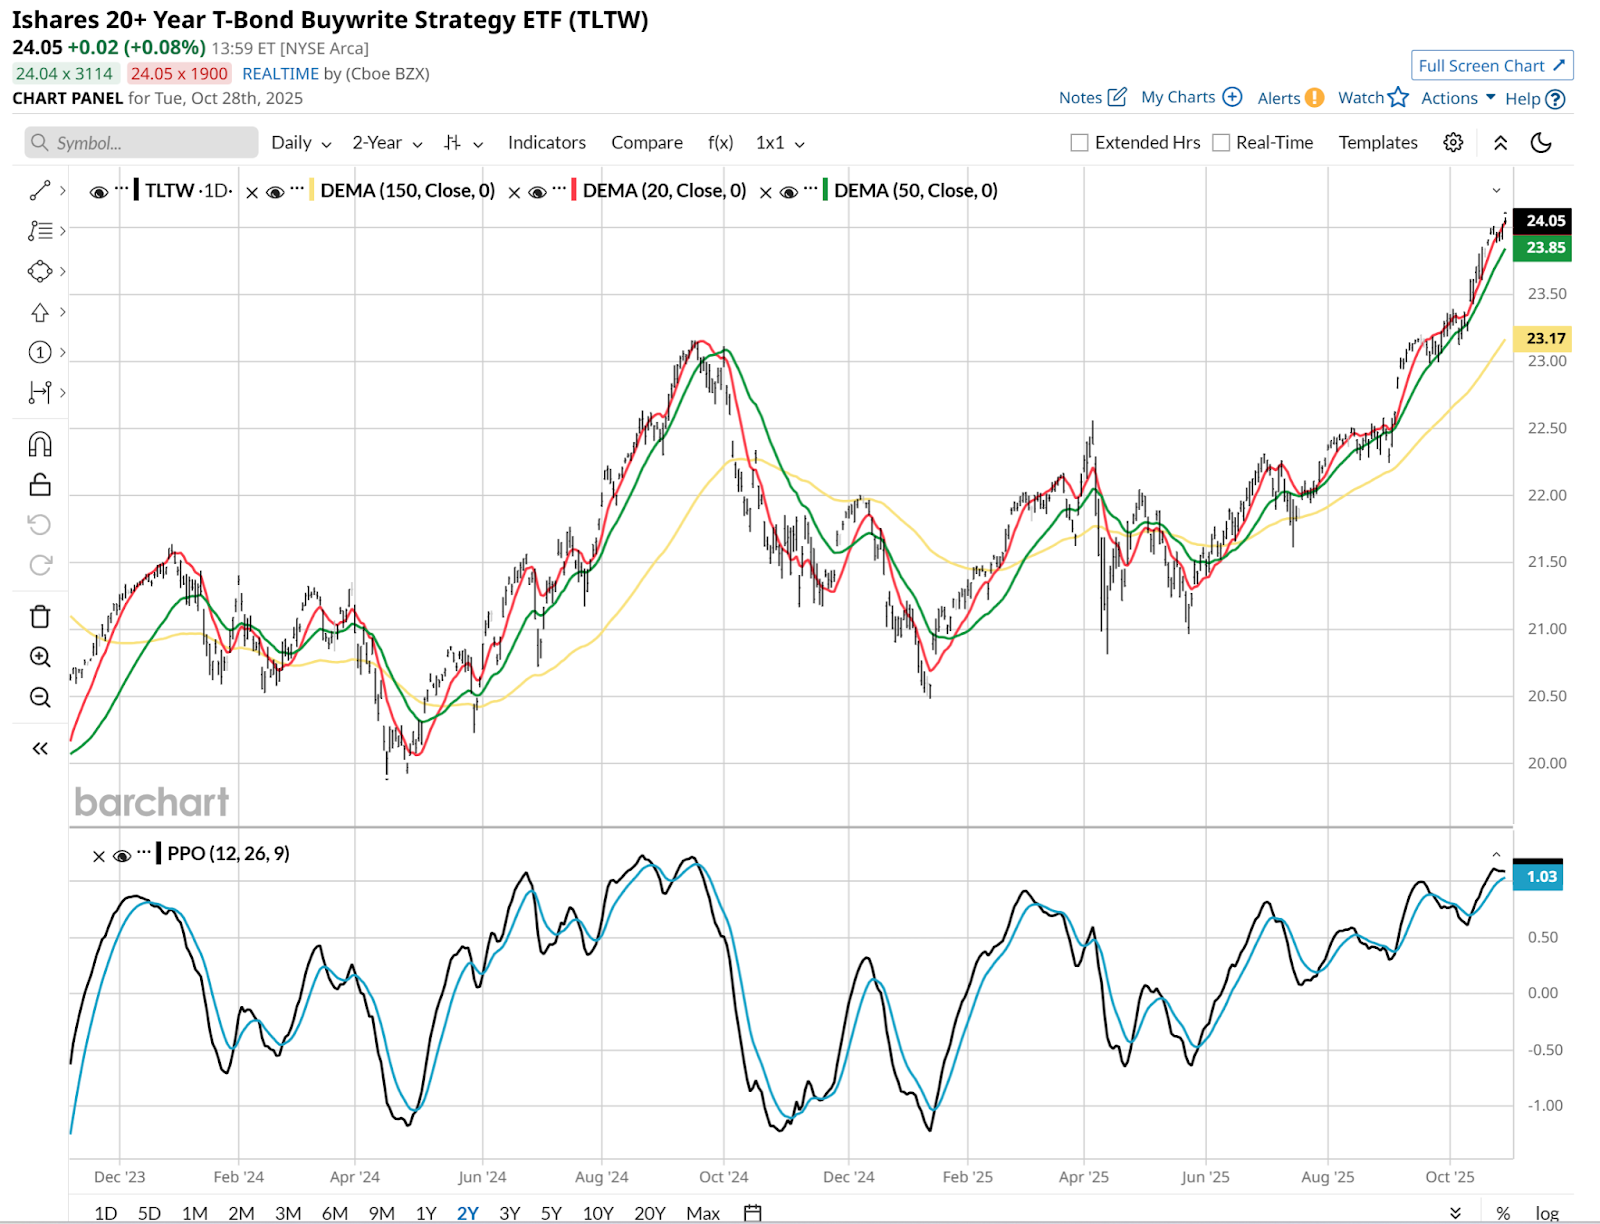
Here’s TLTW’s chart. It shows that while that big yield has helped it grow, price shocks from rising long-term bond rates are its kryptonite. Can we do anything about that, if we are willing to sacrifice some of that huge income yield for less price risk? Yes we can! If we are careful.
Using TLTW with a “Hedge” to Create High Income and Lower Price Risk
While my own personal position is a helpful example, I do not intend for it to be advice in any way. Everyone’s situation is different. But this table should help investors think for themselves about potential uses of TLTW.
First we see TLTW and TLT. TLTW includes TLT, and has that impressive yield. But as I’ve done with several covered call ETFs including TLTW, I pair it with an inverse ETF that is close to or precisely invested the same way that the underlying income ETF is. Except, in reverse.
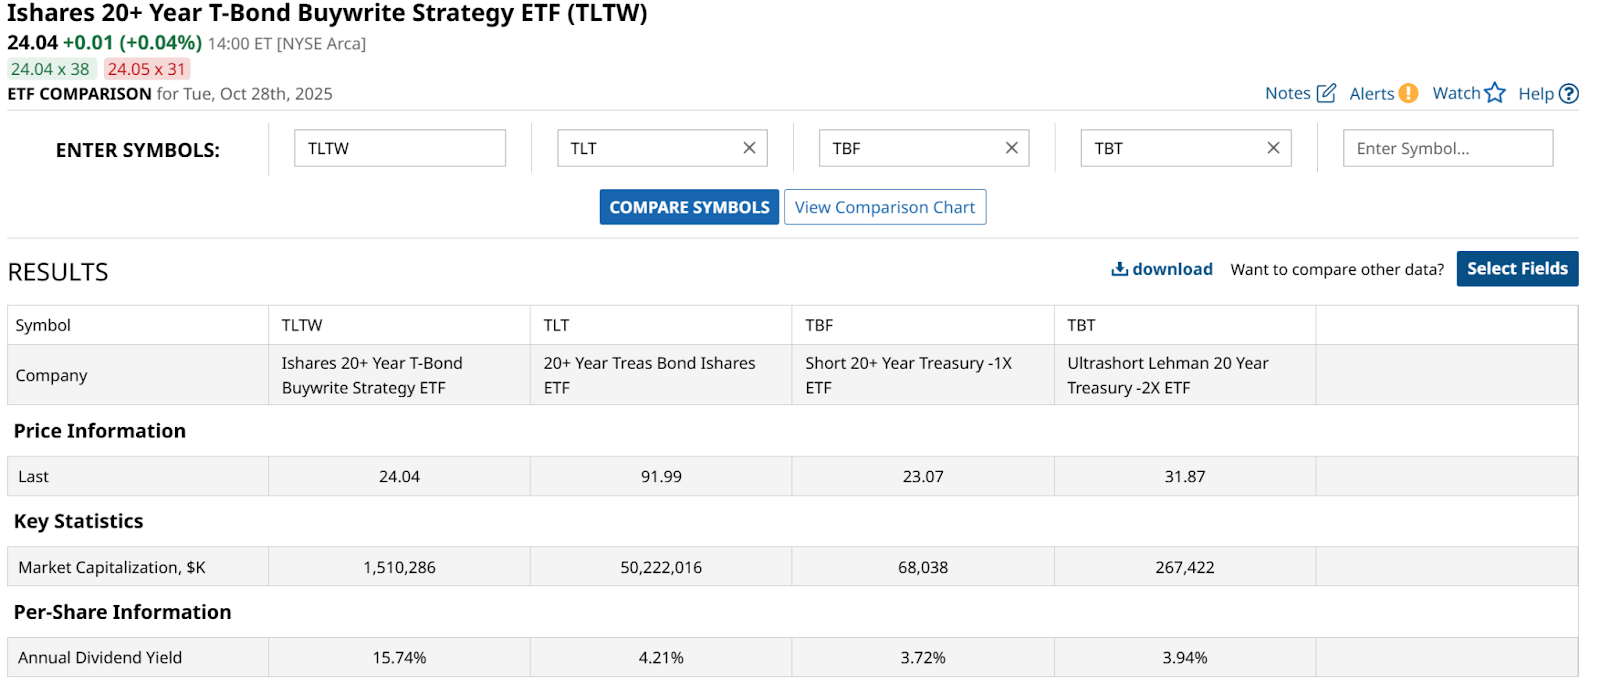
Here’s what that means in the case of TLTW. Those two additional ETFs (TBF) and (TBT) noted to the right of TLT each do the same thing. They move opposite TLT. So when rates rise, they rise in value. When long-term rates fall, they fall in value… as TLTW rises. The main difference between them is as noted: one is just a short ETF versus TLT in -1:1 format, while the other uses leverage to create a -2:1 relationship with TLT.
NOTE: Inverse ETFs are managed one day at a time, so keep in mind the math of investing loss when they go down. It takes more gain to offset the loss, so these are trading vehicles, not long-term investments.
My specific current position, which I trade according to my perception of the risk of TLT over time, is as follows: 90% in TLTW, and 10% in TBT. The net effect is that I get 90% of TLTW’s big yield, but reduce the impact of price declines in TLTW due to TLT dropping in price (if long-term bond rates rise). It doesn’t offset all of it at that ratio of 9:1 TLTW to TBT, but it makes a difference.
And, when I believe from my chart work that rates are a big risk to fly higher, I can gently increase that TBT position and reduce the TLTW, to protect more price while temporarily earning less net yield.
Note that even the hedging (TBT or TBF if used instead) produces some income. Inverse ETFs are built using a lot of T-bills as their base, so there’s some yield inflow from there.
This is not for everyone. It is essentially covered-call ETF arbitrage. I have found it to be highly effective, and I’ve done forms of this for many years.
However, it is something traders should learn to do with precision, and in small size, unless or until they truly master it. If you ask me, I’d say it is worth the time and effort to see if you can.
Rob Isbitts, founder of Sungarden Investment Publishing, is a semi-retired chief investment officer, whose current research is found here at Barchart, as well as on Substack.
On the date of publication, Rob Isbitts did not have (either directly or indirectly) positions in any of the securities mentioned in this article. All information and data in this article is solely for informational purposes. For more information please view the Barchart Disclosure Policy here.
More news from Barchart


