Among the most challenging aspects of the options market is that the ecosystem is structured as a multiverse. Rather than being viewed as an abstract battle of wits between bulls and bears, it’s actually more helpful to consider the derivatives arena as an insurance marketplace. Essentially, traders are pricing for both downside and upside risk relative to their position. This transactional structuring is visually represented by the volatility skew.
Definitionally, the skew is a screener that identifies implied volatility (IV) — or the expected movement of the target security — across the strike price spectrum of a given options chain. IV is the heart of the skew as it’s a statistic derived from actual order flows rather than a purely random or theoretical manifestation. Fundamentally, if risk pricing were perfectly neutral, the skew would be flat. Of course, real life is far more dynamic.
Under normal circumstances — especially for heavily traded stocks — traders’ collective transactions will distort surface area of the volatility space. This distortion effectively signals the bias that smart money traders have when insuring against volatility risk. For example, if traders perceive a non-trivial probability of upside, call IV could be noticeably elevated on the right boundaries (toward rising strike prices).
On the other hand, if traders fear corrective pressure, put IV could rise on the left side to protect against tail risk. How the volatility skew is distorted provides key intel to retail traders, who can then pivot to other methodologies to help narrow pricing uncertainty. Ultimately, the goal is to make the probability space as small as possible to facilitate more informed trading decisions.
To be clear, the smart money is transactionally sophisticated, not necessarily prescient. Insights gathered from the volatility skew should serve as a springboard toward additional analysis. Here, we’ll discuss how to integrate some of the top assets from Barchart Premier into a cohesive trading strategy.
Target (TGT)
We’ll jump right into the thick of things with big-box retailer Target (TGT). After a rough period where TGT stock lost more than 38% of value over the past five years, the retail icon is on a comeback trail. Since the beginning of January, TGT has moved up more than 19%, earning it a 96% Strong Buy rating from the Barchart Technical Opinion indicator.
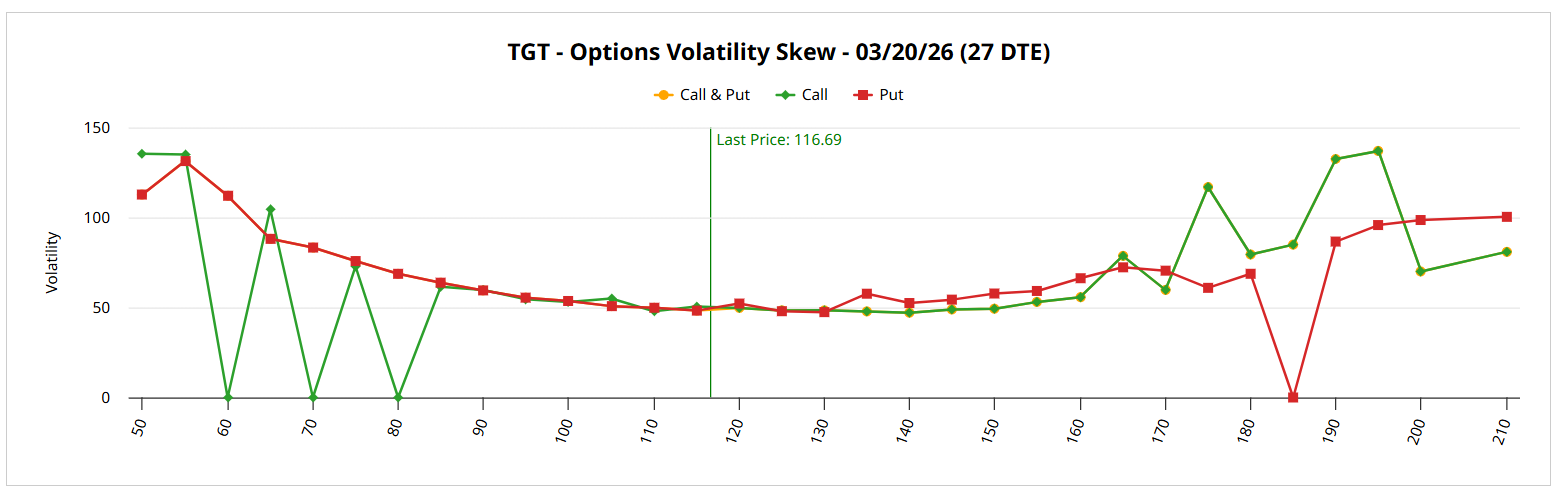
That’s all fine and well but what’s really striking is the volatility skew. For the March 20 expiration date, TGT stock enjoys a relatively normal surface-area distortion. For example, in the strikes near the spot price, the skew is relatively flat and calm, with the IV spread between calls and puts being extremely tight. This setup indicates little urgency among smart money traders to aggressively hedge the strikes likely to be triggered due to close proximity.
If anything, heightened call IV for certain upper strikes indicates a non-trivial perception of upside movement for TGT stock. As such, a bullish trade may make sense.
Notably, the Black-Scholes-derived Expected Move calculator spits out an anticipated dispersion between $106.11 and $127.27 for the March 20 expiration date. Using a mathematical algorithm incorporating the aforementioned IV stats, the dispersion reflects the realistic range of price outcomes.
The question that everyone has, though, is where in the projected range is TGT stock likely to land? For that, we can turn to Barchart’s Seasonal Returns, which provides month-by-month context for publicly traded securities. Since March represents one of the more solid-performing months for Target, we may reasonably speculate on a bullish strategy.
One idea may be to consider the 120/125 bull call spread expiring March 20. Here, the $125 strike is aggressive but falls inside the Expected Move’s maximal dispersion.
Apple (AAPL)
Another intriguing name on the radar is consumer tech giant Apple (AAPL). Amid fears of a bubble brewing in artificial intelligence, AAPL stock hasn’t enjoyed the strongest start to the new year, down about 3%. Barchart Technical Opinion gives Apple some love but barely, rating it a 16% Weak Buy. Still, there might be a contrarian opportunity waiting in the wings.
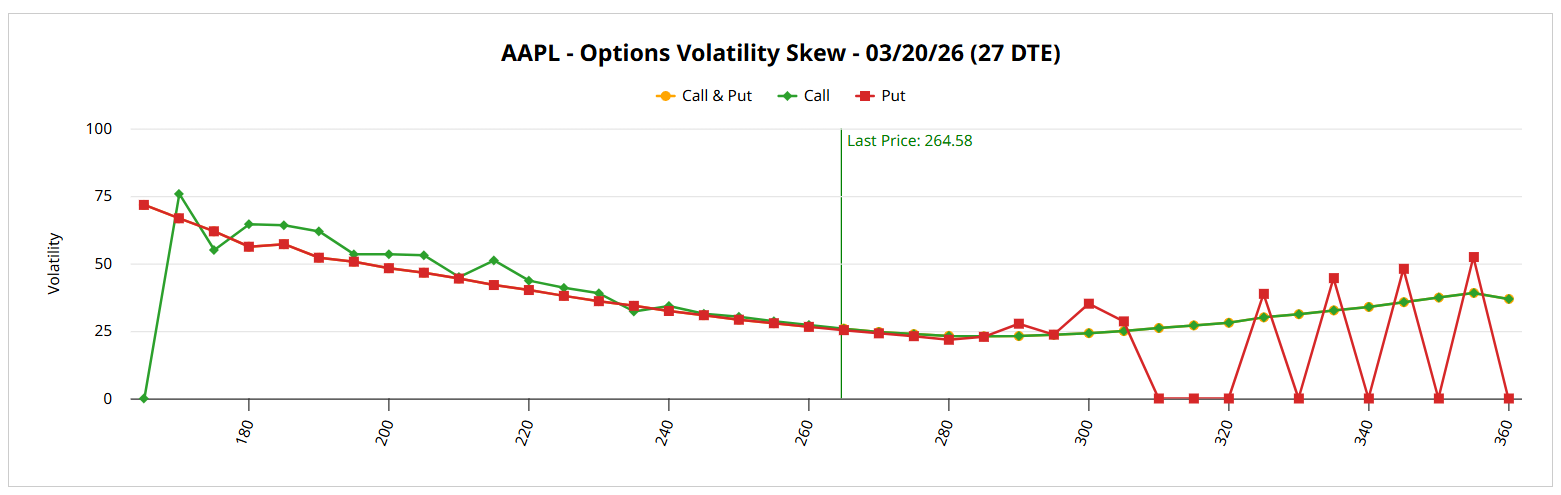
What’s enticing about AAPL stock is its volatility skew, particularly for the March 20 expiration date. First off, there’s no real urgency for the strike prices that are most likely to be affected due to close proximity to spot. Around this area, the skew is relatively calm, suggesting no robust hedging either way. It’s on the edges that things get intriguing.
On the left boundaries, the skew rises to about an IV level of 75%. That’s conspicuously higher than the peak skew on the right side, which peaks around 50%. Basically, the net prioritization among smart money traders is to protect against downside tail risk. But because of this prioritization, call options could be relatively cheap on a volatility basis.
Looking at Expected Move, we find a dispersion between $252.17 and $276.99 for the March 20 expiration date. As is the case with Target, we don’t know where in the dispersion AAPL stock is likely to land. To get a better understanding, we can turn to Seasonal Returns, which points out that March tends to be one of the stronger months for Apple.
I’m really tempted by the 270/275 bull call spread expiring March 20. The $275 strike falls inside the maximal dispersion yet the maximum payout stands at a hefty 150%. As mentioned earlier, that’s partially a function of the smart money distorting the skew toward downside protection, thus making calls relatively cheaper.
Oracle (ORCL)
Last on my list is Oracle (ORCL). If Apple was struggling a bit from AI bubble fears, Oracle is practically in free-fall mode. Since the start of the year, ORCL stock slipped just a hair over 24%. In the past six months, the security dipped more than 36%. Ignominiously (but to no one’s surprise), ORCL received the label 100% Strong Sell from the Barchart Technical Opinion indicator.
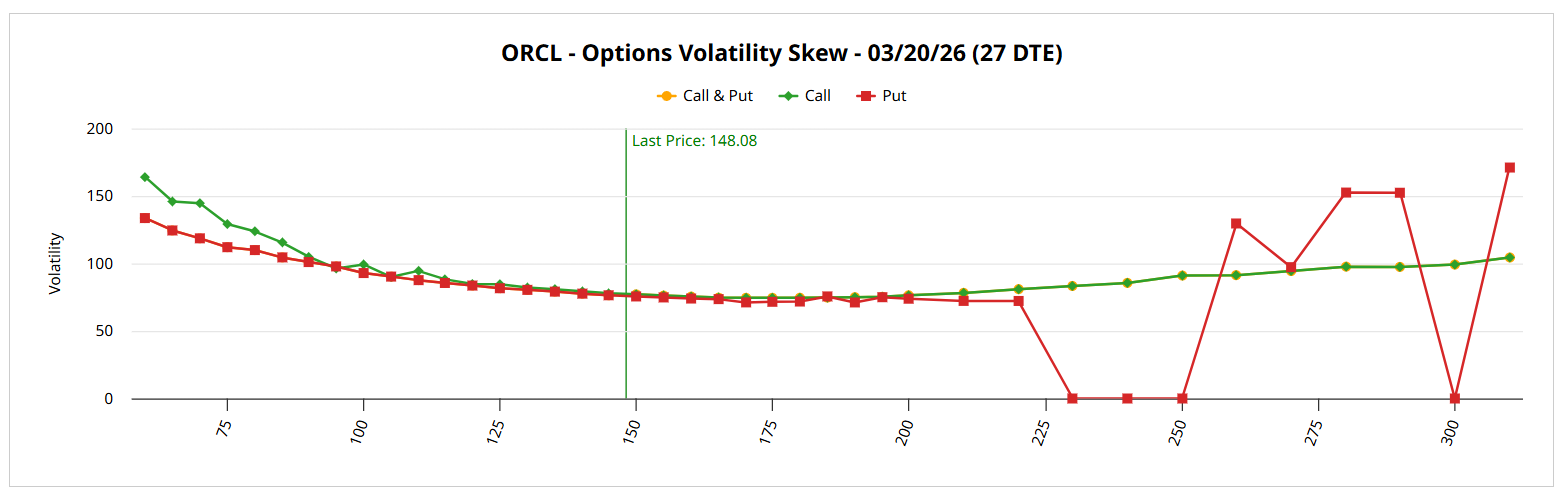
For me, ORCL stock may represent a case of information by omission. When you look at the volatility skew for the March 20 expiration date, you won’t find what you would typically expect from a badly stumbling security: panicked hedging. For strikes near the spot price, the skew is quite calm and flat, indicating no real urgency to protect against corrective pressure on strikes that are likely to be triggered due to proximity.
Yes, the skew generally does rise higher on the left side than the right, indicating that the net priority may be protecting against tail risk. Still, the posture is controlled, meaning that the hedging is not unusual for a security of this nature.
The Expected Move dispersion calls for ORCL stock to range between $127.11 and $169.06 for the March 20 expiration date. Looking at Seasonal Returns, March tends to be one of the more solid months for Oracle. Again, a bullish strategy seems to be more statistically likely.
I’m looking at the 155/160 bull call spread expiring March 20, which features a maximum payout of over 138%.
On the date of publication, Josh Enomoto did not have (either directly or indirectly) positions in any of the securities mentioned in this article. All information and data in this article is solely for informational purposes. For more information please view the Barchart Disclosure Policy here.
More news from Barchart
- The Saturday Spread: Using Volatility Skew as a Smart Money Gauge (TGT, AAPL, ORCL)
- Unusual Options Activity Alert: If You Own These 3 Stocks, It’s Time for a Protective Collar
- Palo Alto Networks Stock Has Tanked But Its Free Cash Flow is Strong - Time to Buy PANW?
- 3 Steps to a Simple Trading System