

Insurance distribution company Baldwin Insurance Group (NASDAQ: BWIN) reported Q3 CY2025 results beating Wall Street’s revenue expectations, with sales up 7.8% year on year to $365.4 million. Its non-GAAP profit of $0.31 per share was in line with analysts’ consensus estimates.
Is now the time to buy Baldwin Insurance Group? Find out by accessing our full research report, it’s free for active Edge members.
Baldwin Insurance Group (BWIN) Q3 CY2025 Highlights:
- Revenue: $365.4 million vs analyst estimates of $362 million (7.8% year-on-year growth, 0.9% beat)
- Adjusted EPS: $0.31 vs analyst estimates of $0.31 (in line)
- Adjusted EBITDA: $72.52 million vs analyst estimates of $71.59 million (19.8% margin, 1.3% beat)
- Operating Margin: 0.9%, down from 4.5% in the same quarter last year
- Free Cash Flow Margin: 8.8%, up from 6.6% in the same quarter last year
- Organic Revenue rose 4.5% year on year vs analyst estimates of 5.5% growth (92.1 basis point miss)
- Market Capitalization: $1.71 billion
“Our third quarter results reflect our ability to execute in a dynamic operating environment. Overall organic growth was 5% for the quarter, bringing year-to-date organic growth to 9%,” said Trevor Baldwin, Chief Executive Officer of The Baldwin Group.
Company Overview
Rebranded from BRP Group in May 2024, Baldwin Insurance Group (NASDAQ: BWIN) is an independent insurance distribution company that provides tailored insurance, risk management, and employee benefits solutions to businesses and individuals.
Revenue Growth
Reviewing a company’s long-term sales performance reveals insights into its quality. Any business can experience short-term success, but top-performing ones enjoy sustained growth for years.
With $1.49 billion in revenue over the past 12 months, Baldwin Insurance Group is a mid-sized business services company, which sometimes brings disadvantages compared to larger competitors benefiting from better economies of scale. On the bright side, it can still flex high growth rates because it’s working from a smaller revenue base.
As you can see below, Baldwin Insurance Group’s 48.2% annualized revenue growth over the last five years was incredible. This is a great starting point for our analysis because it shows Baldwin Insurance Group’s demand was higher than many business services companies.
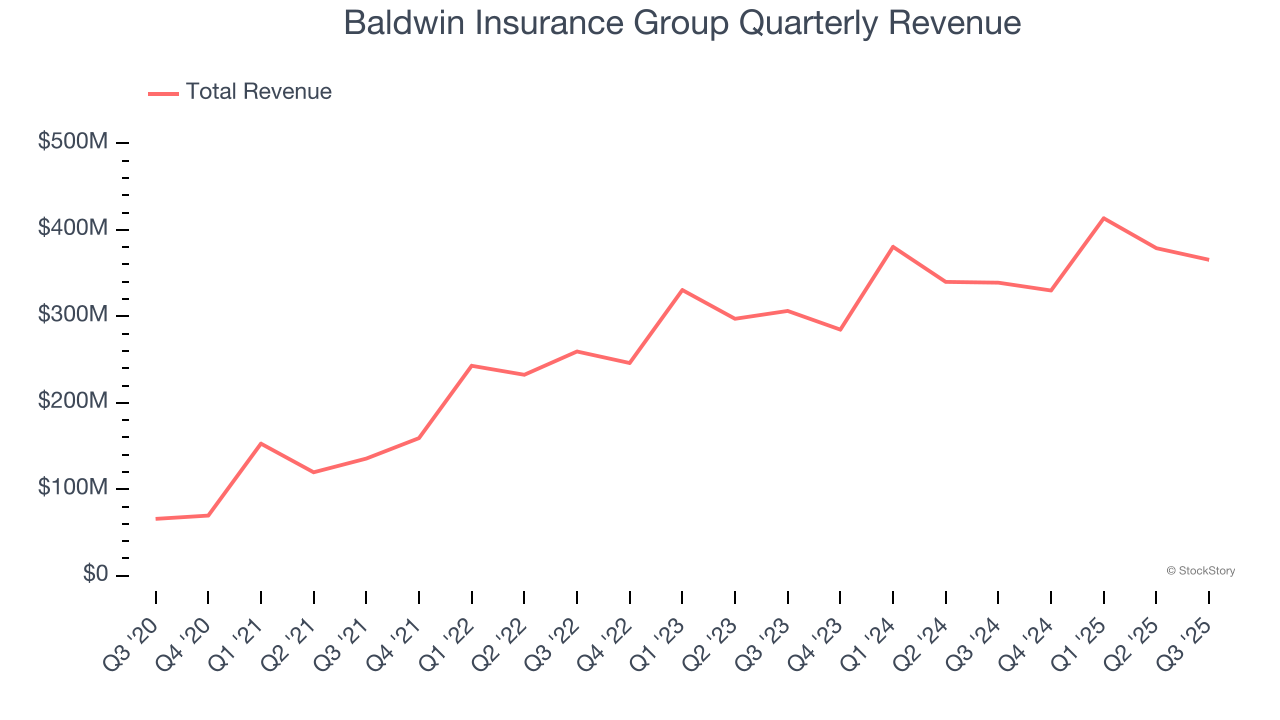
We at StockStory place the most emphasis on long-term growth, but within business services, a half-decade historical view may miss recent innovations or disruptive industry trends. Baldwin Insurance Group’s annualized revenue growth of 12.3% over the last two years is below its five-year trend, but we still think the results suggest healthy demand. 
We can dig further into the company’s sales dynamics by analyzing its organic revenue, which strips out one-time events like acquisitions and currency fluctuations that don’t accurately reflect its fundamentals. Over the last two years, Baldwin Insurance Group’s organic revenue averaged 13.5% year-on-year growth. Because this number aligns with its two-year revenue growth, we can see the company’s core operations (not acquisitions and divestitures) drove most of its results. 
This quarter, Baldwin Insurance Group reported year-on-year revenue growth of 7.8%, and its $365.4 million of revenue exceeded Wall Street’s estimates by 0.9%.
Looking ahead, sell-side analysts expect revenue to grow 17.2% over the next 12 months, an improvement versus the last two years. This projection is eye-popping and suggests its newer products and services will fuel better top-line performance.
Software is eating the world and there is virtually no industry left that has been untouched by it. That drives increasing demand for tools helping software developers do their jobs, whether it be monitoring critical cloud infrastructure, integrating audio and video functionality, or ensuring smooth content streaming. Click here to access a free report on our 3 favorite stocks to play this generational megatrend.
Adjusted Operating Margin
Baldwin Insurance Group was roughly breakeven when averaging the last five years of quarterly operating profits, inadequate for a business services business.
On the plus side, Baldwin Insurance Group’s adjusted operating margin rose by 7.1 percentage points over the last five years, as its sales growth gave it immense operating leverage.
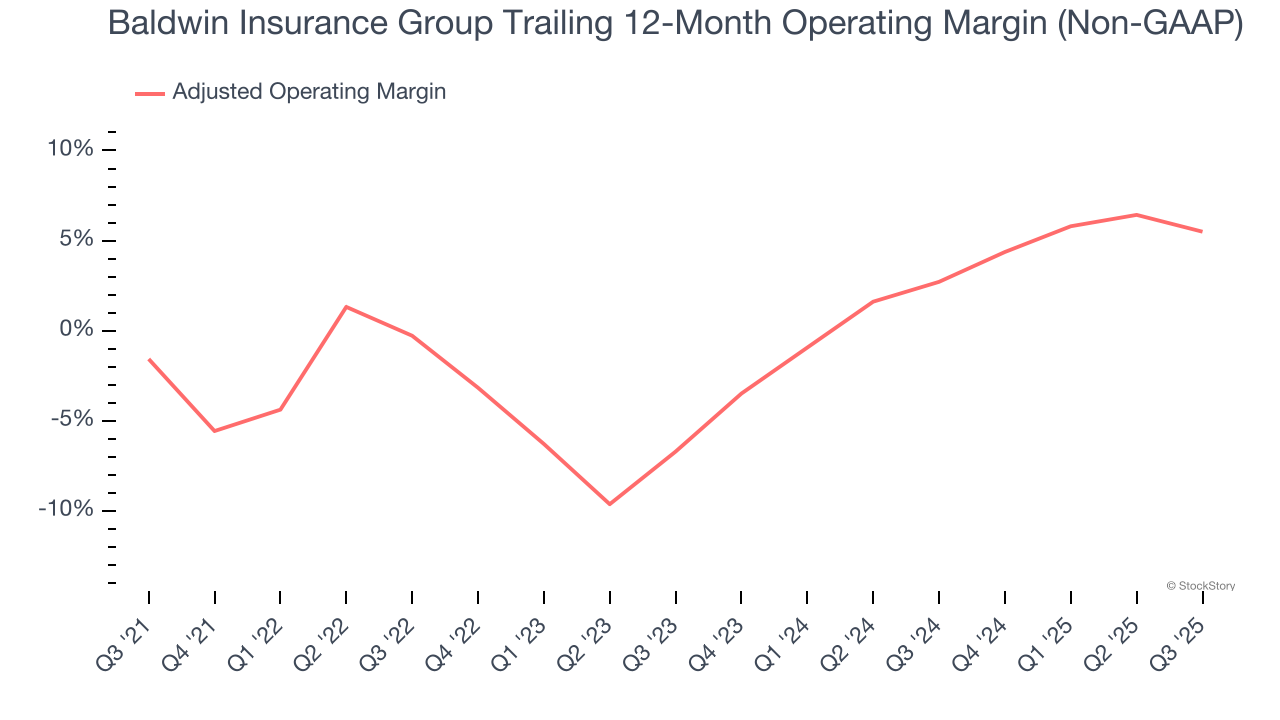
In Q3, Baldwin Insurance Group’s breakeven margin was down 3.7 percentage points year on year. This contraction shows it was less efficient because its expenses grew faster than its revenue.
Earnings Per Share
Revenue trends explain a company’s historical growth, but the long-term change in earnings per share (EPS) points to the profitability of that growth – for example, a company could inflate its sales through excessive spending on advertising and promotions.
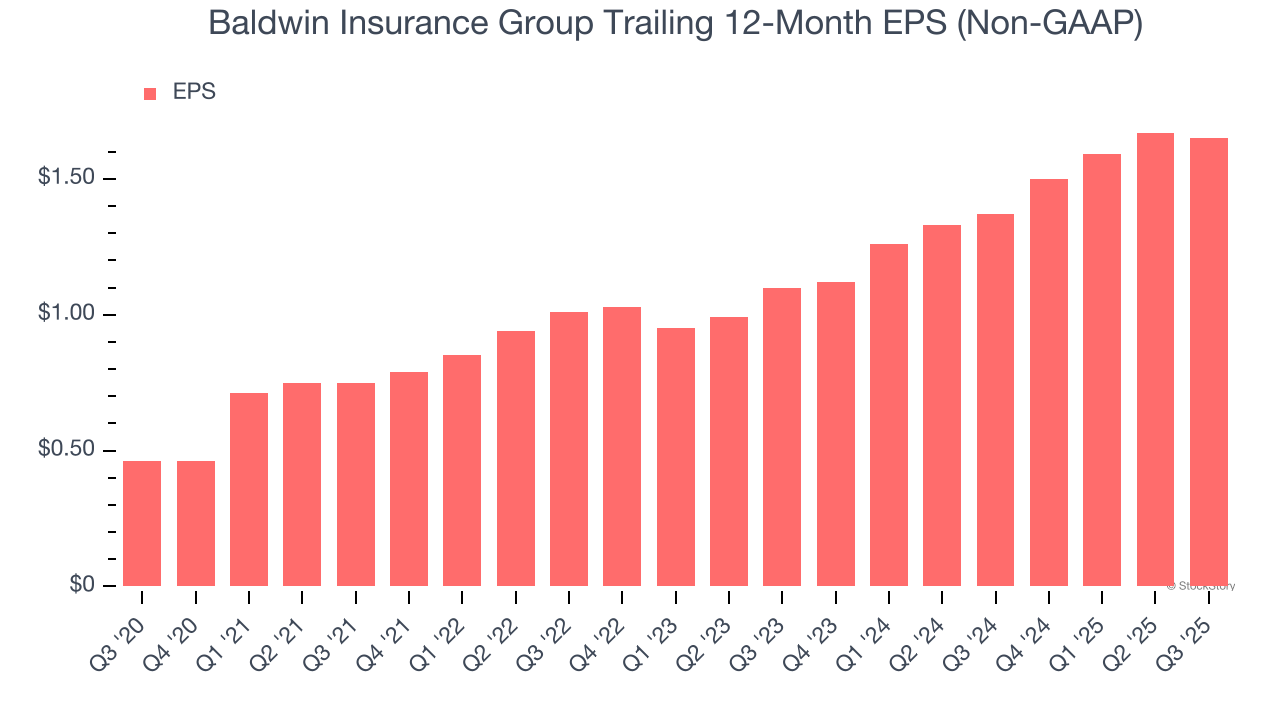
Baldwin Insurance Group’s EPS grew at an astounding 29.1% compounded annual growth rate over the last five years. Despite its adjusted operating margin improvement during that time, this performance was lower than its 48.2% annualized revenue growth, telling us that non-fundamental factors such as interest and taxes affected its ultimate earnings.
Diving into Baldwin Insurance Group’s quality of earnings can give us a better understanding of its performance. A five-year view shows Baldwin Insurance Group has diluted its shareholders, growing its share count by 107%. This dilution overshadowed its increased operational efficiency and has led to lower per share earnings. Taxes and interest expenses can also affect EPS but don’t tell us as much about a company’s fundamentals.
Like with revenue, we analyze EPS over a shorter period to see if we are missing a change in the business.
For Baldwin Insurance Group, its two-year annual EPS growth of 22.5% was lower than its five-year trend. We still think its growth was good and hope it can accelerate in the future.
In Q3, Baldwin Insurance Group reported adjusted EPS of $0.31, down from $0.33 in the same quarter last year. This print was close to analysts’ estimates. Over the next 12 months, Wall Street expects Baldwin Insurance Group’s full-year EPS of $1.65 to grow 16.6%.
Key Takeaways from Baldwin Insurance Group’s Q3 Results
It was good to see Baldwin Insurance Group narrowly top analysts’ revenue expectations this quarter. On the other hand, its organic revenue slightly missed and its EPS was in line with Wall Street’s estimates. Overall, this was a softer quarter. The stock remained flat at $23.73 immediately after reporting.
Is Baldwin Insurance Group an attractive investment opportunity at the current price? We think that the latest quarter is only one piece of the longer-term business quality puzzle. Quality, when combined with valuation, can help determine if the stock is a buy. We cover that in our actionable full research report which you can read here, it’s free for active Edge members.


