Engineering and automation solutions company Emerson (NYSE: EMR) reported calendar Q3 2026 (fiscal Q4 2026) results exceeding the market’s revenue expectations, with revenue up 7.1% year on year to $5.2 billion. On the other hand, next quarter’s revenue guidance of $4.56 billion was less impressive, coming in 0.7% below analysts’ consensus estimates. Its non-GAAP profit of $1.86 per share was in line with analysts’ consensus estimates.
For more on Emerson Electric, read our free full research report.
Emerson Electric (EMR) Q3 CY2026 highlights:
- Revenue $5.2 billion vs S&P analysts’ consensus estimates of $5.12 billion (7.1% year-on-year growth, 1.6% beat)
- Adjusted EPS $1.86 vs S&P analysts’ consensus estimates of $1.85 (in line)
- Revenue guidance $4.56 billion at the midpoint for Q4 CY2026, below analysts’ consensus estimates of $4.6 billion
- Adjusted EPS guidance $7.25 at the midpoint for fiscal 2027, in line with analysts’ consensus estimates
- Operating margin 20.6%, down from 37.3% in the same quarter last year
- Free cash flow margin 17.6%, similar to the same quarter last year
- Market capitalization $92.81 billion
"Emerson capped a strong 2026 with fourth quarter sales and profitability exceeding expectations," said Emerson President and Chief Executive Officer Lal Karsanbhai. "Underlying orders were up 14%, supported by exceptional long-cycle project activity in our growth verticals. Demand was broad-based, with substantial growth across all business groups and regions."
Revenue growth
A company’s long-term revenue performance is one signal of its overall quality. Any business can experience short-term success, but top-performing ones sustain growth for years. Emerson Electric struggled to consistently increase demand as its $18.98 billion of revenue for the trailing 12 months was close to its revenue five years ago. That was a poor result.
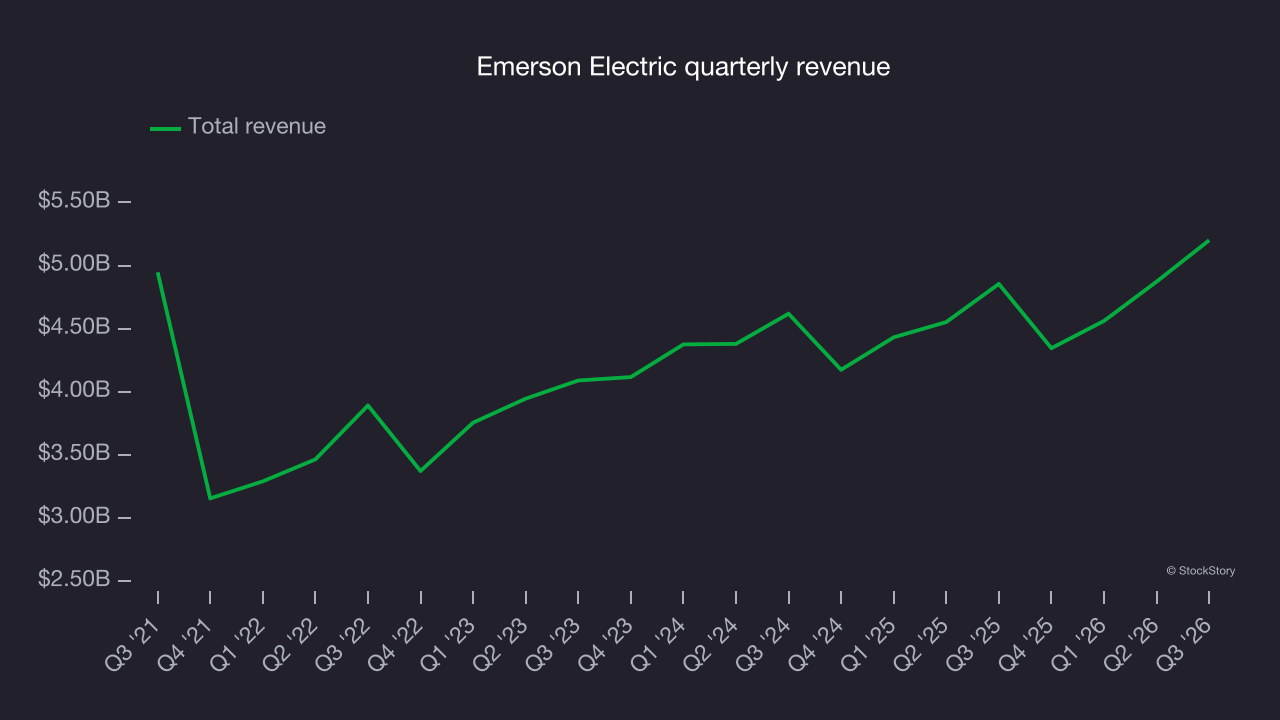
Long-term growth is the most important, but within industrials, a half-decade historical view may miss new industry trends or demand cycles. Emerson Electric’s annualized revenue growth of 4.2% over the last two years is above its five-year trend, a positive sign. 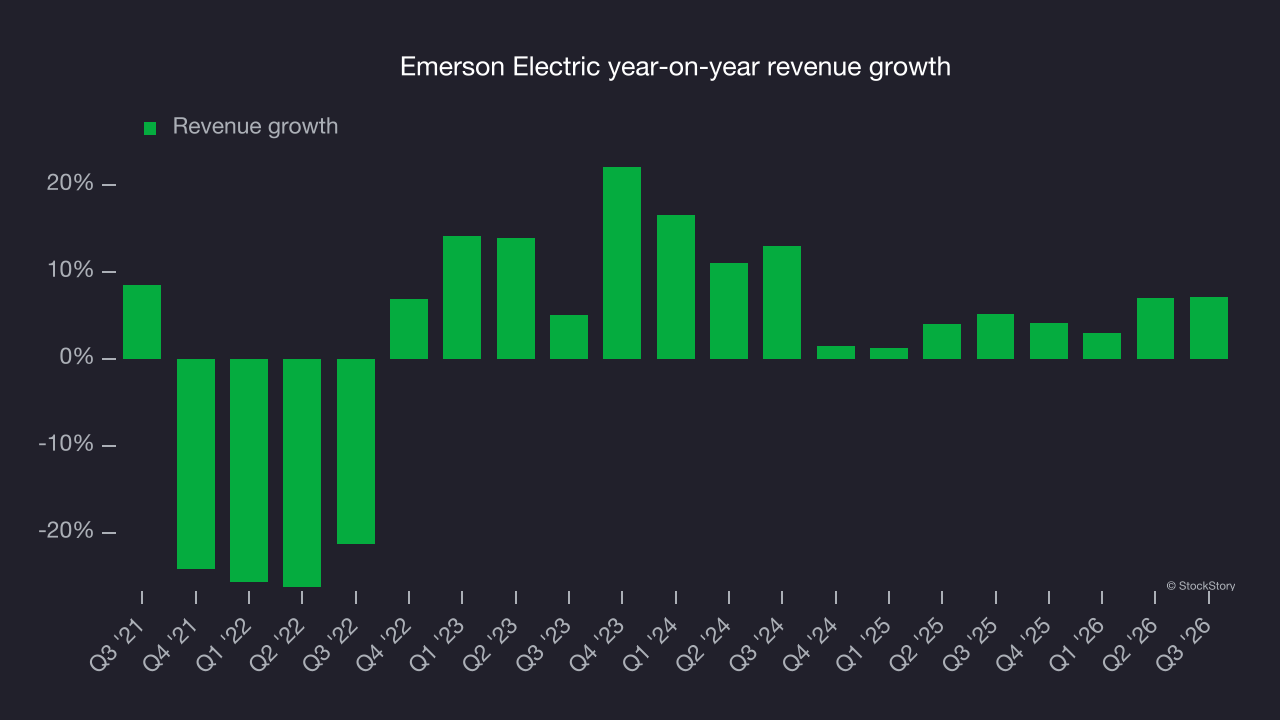
This quarter, Emerson Electric reported year-on-year revenue growth of 7.1%, and its $5.2 billion of revenue exceeded Wall Street’s consensus estimates by 1.6%. Company management is currently guiding for a 5% year-on-year increase in revenue next quarter.
Looking further ahead, sell-side analysts expect revenue to grow 4.9% over the next 12 months, according to S&P, similar to its two-year rate. This projection is underwhelming and suggests its newer products and services will not accelerate its top-line performance yet.
Operating margin
Emerson Electric has operated efficiently over the last five years. It demonstrated high profitability for an industrials business, with an average operating margin of 22.7%. That outcome is unsurprising given its favorable starting point of a high gross margin.
Looking at the trend in its profitability, Emerson Electric’s operating margin rose by 6.3 percentage points over the last five years, showing its efficiency has meaningfully improved.
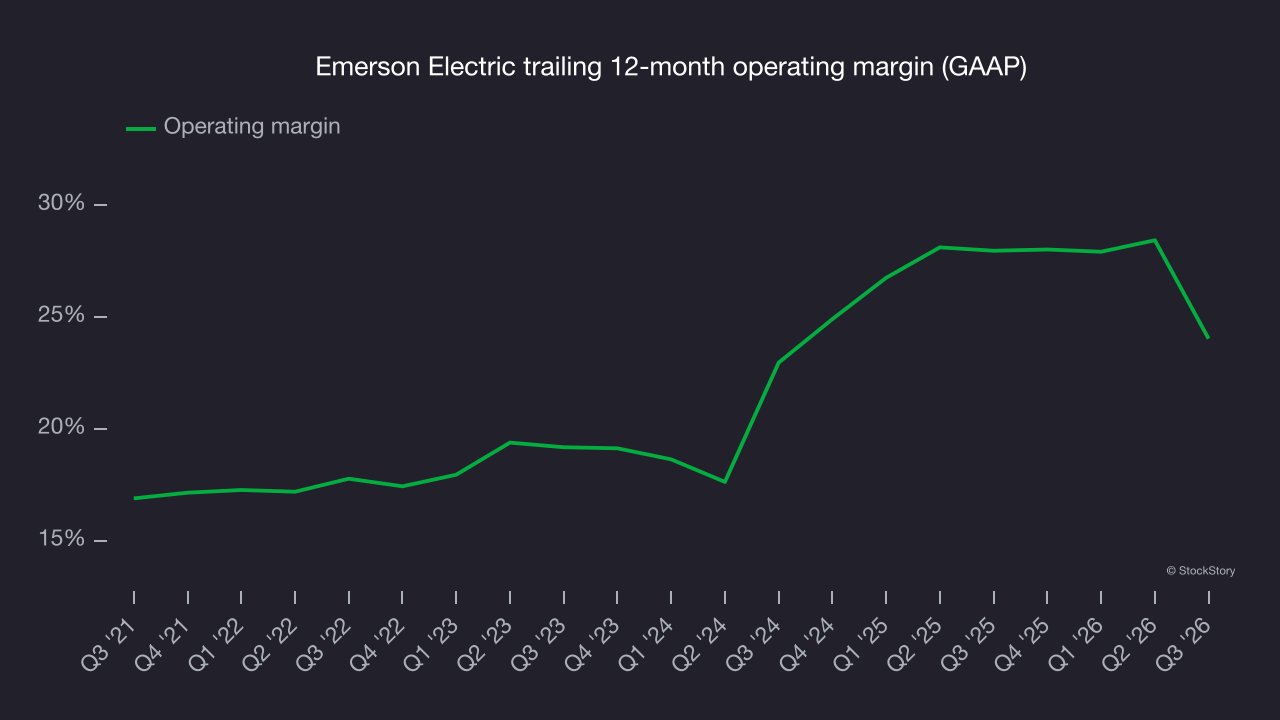
In Q3, Emerson Electric generated an operating margin of 20.6%, down 16.6 percentage points year on year. Its operating margin decreased more than its gross margin, suggesting it was less efficient as expenses such as marketing, R&D and administrative overhead increased.
Earnings per share
Revenue trends explain a company’s historical growth, but the long-term change in earnings per share (EPS) points to the profitability of that growth. For example, a company could inflate its revenue through excessive spending on advertising and promotions.
Emerson Electric’s EPS grew at a 9.9% compounded annual growth rate over the last five years, outpacing its flat revenue. This indicates management responded to softer demand by adapting its cost structure.
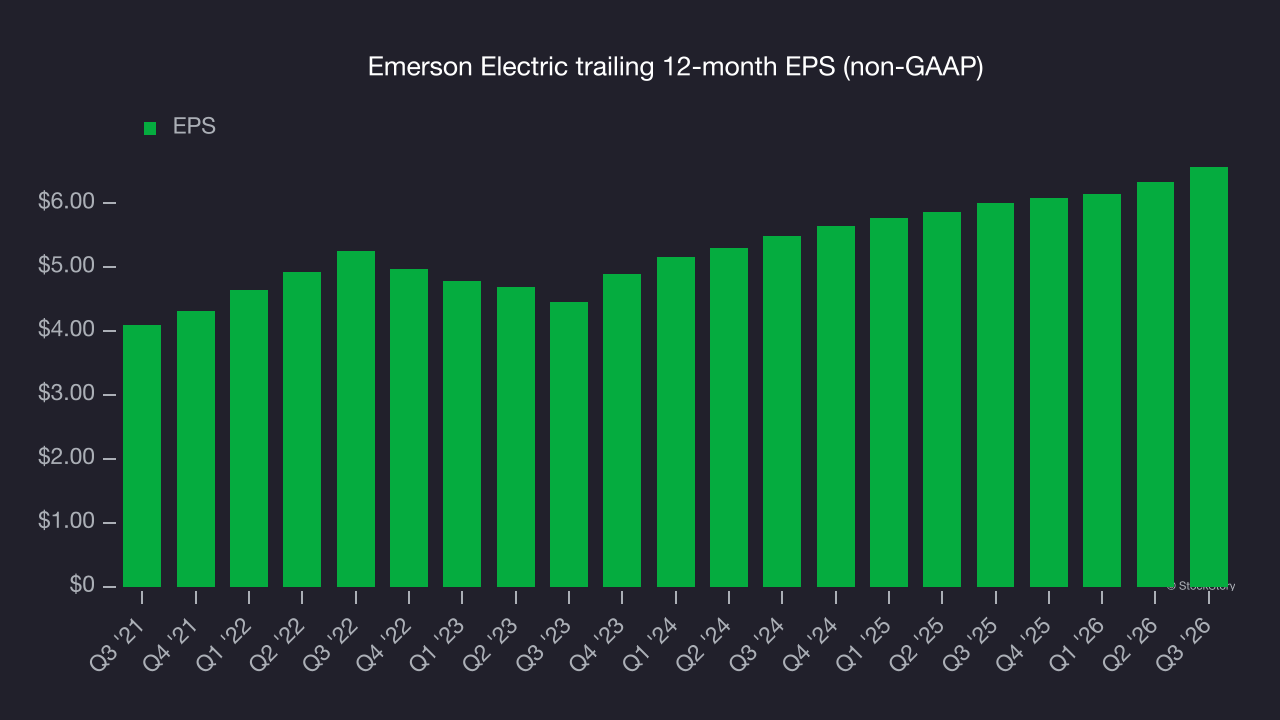
Diving into the nuances of Emerson Electric’s earnings can give us a better understanding of its performance. As noted earlier, Emerson Electric’s operating margin declined this quarter but expanded by 6.3 percentage points over the last five years. Its share count also shrank by 6.8%, and these factors together are positive signs for shareholders because improving profitability and share buybacks boost EPS growth relative to revenue growth. 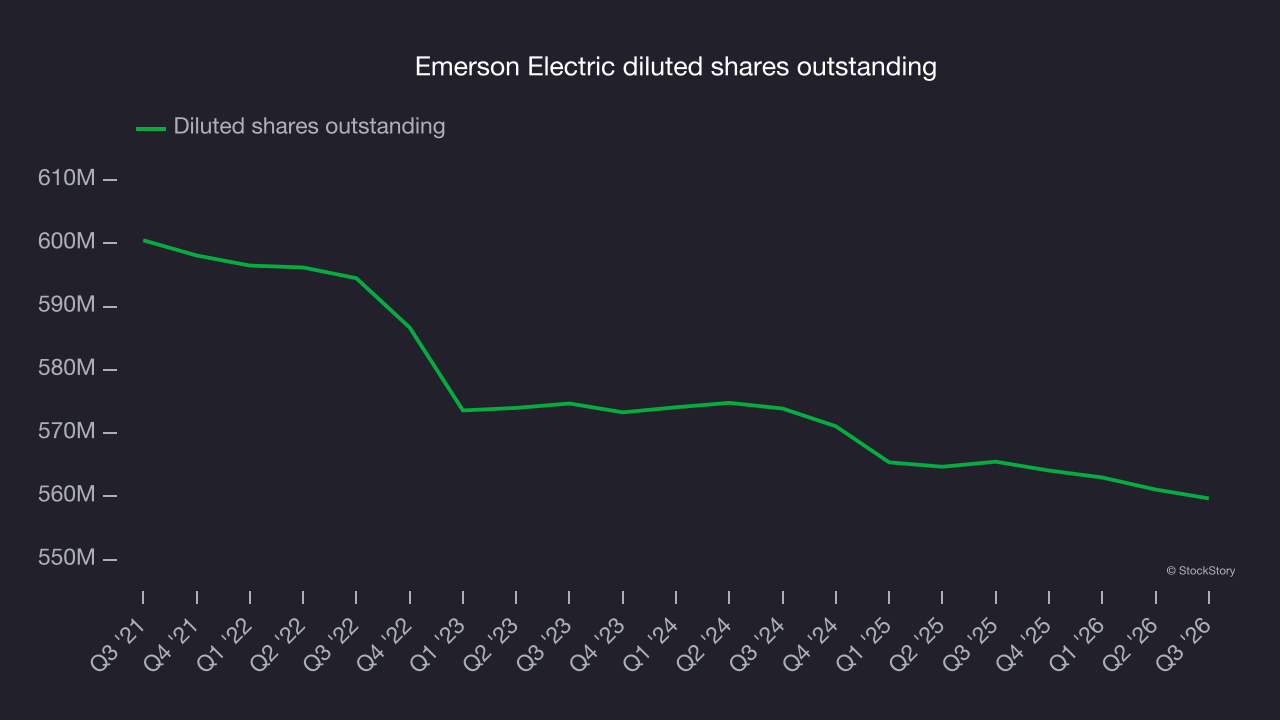
As with revenue, we analyze EPS over a more recent period because it can provide insight into an emerging theme or development for the business.
For Emerson Electric, its two-year annual EPS growth of 9.4% is similar to its five-year trend, implying stable earnings power.
In Q3, Emerson Electric reported adjusted EPS of $1.86, up from $1.62 in the same quarter last year. This result was close to analysts’ consensus estimates. Over the next 12 months, Wall Street expects Emerson Electric’s full-year EPS to grow 10.5% from $6.57 to $7.26, according to S&P.
Key takeaways from Emerson Electric’s Q3 results
Emerson Electric’s revenue beat analysts’ consensus estimates, but its outlook left this a mixed quarter: Both EPS and revenue guidance for next quarter fell slightly short of Wall Street’s consensus. Investors were likely hoping for more, and shares fell 4.4% to $158.93 immediately after the results.
When considering an investment in Emerson Electric, look at the bigger picture of valuation, business qualities and the latest earnings. Read the full research report here (it’s free).