
Online casino and sports betting company Rush Street Interactive (NYSE: RSI) reported Q1 CY2026 results beating Wall Street’s revenue expectations, with sales up 41.1% year on year to $370.4 million. The company’s full-year revenue guidance of $1.52 billion at the midpoint came in 7.5% above analysts’ estimates. Its non-GAAP profit of $0.14 per share was 17.6% above analysts’ consensus estimates.
Is now the time to buy Rush Street Interactive? Find out by accessing our full research report, it’s free.
Rush Street Interactive (RSI) Q1 CY2026 Highlights:
- Revenue: $370.4 million vs analyst estimates of $332.9 million (41.1% year-on-year growth, 11.3% beat)
- Adjusted EPS: $0.14 vs analyst estimates of $0.12 (17.6% beat)
- Adjusted EBITDA: $60.2 million vs analyst estimates of $48.21 million (16.3% margin, 24.9% beat)
- The company lifted its revenue guidance for the full year to $1.52 billion at the midpoint from $1.4 billion, a 8.2% increase
- EBITDA guidance for the full year is $240 million at the midpoint, above analyst estimates of $222.4 million
- Operating Margin: 11.6%, up from 5.6% in the same quarter last year
- Market Capitalization: $2.49 billion
Richard Schwartz, Chief Executive Officer of RSI, said, "We are pleased to report another strong quarter of results, setting new records once again for revenue, net income and adjusted EBITDA.”
Company Overview
Specializing in online casino gaming and sports betting, Rush Street Interactive (NYSE: RSI) is an operator of digital gaming platforms.
Revenue Growth
Examining a company’s long-term performance can provide clues about its quality. Any business can put up a good quarter or two, but many enduring ones grow for years. Over the last five years, Rush Street Interactive grew its sales at a 28.5% annual rate. Though this growth is acceptable on an absolute basis, we need to see more than just topline growth for the consumer discretionary sector, which can display significant earnings volatility. This means our bar for the sector is particularly high, reflecting the non-essential and hit-driven nature of the products and services offered. Additionally, five-year CAGR starts around Covid, when revenue was depressed then rebounded.
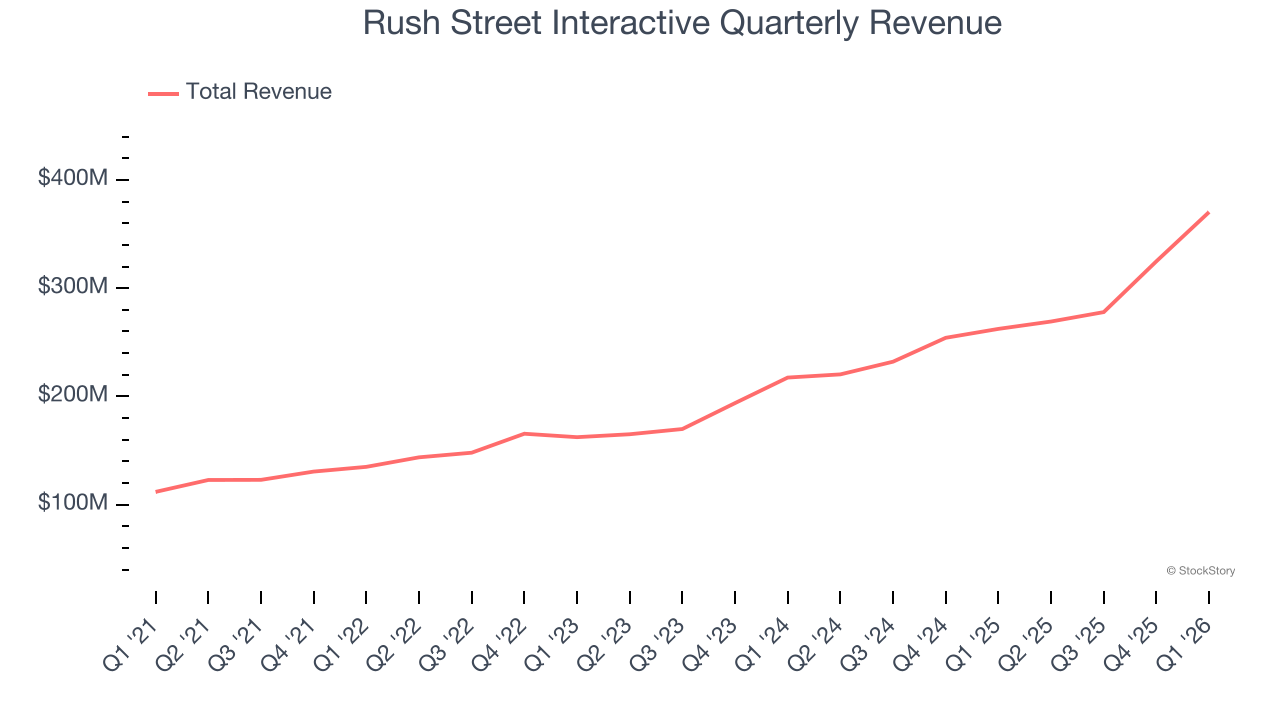
We at StockStory place the most emphasis on long-term growth, but within consumer discretionary, a stretched historical view may miss a company riding a successful new product or trend. Rush Street Interactive’s annualized revenue growth of 29% over the last two years aligns with its five-year trend, suggesting its demand was consistently weak. 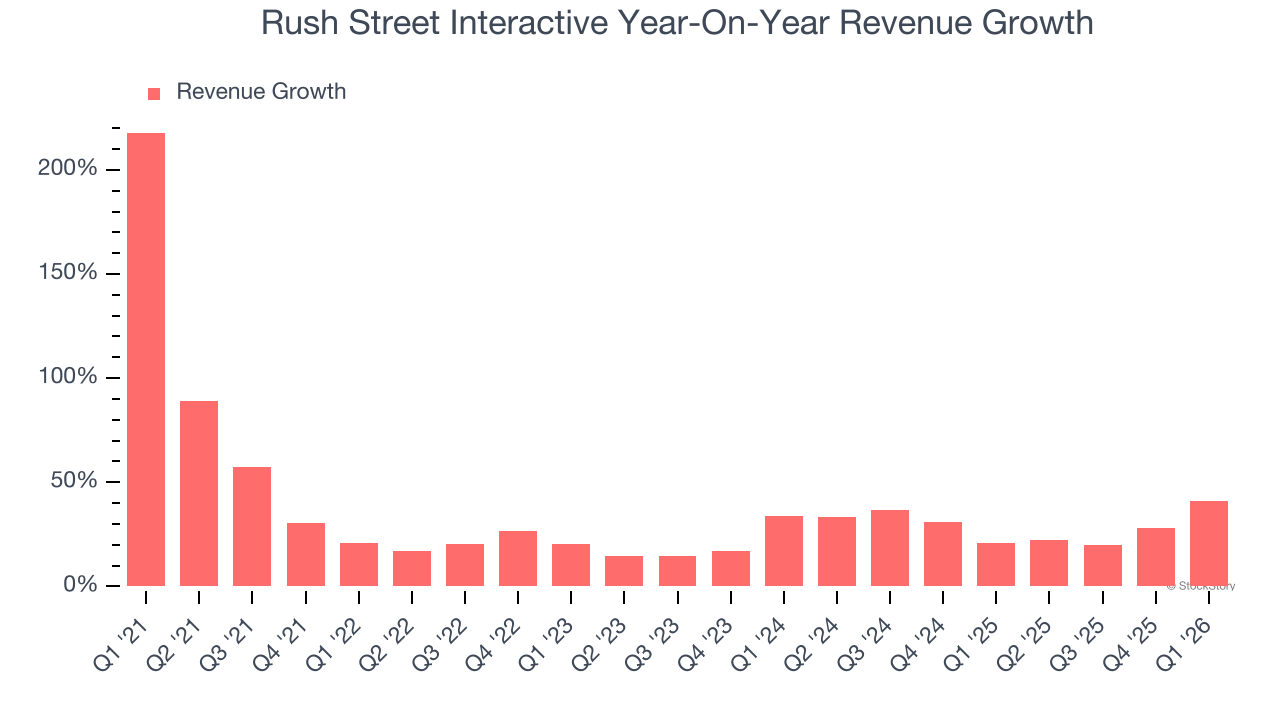
This quarter, Rush Street Interactive reported magnificent year-on-year revenue growth of 41.1%, and its $370.4 million of revenue beat Wall Street’s estimates by 11.3%.
Looking ahead, sell-side analysts expect revenue to grow 18.2% over the next 12 months, a deceleration versus the last two years. Still, this projection is admirable and indicates the market is baking in success for its products and services.
ALSO WORTH WATCHING: Nvidia’s Quiet Partner. Nvidia’s chips cost a hundred grand. The connectors that make them work cost even more. One company makes them all.
Every AI server needs specialized infrastructure the chip companies don’t make. High-speed cables. Power connectors. Thermal sensors. This 90-year-old company built a monopoly on it. The AI boom just started. This stock is still flying under the radar. Claim The Stock Ticker Here for FREE.
Operating Margin
Rush Street Interactive’s operating margin has risen over the last 12 months and averaged 6.9% over the last two years. The company’s higher efficiency is a breath of fresh air, but its suboptimal cost structure means it still sports inadequate profitability for a consumer discretionary business.
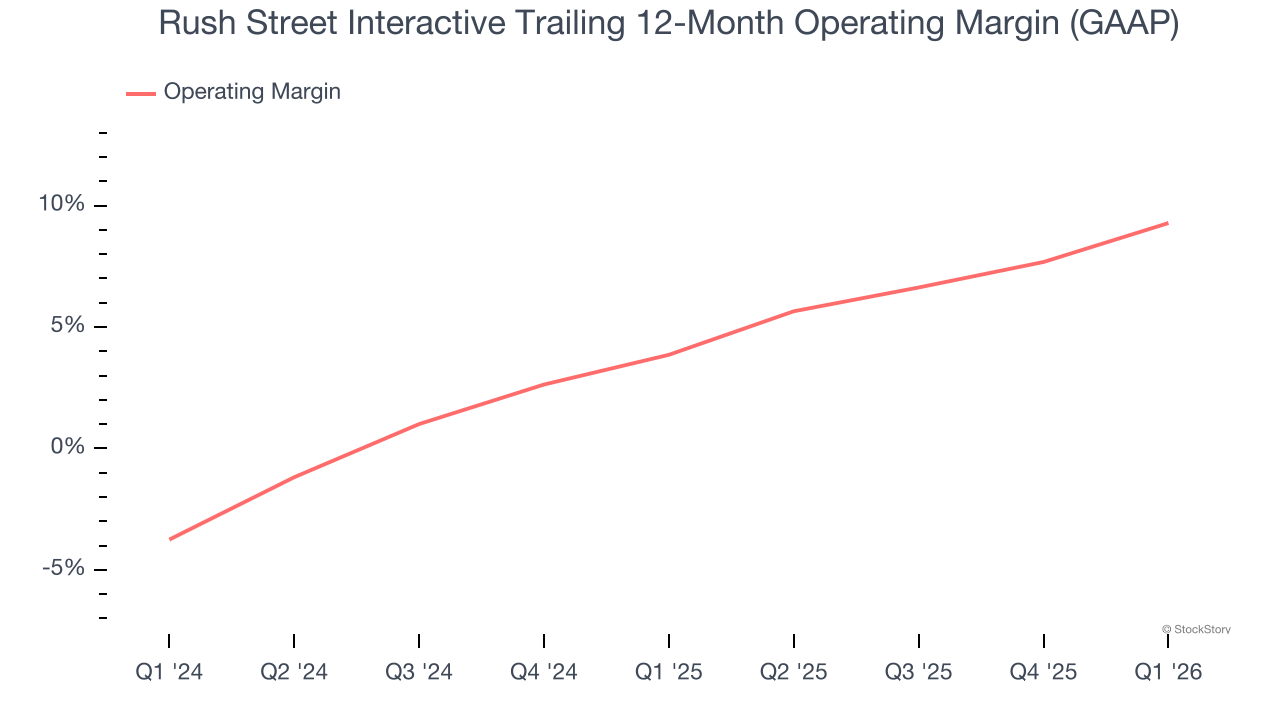
In Q1, Rush Street Interactive generated an operating margin profit margin of 11.6%, up 6 percentage points year on year. This increase was a welcome development and shows it was more efficient.
Earnings Per Share
Revenue trends explain a company’s historical growth, but the long-term change in earnings per share (EPS) points to the profitability of that growth – for example, a company could inflate its sales through excessive spending on advertising and promotions.
Rush Street Interactive’s full-year EPS flipped from negative to positive over the last five years. This is encouraging and shows it’s at a critical moment in its life.
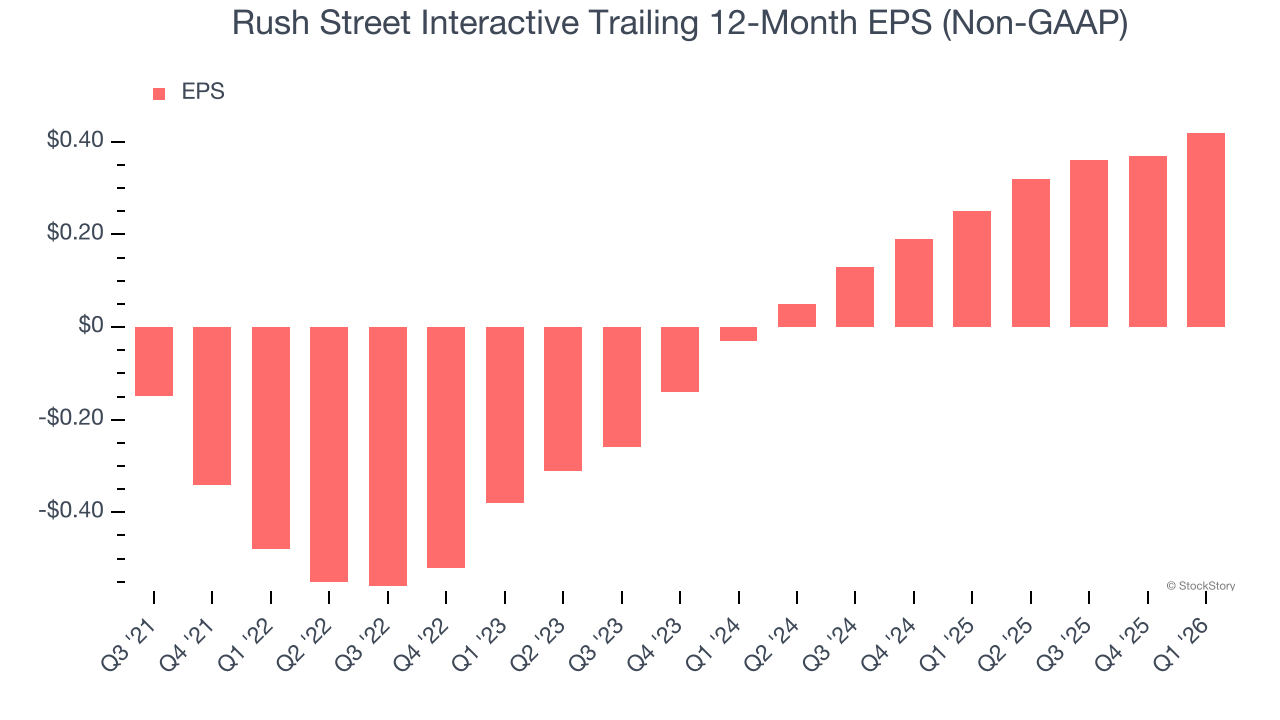
In Q1, Rush Street Interactive reported adjusted EPS of $0.14, up from $0.09 in the same quarter last year. This print easily cleared analysts’ estimates, and shareholders should be content with the results. Over the next 12 months, Wall Street expects Rush Street Interactive’s full-year EPS of $0.42 to grow 42%.
Key Takeaways from Rush Street Interactive’s Q1 Results
We were impressed by how significantly Rush Street Interactive blew past analysts’ adjusted operating income expectations this quarter. We were also excited its revenue outperformed Wall Street’s estimates by a wide margin. Zooming out, we think this was a very solid print. The stock traded up 15% to $27.60 immediately following the results.
Rush Street Interactive may have had a good quarter, but does that mean you should invest right now? What happened in the latest quarter matters, but not as much as longer-term business quality and valuation, when deciding whether to invest in this stock. We cover that in our actionable full research report which you can read here (it’s free).