Membership-only discount retailer BJ’s Wholesale Club (NYSE: BJ) reported Q1 CY2026 results exceeding the market’s revenue expectations, with sales up 9.9% year on year to $5.66 billion. Its non-GAAP profit of $1.10 per share was 6.7% above analysts’ consensus estimates.
Is now the time to buy BJ's? Find out by accessing our full research report, it’s free.
BJ's (BJ) Q1 CY2026 Highlights:
- Revenue: $5.66 billion vs analyst estimates of $5.43 billion (9.9% year-on-year growth, 4.2% beat)
- Adjusted EPS: $1.10 vs analyst estimates of $1.03 (6.7% beat)
- Adjusted EBITDA: $298.1 million vs analyst estimates of $281.3 million (5.3% margin, 5.9% beat)
- Management reiterated its full-year Adjusted EPS guidance of $4.50 at the midpoint
- Operating Margin: 3.7%, in line with the same quarter last year
- Free Cash Flow was -$42.05 million, down from $67.6 million in the same quarter last year
- Locations: 267 at quarter end, up from 255 in the same quarter last year
- Same-Store Sales rose 6.3% year on year (1.6% in the same quarter last year)
- Market Capitalization: $12.06 billion
“We delivered a strong first quarter as our value proposition continued to resonate with members across our clubs and at our gas stations. Momentum in membership, fuel and digital sales reflects the disciplined execution of our teams and our focus on delivering value and convenience for the families who depend on us,” said Bob Eddy, Chairman and Chief Executive Officer, BJ’s Wholesale Club.
Company Overview
Appealing to the budget-conscious individual shopping for a household, BJ’s Wholesale Club (NYSE: BJ) is a membership-only retail chain that sells groceries, appliances, electronics, and household items, often in bulk quantities.
Revenue Growth
A company’s long-term sales performance can indicate its overall quality. Any business can experience short-term success, but top-performing ones enjoy sustained growth for years.
With $21.97 billion in revenue over the past 12 months, BJ's is one of the larger companies in the consumer retail industry and benefits from a well-known brand that influences purchasing decisions. However, its scale is a double-edged sword because there is only so much real estate to build new stores, placing a ceiling on its growth. To accelerate sales, BJ's likely needs to optimize its pricing or lean into international expansion.
As you can see below, BJ’s sales grew at a sluggish 4% compounded annual growth rate over the last three years, but to its credit, it opened new stores and increased sales at existing, established locations.
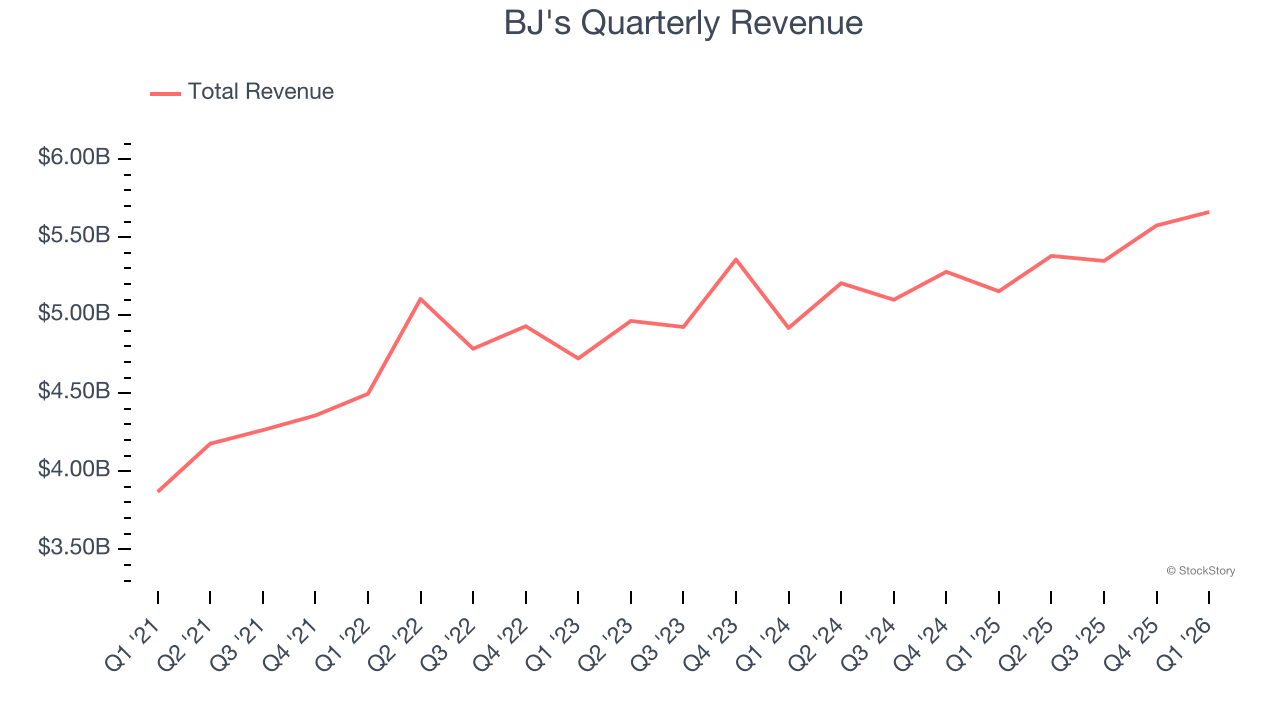
This quarter, BJ's reported year-on-year revenue growth of 9.9%, and its $5.66 billion of revenue exceeded Wall Street’s estimates by 4.2%.
Looking ahead, sell-side analysts expect revenue to grow 5.9% over the next 12 months, an acceleration versus the last three years. This projection is particularly noteworthy for a company of its scale and implies its newer products will spur better top-line performance.
ONE MORE THING: The $21 AI Application Stock Wall Street Forgot. While Wall Street obsesses over who’s building AI, one company is already using it to print money. And nobody’s paying attention.
AI chip stocks trade at ridiculous valuations. This company processes a trillion consumer signals monthly using AI and trades at a third of the price. The gap won’t last. The institutions will figure it out. You need to see this first. Read the FREE Report Before They Notice.
Store Performance
Number of Stores
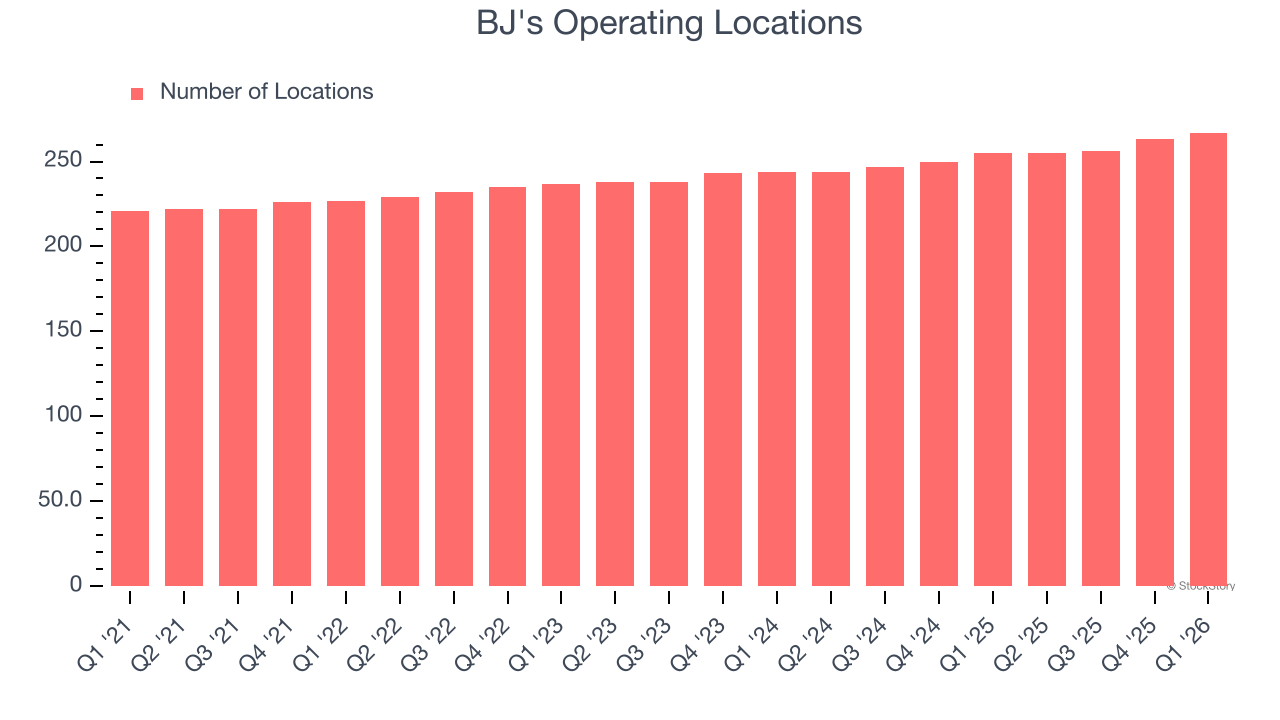
A retailer’s store count often determines how much revenue it can generate.
BJ's sported 267 locations in the latest quarter. Over the last two years, it has opened new stores quickly, averaging 4% annual growth. This was faster than the broader consumer retail sector.
When a retailer opens new stores, it usually means it’s investing for growth because demand is greater than supply, especially in areas where consumers may not have a store within reasonable driving distance.
Same-Store Sales
A company's store base only paints one part of the picture. When demand is high, it makes sense to open more. But when demand is low, it’s prudent to close some locations and use the money in other ways. Same-store sales is an industry measure of whether revenue is growing at those existing stores and is driven by customer visits (often called traffic) and the average spending per customer (ticket).
BJ’s demand rose over the last two years and slightly outpaced the industry. On average, the company’s same-store sales have grown by 2.4% per year. This performance suggests its rollout of new stores could be beneficial for shareholders. When a retailer has demand, more locations should help it reach more customers and boost revenue growth.
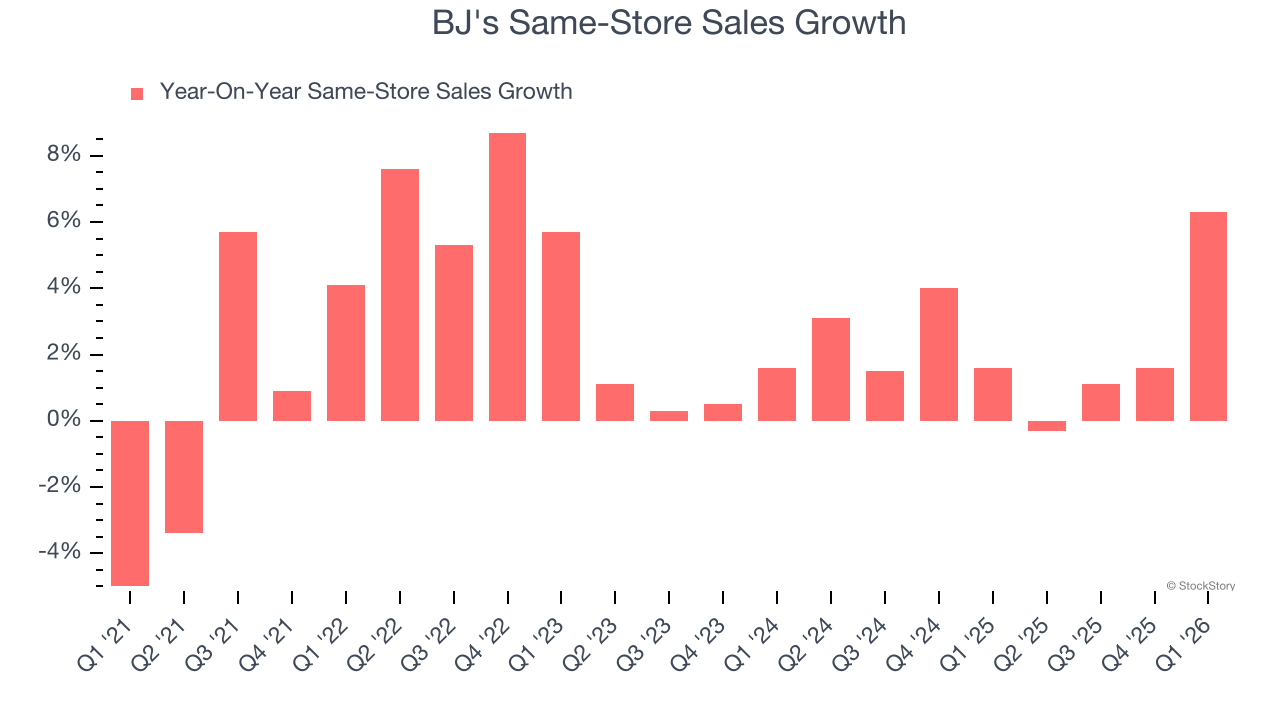
In the latest quarter, BJ’s same-store sales rose 6.3% year on year. This growth was an acceleration from its historical levels, which is always an encouraging sign.
Key Takeaways from BJ’s Q1 Results
We were impressed by how significantly BJ's exceeded analysts’ revenue expectations this quarter on strong same-store sales growth. We were also glad its EPS outperformed Wall Street’s estimates. On the other hand, its gross margin missed. Overall, we think this was a decent quarter with some key metrics above expectations. The stock traded up 3.1% to $97.44 immediately following the results.
BJ's may have had a good quarter, but does that mean you should invest right now? If you’re making that decision, you should consider the bigger picture of valuation, business qualities, as well as the latest earnings. We cover that in our actionable full research report which you can read here (it’s free).