

Precision motion systems specialist Allient (NASDAQ: ALNT) met Wall Street’s revenue expectations in Q1 CY2026, with sales up 4.6% year on year to $138.9 million. Its non-GAAP profit of $0.46 per share was 13.6% below analysts’ consensus estimates.
Is now the time to buy Allient? Find out by accessing our full research report, it’s free.
Allient (ALNT) Q1 CY2026 Highlights:
- Revenue: $138.9 million vs analyst estimates of $138.4 million (4.6% year-on-year growth, in line)
- Adjusted EPS: $0.46 vs analyst expectations of $0.53 (13.6% miss)
- Adjusted EBITDA: $17.28 million vs analyst estimates of $18.46 million (12.4% margin, 6.4% miss)
- Operating Margin: 6.7%, down from 7.7% in the same quarter last year
- Free Cash Flow Margin: 2.9%, down from 9.7% in the same quarter last year
- Backlog: $251 million at quarter end, up 5.8% year on year
- Market Capitalization: $1.33 billion
Dick Warzala, Chairman and CEO, commented, “The strong uptick in our Bookings is a good indicator of our positive organic growth prospects for this year and beyond. Also, our first quarter results reflect continued progress in executing our strategy, with year-over-year growth in revenue, gross profit, operating income and earnings. We entered 2026 with a stronger balance sheet, a more efficient cost structure and a portfolio aligned with long-term trends in electrification, automation, energy efficiency, digital infrastructure and precision control.
Company Overview
Founded in 1962, Allient (NASDAQ: ALNT) develops and manufactures precision and specialty-controlled motion components and systems.
Revenue Growth
Examining a company’s long-term performance can provide clues about its quality. Any business can experience short-term success, but top-performing ones enjoy sustained growth for years. Luckily, Allient’s sales grew at a decent 8.3% compounded annual growth rate over the last five years. Its growth was slightly above the average industrials company and shows its offerings resonate with customers.
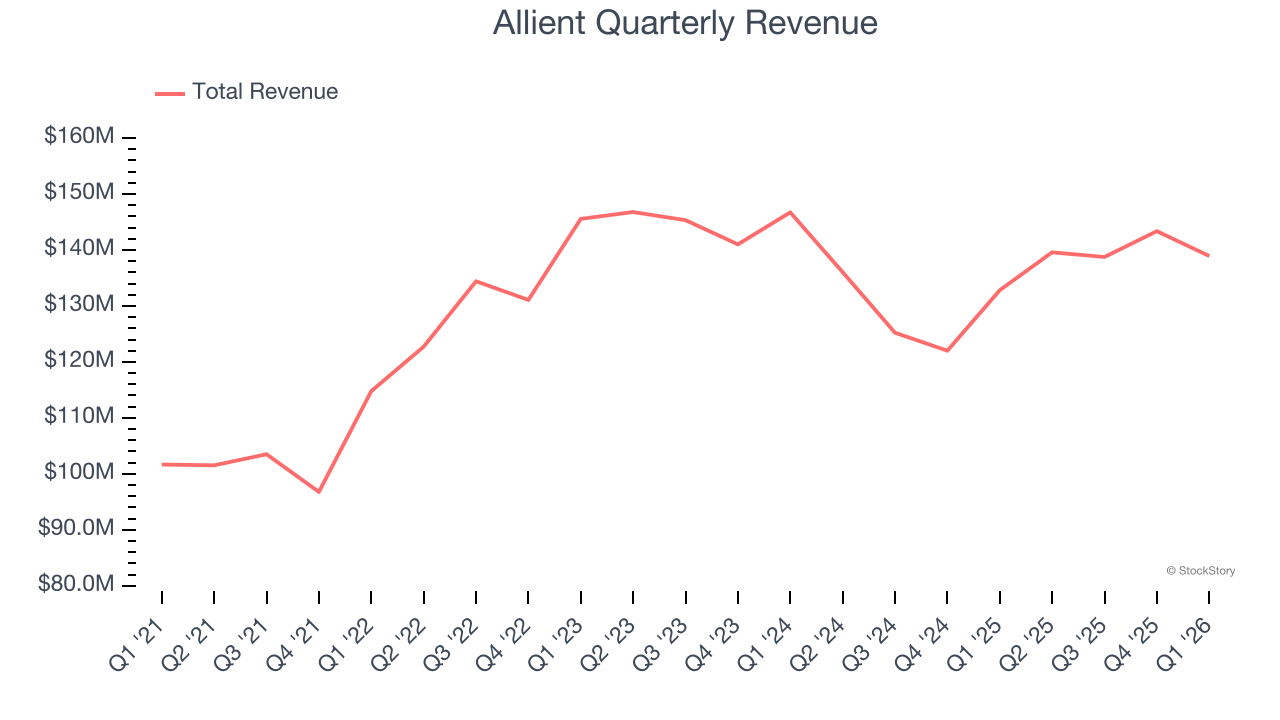
We at StockStory place the most emphasis on long-term growth, but within industrials, a half-decade historical view may miss cycles, industry trends, or a company capitalizing on catalysts such as a new contract win or a successful product line. Allient’s recent performance marks a sharp pivot from its five-year trend as its revenue has shown annualized declines of 1.7% over the last two years. 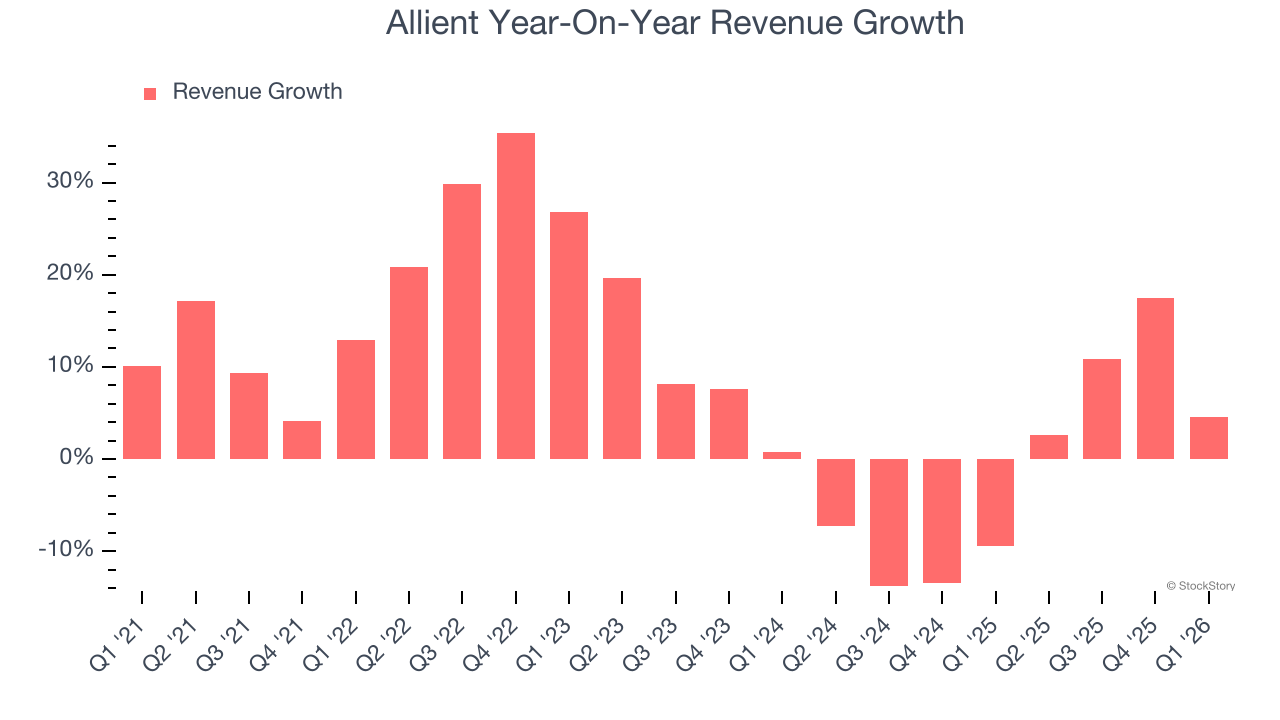
This quarter, Allient grew its revenue by 4.6% year on year, and its $138.9 million of revenue was in line with Wall Street’s estimates.
Looking ahead, sell-side analysts expect revenue to grow 6.9% over the next 12 months. While this projection suggests its newer products and services will fuel better top-line performance, it is still below average for the sector.
WHILE YOU’RE HERE: The Next Palantir? One satellite company captures images of every point on Earth. Every single day. The Pentagon wants it. Hedge funds are using it to beat earnings. You’ve probably never heard of it.
This is what the early days of Palantir looked like before it became a $437 billion giant. Same playbook. Different technology. If you missed Palantir, you need to see this. Claim The Stock Ticker for Free HERE.
Operating Margin
Operating margin is one of the best measures of profitability because it tells us how much money a company takes home after procuring and manufacturing its products, marketing and selling those products, and most importantly, keeping them relevant through research and development.
Allient was profitable over the last five years but held back by its large cost base. Its average operating margin of 7.1% was weak for an industrials business.
On the plus side, Allient’s operating margin rose by 2.5 percentage points over the last five years, as its sales growth gave it operating leverage.
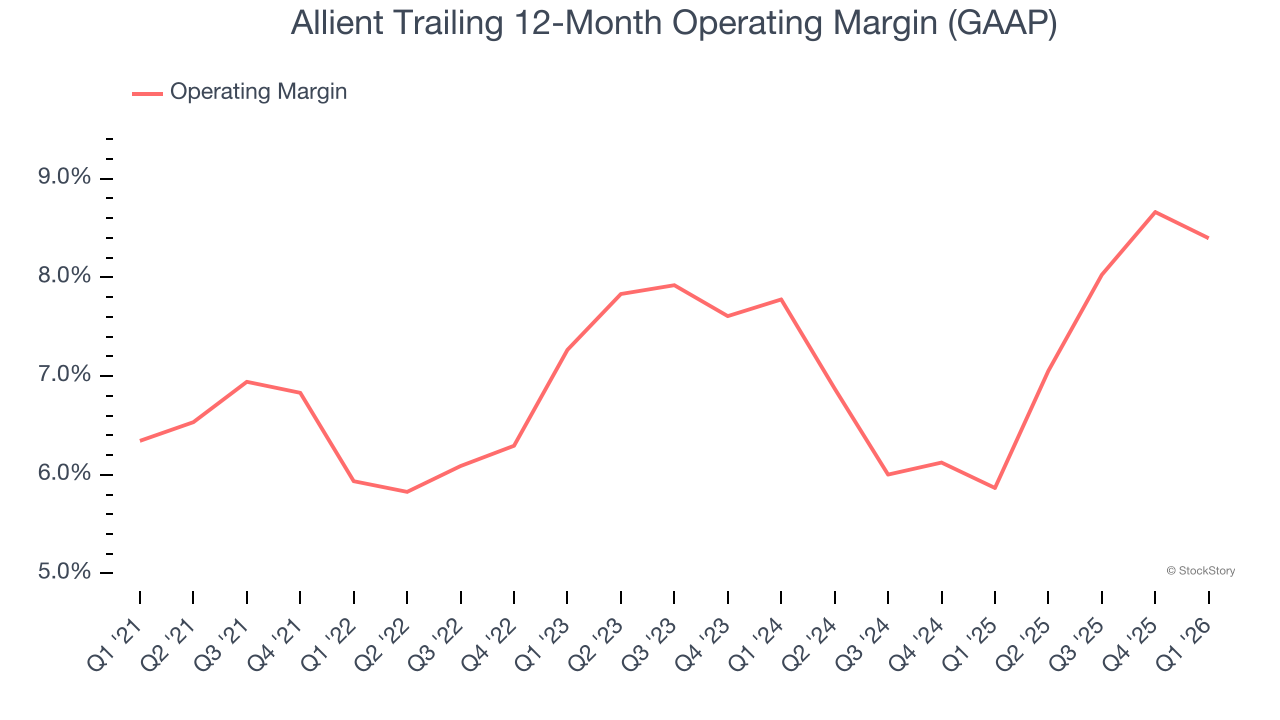
In Q1, Allient generated an operating margin profit margin of 6.7%, down 1 percentage points year on year. Since Allient’s operating margin decreased more than its gross margin, we can assume it was less efficient because expenses such as marketing, R&D, and administrative overhead increased.
Earnings Per Share
Revenue trends explain a company’s historical growth, but the long-term change in earnings per share (EPS) points to the profitability of that growth – for example, a company could inflate its sales through excessive spending on advertising and promotions.
Allient’s EPS grew at 16.8% compounded annual growth rate over the last five years, higher than its 8.3% annualized revenue growth. This tells us the company became more profitable on a per-share basis as it expanded.
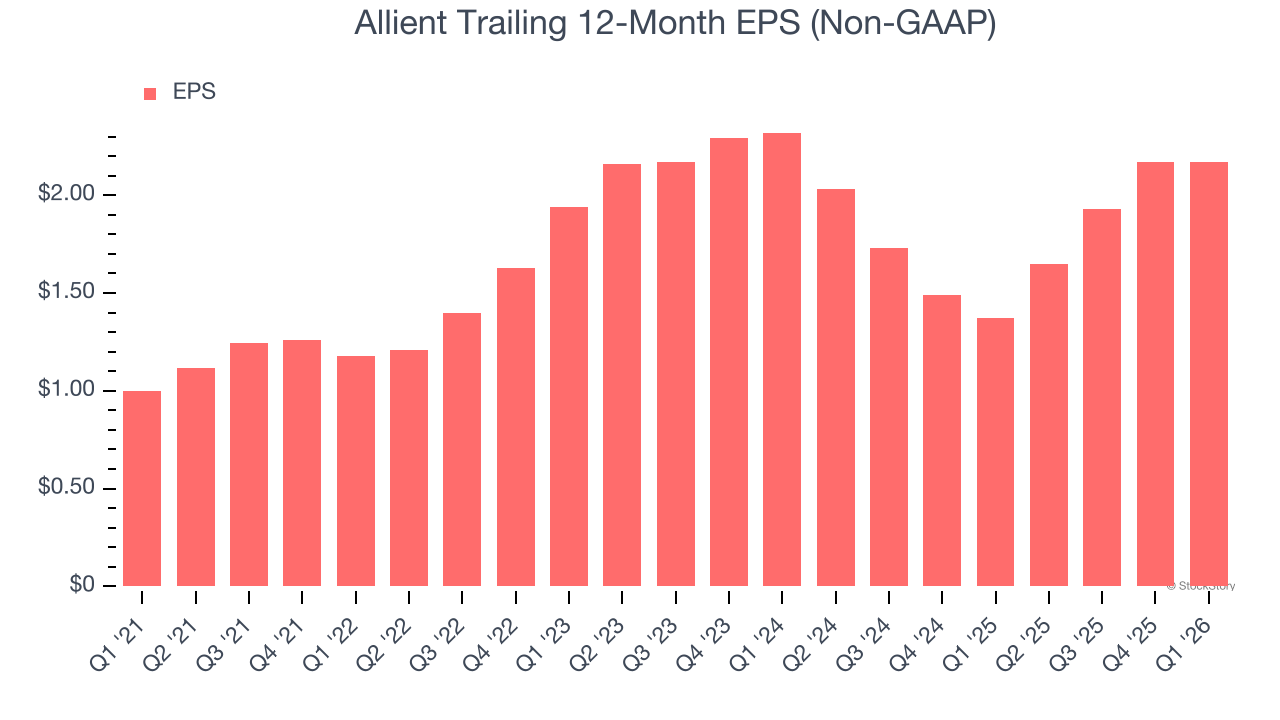
We can take a deeper look into Allient’s earnings to better understand the drivers of its performance. As we mentioned earlier, Allient’s operating margin declined this quarter but expanded by 2.5 percentage points over the last five years. This was the most relevant factor (aside from the revenue impact) behind its higher earnings; interest expenses and taxes can also affect EPS but don’t tell us as much about a company’s fundamentals.
Like with revenue, we analyze EPS over a shorter period to see if we are missing a change in the business.
For Allient, its two-year annual EPS declines of 3.3% mark a reversal from its (seemingly) healthy five-year trend. We hope Allient can return to earnings growth in the future.
In Q1, Allient reported adjusted EPS of $0.46, in line with the same quarter last year. This print missed analysts’ estimates, but we care more about long-term adjusted EPS growth than short-term movements. Over the next 12 months, Wall Street expects Allient’s full-year EPS of $2.17 to grow 31.2%.
Key Takeaways from Allient’s Q1 Results
It was good to see Allient meet analysts’ revenue expectations this quarter. On the other hand, its EBITDA missed and its EPS fell short of Wall Street’s estimates. Overall, this was a weaker quarter. The stock traded down 11.9% to $68.07 immediately following the results.
The latest quarter from Allient’s wasn’t that good. One earnings report doesn’t define a company’s quality, though, so let’s explore whether the stock is a buy at the current price. The latest quarter does matter, but not nearly as much as longer-term fundamentals and valuation, when deciding if the stock is a buy. We cover that in our actionable full research report which you can read here (it’s free).


