Solar tracking systems manufacturer Array (NASDAQ: ARRY) reported Q1 CY2026 results topping the market’s revenue expectations, but sales fell by 26.1% year on year to $223.4 million. On the other hand, next quarter’s revenue guidance of $310 million was less impressive, coming in 20.1% below analysts’ estimates. Its non-GAAP profit of $0.06 per share was significantly above analysts’ consensus estimates.
Is now the time to buy Array? Find out by accessing our full research report, it’s free.
Array (ARRY) Q1 CY2026 Highlights:
- Revenue: $223.4 million vs analyst estimates of $201.7 million (26.1% year-on-year decline, 10.8% beat)
- Adjusted EPS: $0.06 vs analyst estimates of -$0.05 (significant beat)
- Adjusted EBITDA: $28.83 million vs analyst estimates of $8.09 million (12.9% margin, significant beat)
- The company reconfirmed its revenue guidance for the full year of $1.45 billion at the midpoint
- Management reiterated its full-year Adjusted EPS guidance of $0.70 at the midpoint
- EBITDA guidance for the full year is $215 million at the midpoint, in line with analyst expectations
- Operating Margin: 3.2%, down from 9% in the same quarter last year
- Free Cash Flow was -$36.93 million compared to -$13.06 million in the same quarter last year
- Market Capitalization: $1.25 billion
“ARRAY began 2026 with strong performance, delivering revenue and Adjusted EBITDA(1) above the expectations we set on our last earnings call. We delivered another 2x book-to-bill quarter, closing the period at a new record orderbook of $2.4 billion. Orderbook growth continues to be enabled by our traction with our new product offerings like OmniTrack™ and investment in our software and services businesses. We remain focused on high-quality domestic opportunities while pursuing disciplined international expansion, and our momentum this quarter reflected strength both domestically and abroad,” said Chief Executive Officer, Kevin G. Hostetler.
Company Overview
Going public in October 2020, Array (NASDAQ: ARRY) is a global manufacturer of ground-mounting tracking systems for utility and distributed generation solar energy projects.
Revenue Growth
Reviewing a company’s long-term sales performance reveals insights into its quality. Any business can have short-term success, but a top-tier one grows for years. Thankfully, Array’s 12% annualized revenue growth over the last five years was excellent. Its growth beat the average industrials company and shows its offerings resonate with customers.
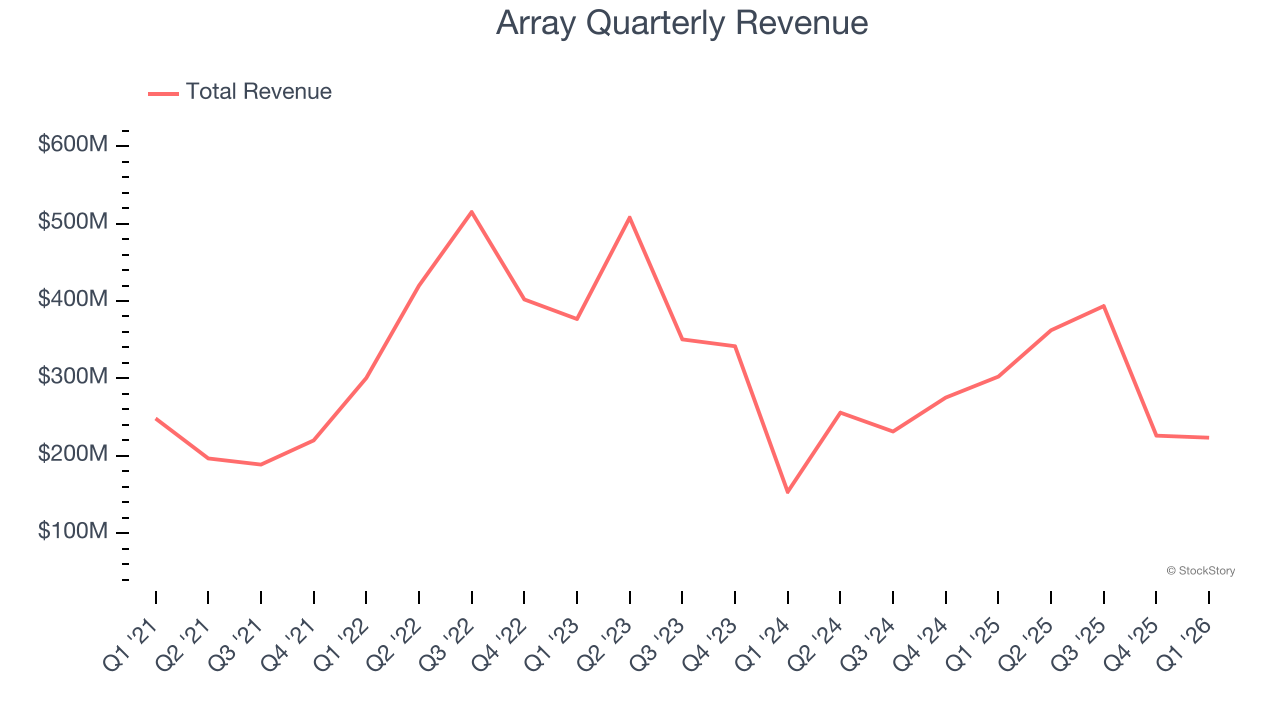
We at StockStory place the most emphasis on long-term growth, but within industrials, a half-decade historical view may miss cycles, industry trends, or a company capitalizing on catalysts such as a new contract win or a successful product line. Array’s recent performance marks a sharp pivot from its five-year trend as its revenue has shown annualized declines of 5.6% over the last two years. 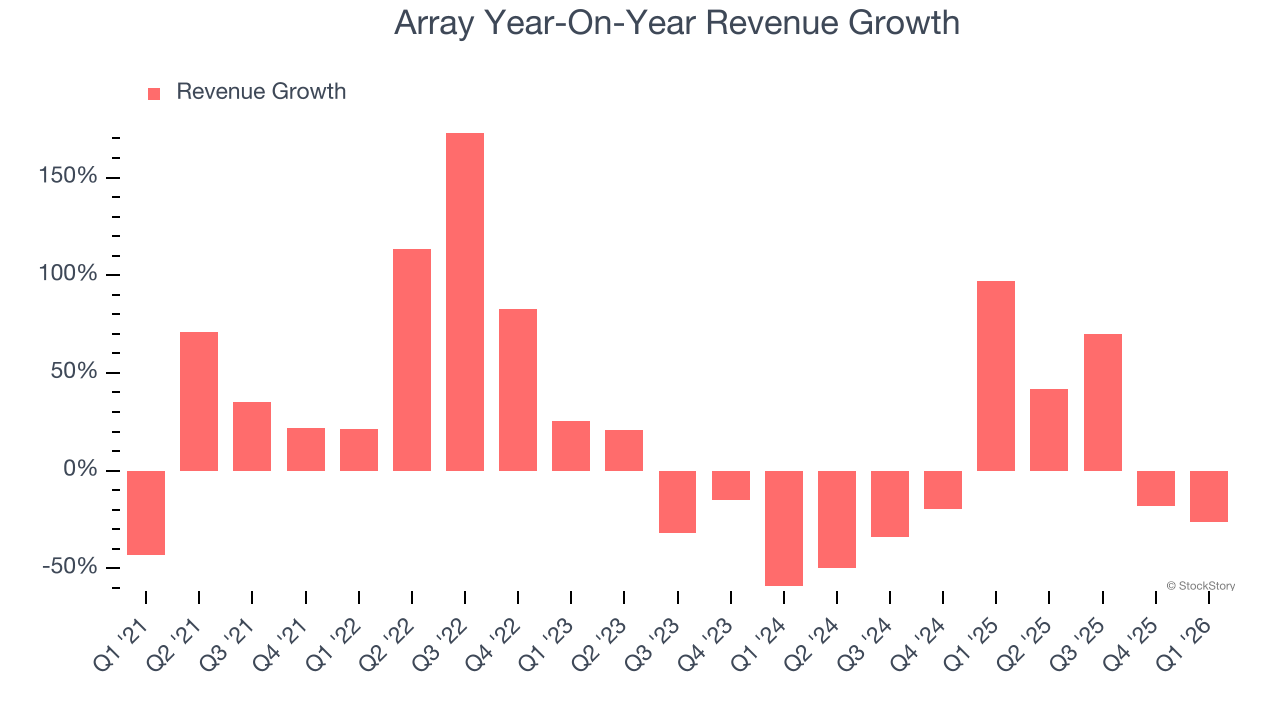
This quarter, Array’s revenue fell by 26.1% year on year to $223.4 million but beat Wall Street’s estimates by 10.8%. Company management is currently guiding for a 14.4% year-on-year decline in sales next quarter.
Looking further ahead, sell-side analysts expect revenue to grow 25.4% over the next 12 months, an improvement versus the last two years. This projection is eye-popping and indicates its newer products and services will spur better top-line performance.
ALSO WORTH WATCHING: Nvidia’s Quiet Partner. Nvidia’s chips cost a hundred grand. The connectors that make them work cost even more. One company makes them all.
Every AI server needs specialized infrastructure the chip companies don’t make. High-speed cables. Power connectors. Thermal sensors. This 90-year-old company built a monopoly on it. The AI boom just started. This stock is still flying under the radar. Claim The Stock Ticker Here for FREE.
Operating Margin
Operating margin is an important measure of profitability as it shows the portion of revenue left after accounting for all core expenses – everything from the cost of goods sold to advertising and wages. It’s also useful for comparing profitability across companies with different levels of debt and tax rates because it excludes interest and taxes.
Although Array was profitable this quarter from an operational perspective, it’s generally struggled over a longer time period. Its expensive cost structure has contributed to an average operating margin of negative 1.2% over the last five years. Unprofitable industrials companies require extra attention because they could get caught swimming naked when the tide goes out. It’s hard to trust that the business can endure a full cycle.
On the plus side, Array’s operating margin rose by 3.2 percentage points over the last five years, as its sales growth gave it operating leverage. Still, it will take much more for the company to show consistent profitability.
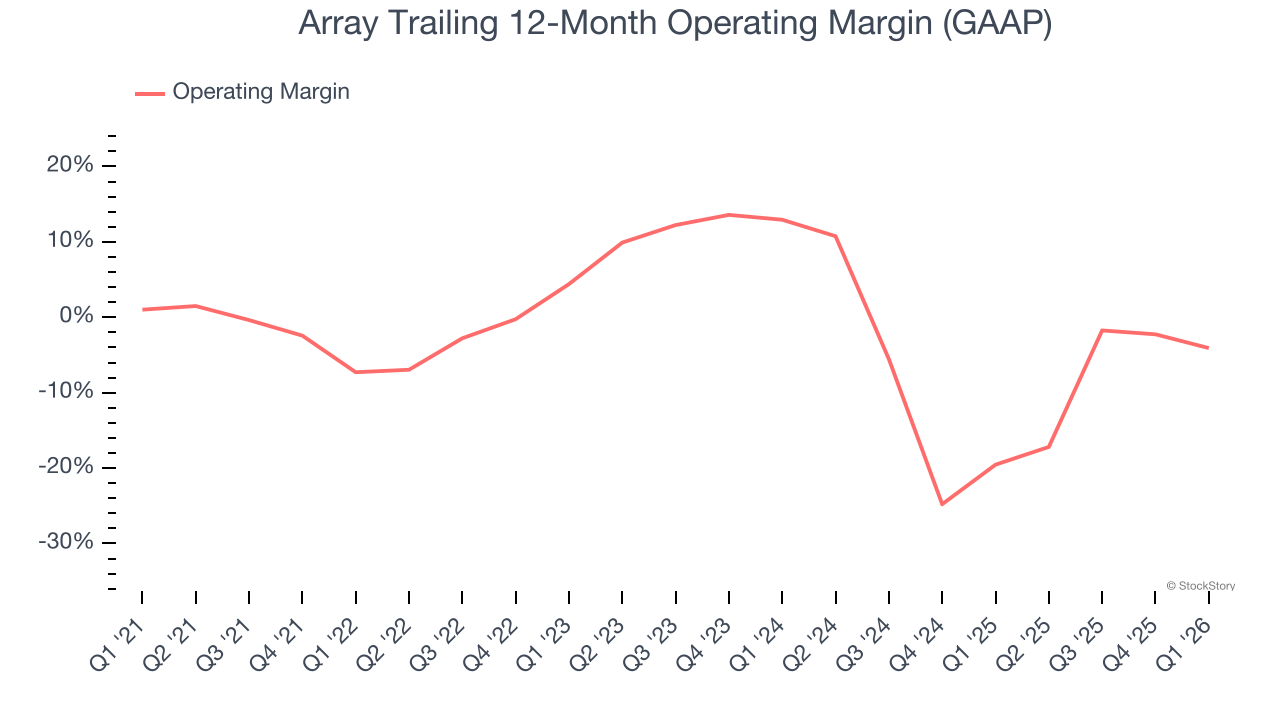
In Q1, Array generated an operating margin profit margin of 3.2%, down 5.8 percentage points year on year. Conversely, its gross margin actually rose, so we can assume its recent inefficiencies were driven by increased operating expenses like marketing, R&D, and administrative overhead.
Earnings Per Share
We track the long-term change in earnings per share (EPS) for the same reason as long-term revenue growth. Compared to revenue, however, EPS highlights whether a company’s growth is profitable.
Sadly for Array, its EPS declined by 28.6% annually over the last five years while its revenue grew by 12%. However, its operating margin actually improved during this time, telling us that non-fundamental factors such as interest expenses and taxes affected its ultimate earnings.
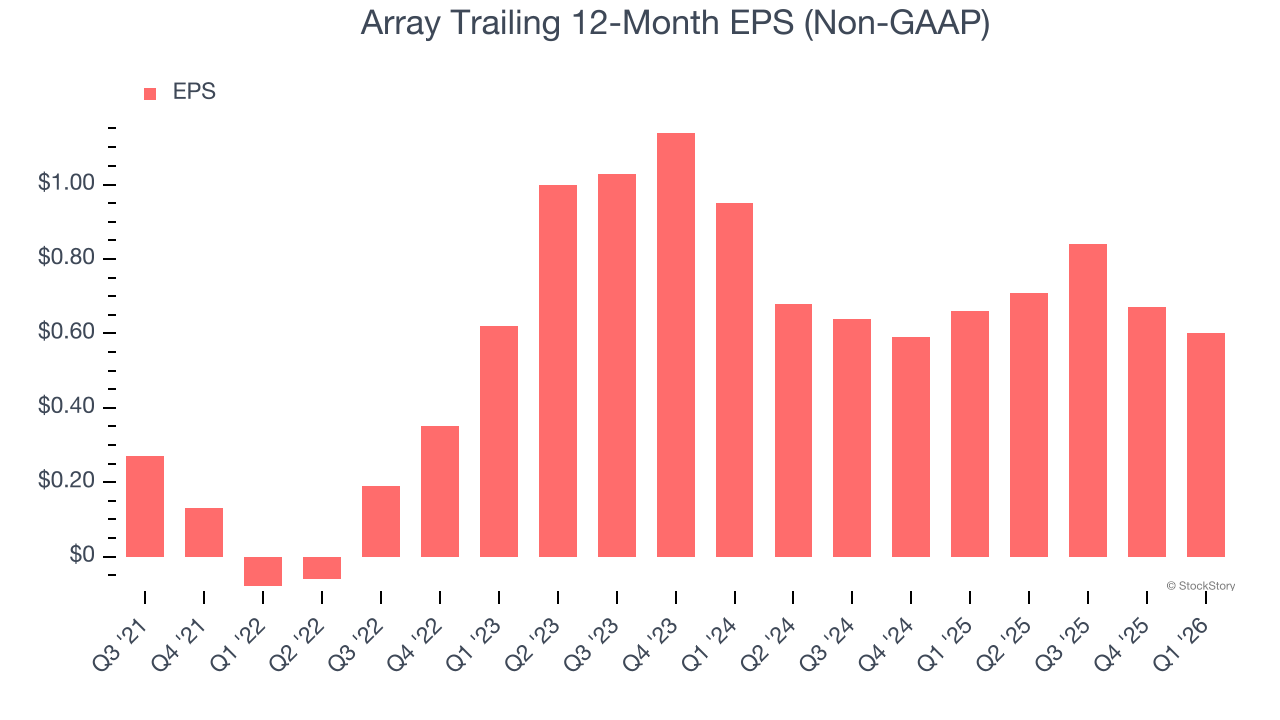
We can take a deeper look into Array’s earnings to better understand the drivers of its performance. A five-year view shows Array has diluted its shareholders, growing its share count by 20.2%. This dilution overshadowed its increased operational efficiency and has led to lower per share earnings. Taxes and interest expenses can also affect EPS but don’t tell us as much about a company’s fundamentals. 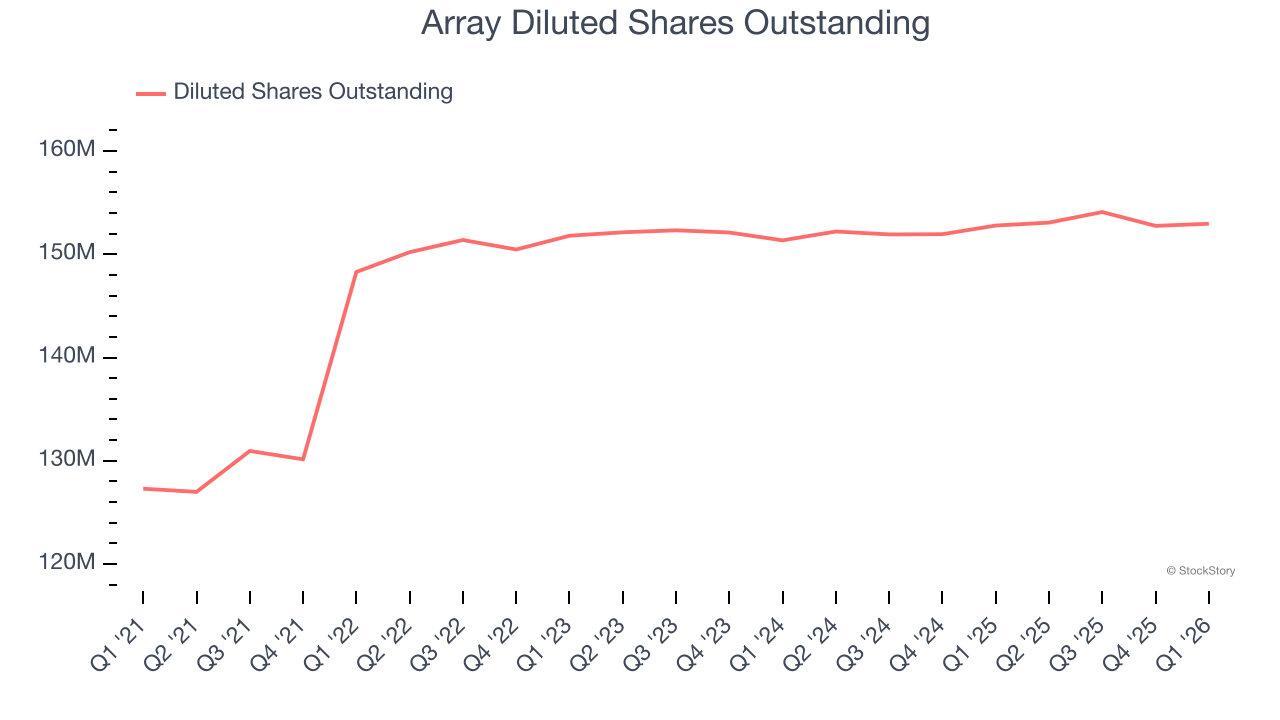
Like with revenue, we analyze EPS over a shorter period to see if we are missing a change in the business.
For Array, its two-year annual EPS declines of 20.5% show it’s still underperforming. These results were bad no matter how you slice the data.
In Q1, Array reported adjusted EPS of $0.06, down from $0.13 in the same quarter last year. Despite falling year on year, this print easily cleared analysts’ estimates. Over the next 12 months, Wall Street expects Array’s full-year EPS of $0.60 to grow 36.1%.
Key Takeaways from Array’s Q1 Results
It was good to see Array beat analysts’ EPS expectations this quarter. We were also excited its EBITDA outperformed Wall Street’s estimates by a wide margin. On the other hand, its revenue guidance for next quarter missed and its full-year revenue guidance fell slightly short of Wall Street’s estimates. Overall, we think this was still a good quarter with some key metrics above expectations. The stock traded up 10.9% to $9.03 immediately after reporting.
Array may have had a good quarter, but does that mean you should invest right now? We think that the latest quarter is only one piece of the longer-term business quality puzzle. Quality, when combined with valuation, can help determine if the stock is a buy. We cover that in our actionable full research report which you can read here (it’s free).