
Homebuilder Lennar (NYSE: LEN) missed Wall Street’s revenue expectations in Q2 CY2026, with sales falling 5.2% year on year to $7.94 billion. Its GAAP profit of $1.24 per share was in line with analysts’ consensus estimates.
Is now the time to buy Lennar? Find out by accessing our full research report, it’s free.
Lennar (LEN) Q2 CY2026 Highlights:
- Revenue: $7.94 billion vs analyst estimates of $8.13 billion (5.2% year-on-year decline, 2.4% miss)
- EPS (GAAP): $1.24 vs analyst estimates of $1.24 (in line)
- Operating Margin: 5.9%, down from 7.5% in the same quarter last year
- Backlog: $6.6 billion at quarter end, up 1.5% year on year
- Market Capitalization: $22.07 billion
Stuart Miller, Executive Chairman, Chief Executive Officer and President of Lennar, said, "Our second quarter of fiscal year 2026 was defined by the same stubborn headwinds that have challenged the housing market for the past several years – persistently elevated mortgage rates, constrained affordability, and cautious consumer sentiment, exacerbated by geopolitical uncertainty creating a resurgent inflation reading of 4.2% driven by higher energy prices. Against that backdrop, our team delivered results that demonstrate the strength and resilience of our operating platform.
Company Overview
One of the largest homebuilders in America, Lennar (NYSE: LEN) is known for constructing affordable, move-up, and retirement homes across a range of markets and communities.
Revenue Growth
A company’s long-term sales performance is one signal of its overall quality. Any business can have short-term success, but a top-tier one grows for years. Over the last five years, Lennar grew its sales at a mediocre 6% compounded annual growth rate. This was below our standard for the industrials sector and is a poor baseline for our analysis.
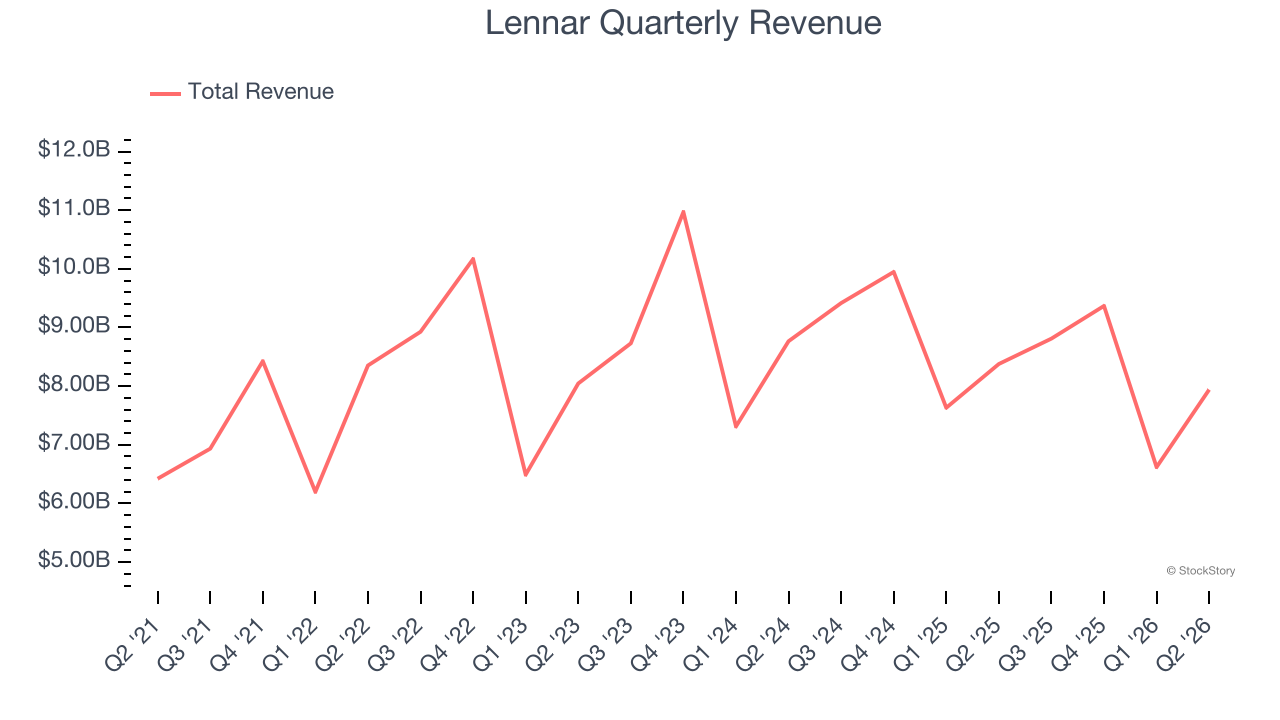
Long-term growth is the most important, but within industrials, a half-decade historical view may miss new industry trends or demand cycles. Lennar’s performance shows it grew in the past but relinquished its gains over the last two years, as its revenue fell by 4.3% annually. 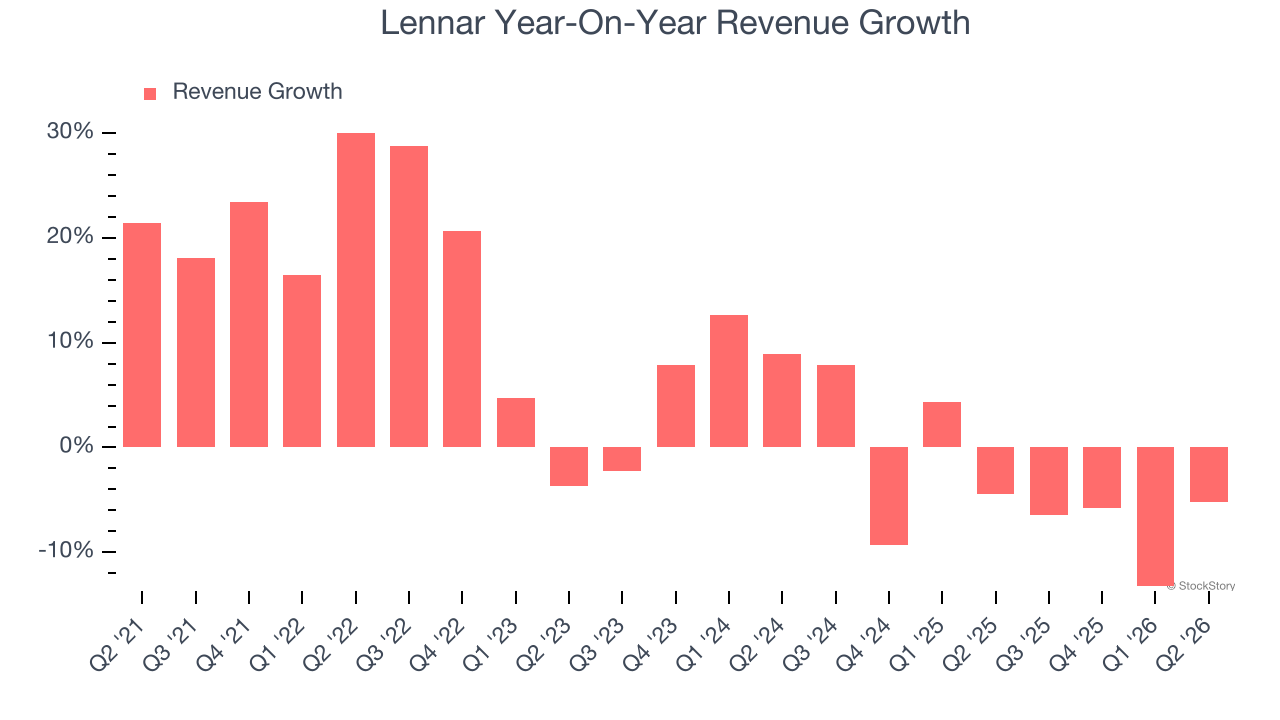
We can better understand the company’s revenue dynamics by analyzing its backlog, or the value of its outstanding orders that have not yet been executed or delivered. Lennar’s backlog reached $6.6 billion in the latest quarter and averaged 9.2% year-on-year declines over the last two years. Because this number is lower than its revenue growth, we can see the company hasn’t secured enough new orders to maintain its growth rate in the future. 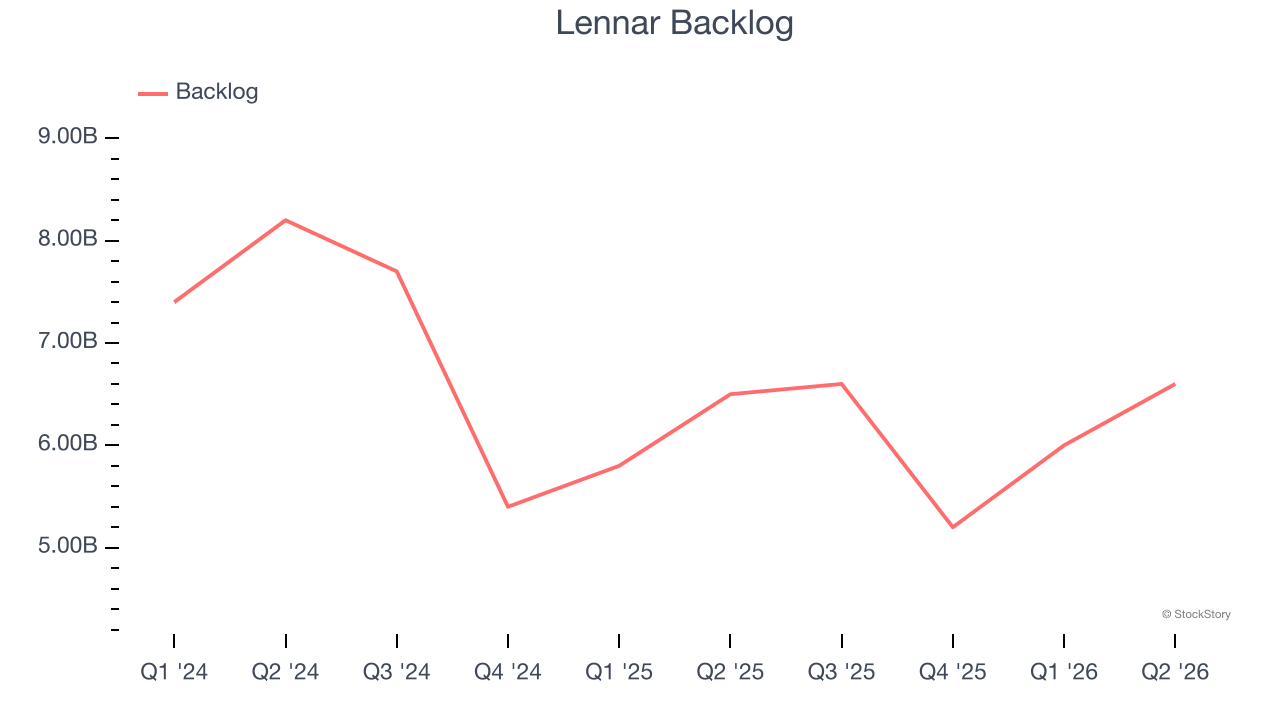
This quarter, Lennar missed Wall Street’s estimates and reported a rather uninspiring 5.2% year-on-year revenue decline, generating $7.94 billion of revenue.
Looking ahead, sell-side analysts expect revenue to grow 1.9% over the next 12 months. While this projection suggests its newer products and services will fuel better top-line performance, it is still below average for the sector.
WHILE YOU’RE HERE: The Next Palantir? One satellite company captures images of every point on Earth. Every single day. The Pentagon wants it. Hedge funds are using it to beat earnings. You’ve probably never heard of it.
This is what the early days of Palantir looked like before it became a $437 billion giant. Same playbook. Different technology. If you missed Palantir, you need to see this. Claim The Stock Ticker for Free HERE.
Operating Margin
Operating margin is one of the best measures of profitability because it tells us how much money a company takes home after procuring and manufacturing its products, marketing and selling those products, and most importantly, keeping them relevant through research and development.
Lennar has been an efficient company over the last five years. It was one of the more profitable businesses in the industrials sector, boasting an average operating margin of 13.9%. This result was particularly impressive because of its low gross margin, which is mostly a factor of what it sells and takes huge shifts to move meaningfully. Companies have more control over their operating margins, and it’s a show of well-managed operations if they’re high when gross margins are low.
Analyzing the trend in its profitability, Lennar’s operating margin decreased by 13.9 percentage points over the last five years. This raises questions about the company’s expense base because its revenue growth should have given it leverage on its fixed costs, resulting in better economies of scale and profitability.
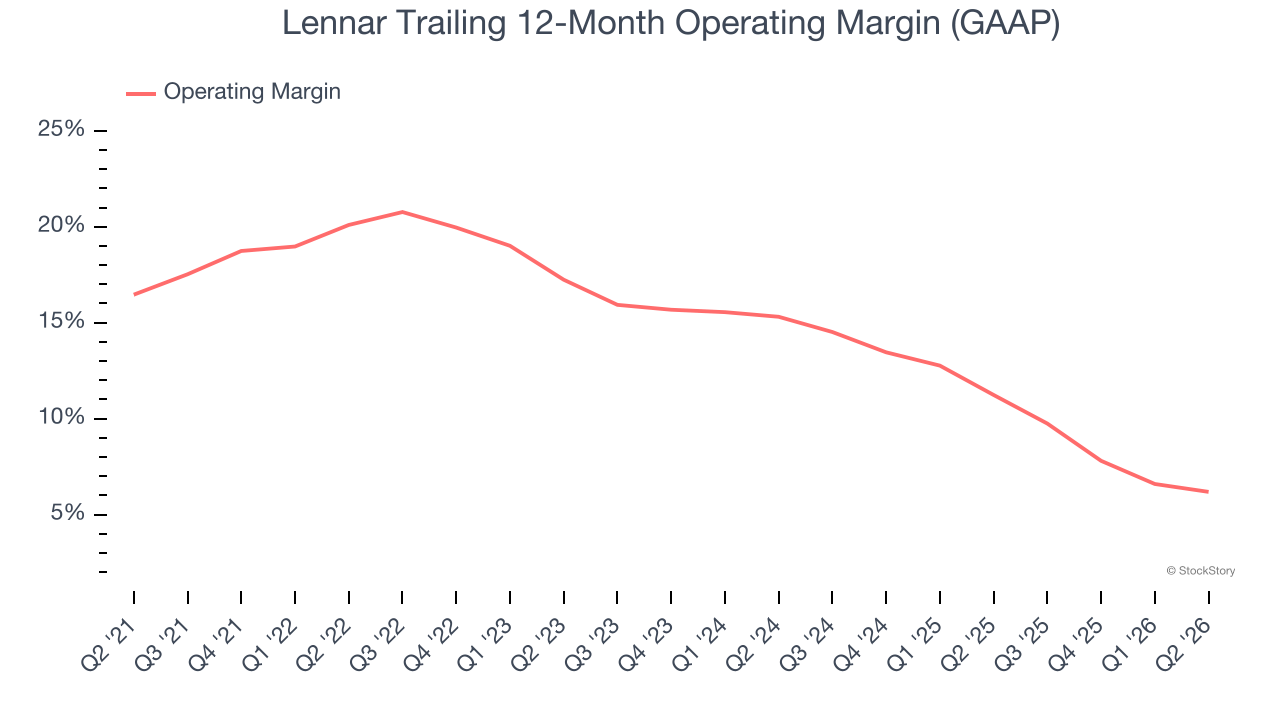
This quarter, Lennar generated an operating margin profit margin of 5.9%, down 1.6 percentage points year on year. Conversely, its gross margin actually rose, so we can assume its recent inefficiencies were driven by increased operating expenses like marketing, R&D, and administrative overhead.
Earnings Per Share
Revenue trends explain a company’s historical growth, but the long-term change in earnings per share (EPS) points to the profitability of that growth — for example, a company could inflate its sales through excessive spending on advertising and promotions.
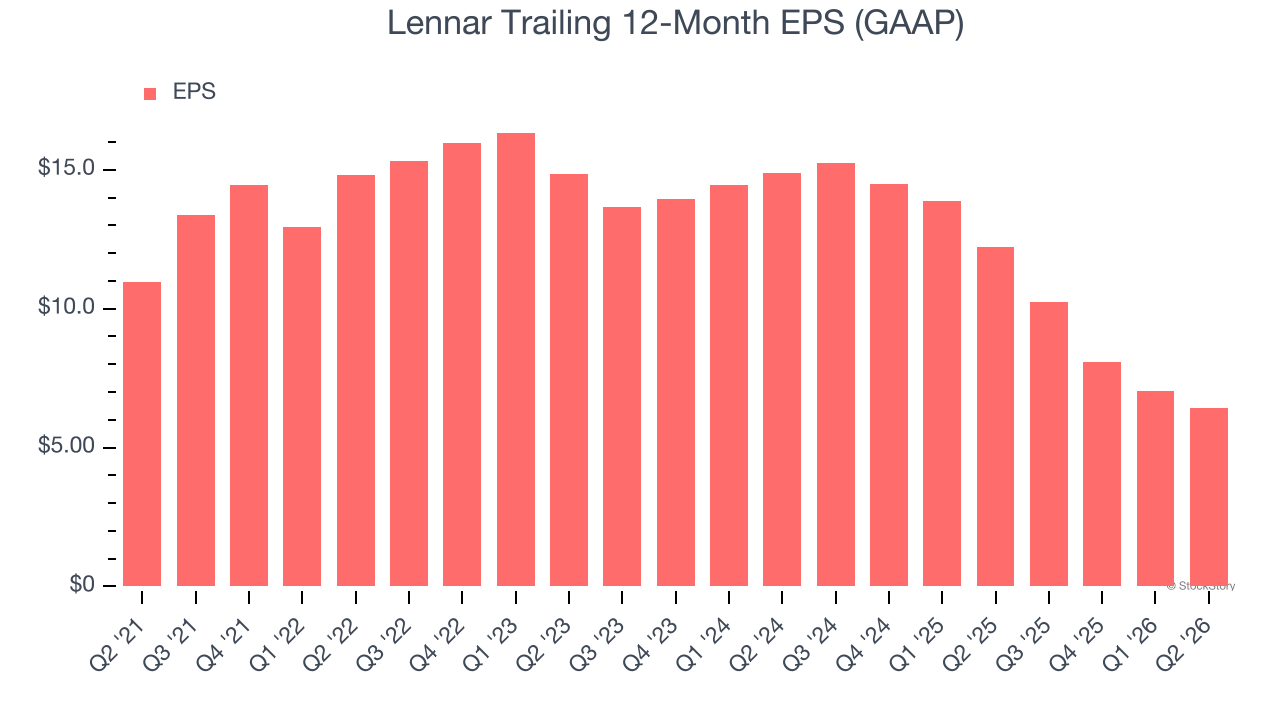
Sadly for Lennar, its EPS declined by 10.1% annually over the last five years while its revenue grew by 6%. This tells us the company became less profitable on a per-share basis as it expanded due to non-fundamental factors such as interest expenses and taxes.
Diving into the nuances of Lennar’s earnings can give us a better understanding of its performance. As we mentioned earlier, Lennar’s operating margin declined by 13.9 percentage points over the last five years. This was the most relevant factor (aside from the revenue impact) behind its lower earnings; interest expenses and taxes can also affect EPS but don’t tell us as much about a company’s fundamentals.
Like with revenue, we analyze EPS over a more recent period because it can provide insight into an emerging theme or development for the business.
For Lennar, its two-year annual EPS declines of 34.2% show it’s continued to underperform. These results were bad no matter how you slice the data.
In Q2, Lennar reported EPS of $1.24, down from $1.83 in the same quarter last year. This print was close to analysts’ estimates. Over the next 12 months, Wall Street expects Lennar’s full-year EPS to grow 2.1% from $6.43 to $6.57.
Key Takeaways from Lennar’s Q2 Results
We struggled to find many positives in these results. Its revenue missed and its adjusted operating income fell short of Wall Street’s estimates. Overall, this quarter could have been better. The stock traded down 2.2% to $93.28 immediately following the results.
Lennar may have had a tough quarter, but does that actually create an opportunity to invest right now? When making that decision, it’s important to consider its valuation, business qualities, as well as what has happened in the latest quarter. We cover that in our actionable full research report which you can read here (it’s free).