Drilling services company Nabors Industries (NYSE: NBR) reported Q2 CY2026 results exceeding the market’s revenue expectations, but sales fell by 1.9% year on year to $816.9 million. Its non-GAAP loss of $2.04 per share was 66.5% below analysts’ consensus estimates.
Is now the time to buy Nabors Industries? Find out by accessing our full research report, it’s free.
Nabors Industries (NBR) Q2 CY2026 Highlights:
- Revenue: $816.9 million vs analyst estimates of $807.2 million (1.9% year-on-year decline, 1.2% beat)
- Adjusted EPS: -$2.04 vs analyst expectations of -$1.23 (66.5% miss)
- Adjusted EBITDA: $221.7 million vs analyst estimates of $213.5 million (27.1% margin, 3.8% beat)
- Free Cash Flow was $12.34 million, up from -$27.1 million in the same quarter last year
- Market Capitalization: $1.16 billion
Anthony G. Petrello, Nabors Chairman, CEO and President, commented, "Second quarter results reflected another quarter of solid operational and financial progress. All our operating segments exceeded the targets we set.
Company Overview
Operating one of the largest land-based drilling rig fleets in the world with over 285 rigs across more than 15 countries, Nabors Industries (NYSE: NBR) operates drilling rigs and provides related services to help oil and gas companies drill wells on land and offshore platforms.
Revenue Growth
Cyclical sectors like Energy often flatter weaker operators during favorable price environments, but a longer-term lens separates those from businesses that can consistently perform across market cycles. Over the last five years, Nabors Industries grew its sales at a decent 11.9% compounded annual growth rate. Its growth was slightly above the average energy upstream and integrated energy company and shows its offerings resonate with customers.
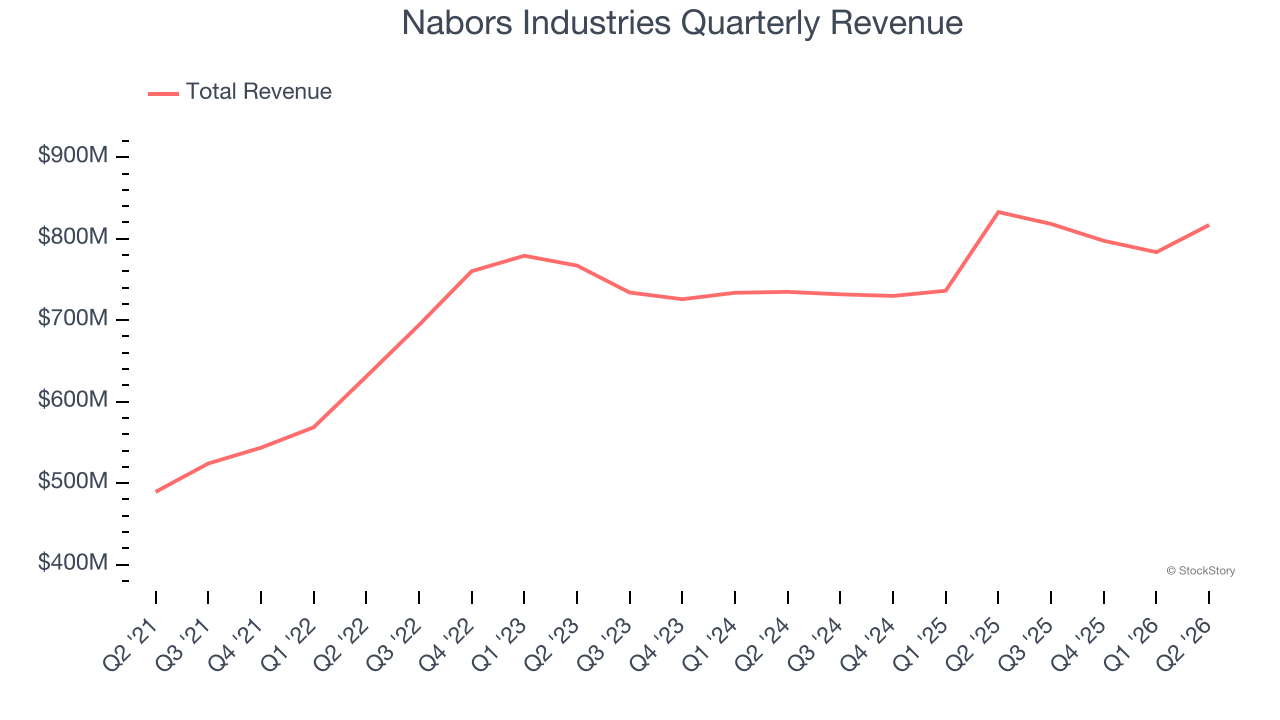
Within Energy, a singular timeframe, even if it’s quite long-term, only sheds light on how well a company rode the last commodity cycle. To better assess whether a company compounds through cycles, we validate our view with an even longer, ten-year view. Nabors Industries’s annualized revenue growth of 1.6% over the last ten years is below its five-year trend, but we still think the results were respectable.
This quarter, Nabors Industries’s revenue fell by 1.9% year on year to $816.9 million but beat Wall Street’s estimates by 1.2%.
ONE MORE THING: 3 Hidden Platforms Growing 3X Faster than Amazon, Google, and PayPal. Amazon, Google, and Meta all followed the same playbook: Dominate an ignored market. Build an unbeatable moat. Scale until you’re unstoppable.
These three platforms are running that exact playbook right now. The early investors in Amazon made fortunes. The early investors in these could do the same. Get All 3 Stocks Here for FREE.
Adjusted EBITDA Margin
Nabors Industries was profitable over the last five years but held back by its large cost base. Its average EBITDA margin of 28.4% was weak for an upstream and integrated energy business.
On the plus side, Nabors Industries’s EBITDA margin rose by 3.4 percentage points over the last year, as its sales growth gave it operating leverage.
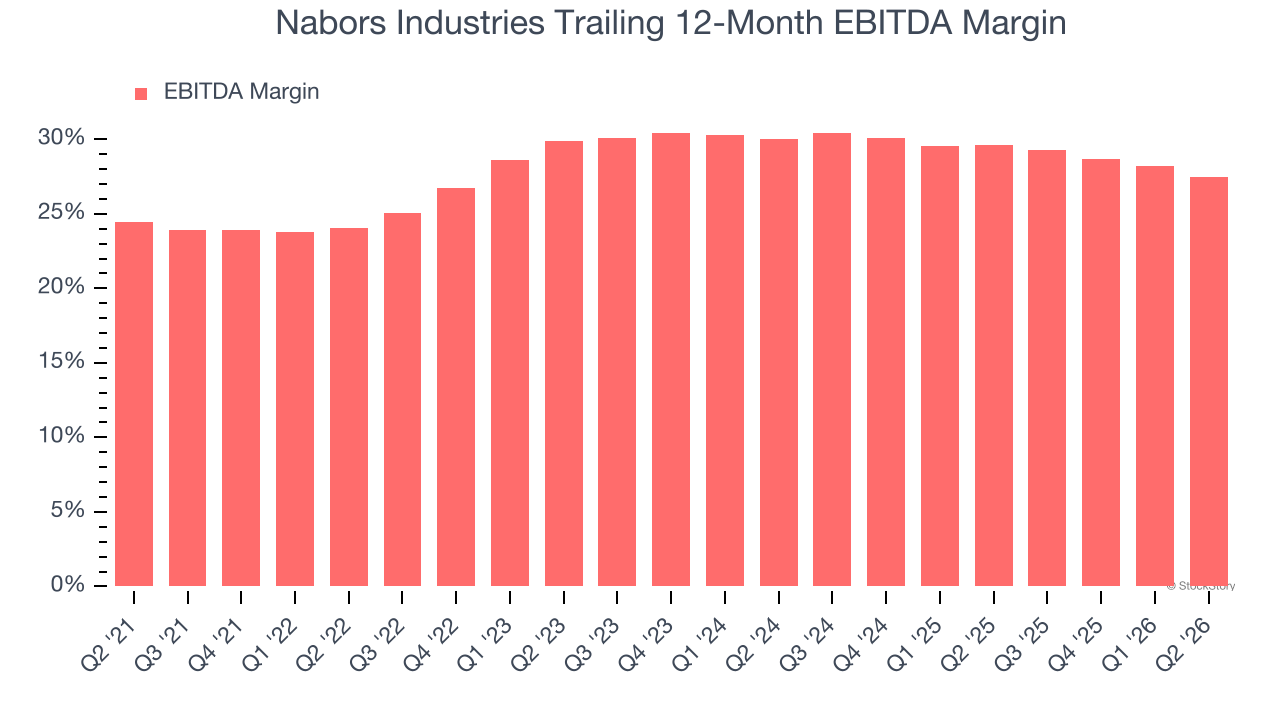
This quarter, Nabors Industries generated an EBITDA margin profit margin of 27.1%, down 2.7 percentage points year on year. This contraction shows it was less efficient because its expenses increased relative to its revenue. This adjusted EBITDA beat Wall Street’s estimates by 3.8%.
Cash Is King
Adjusted EBITDA shows how profitable a company’s existing “rock” is before financing and reinvestment, while free cash flow shows how much value remains after paying to replace those wells. Because production declines over time, strong EBITDA can coexist with weak FCF if drilling is expensive or declines are steep. FCF therefore captures both operating efficiency and the cost of sustaining production.
Nabors Industries has shown weak cash profitability relative to peers over the last five years, giving the company fewer opportunities to return capital to shareholders. Its free cash flow margin averaged 1.9%, below what we’d expect for an upstream and integrated energy business.
While the level of free cash flow margins is important, their consistency matters just as much.
Nabors Industries’s ratio of quarterly free cash flow volatility to WTI crude price volatility over the past five years was 23 (lower is better), indicating that its cash generation is far more sensitive to commodity-price swings than most peers. This elevated volatility limits its access to capital in downturns and makes it unlikely to act as a consolidator when weaker competitors come under pressure.
You may be asking why we wait until the free cash flow line to perform this stability analysis versus commodity prices. Why not compare revenue or EBITDA to WTI in the case of Nabors Industries? Because what ultimately matters is not how much revenue or profit you earn when prices are high but how much cash you can generate when prices are low. Free cash flow is the superior metric because it includes everything from hedging prowess to growth and maintenance capex to management behavior during good times and bad.
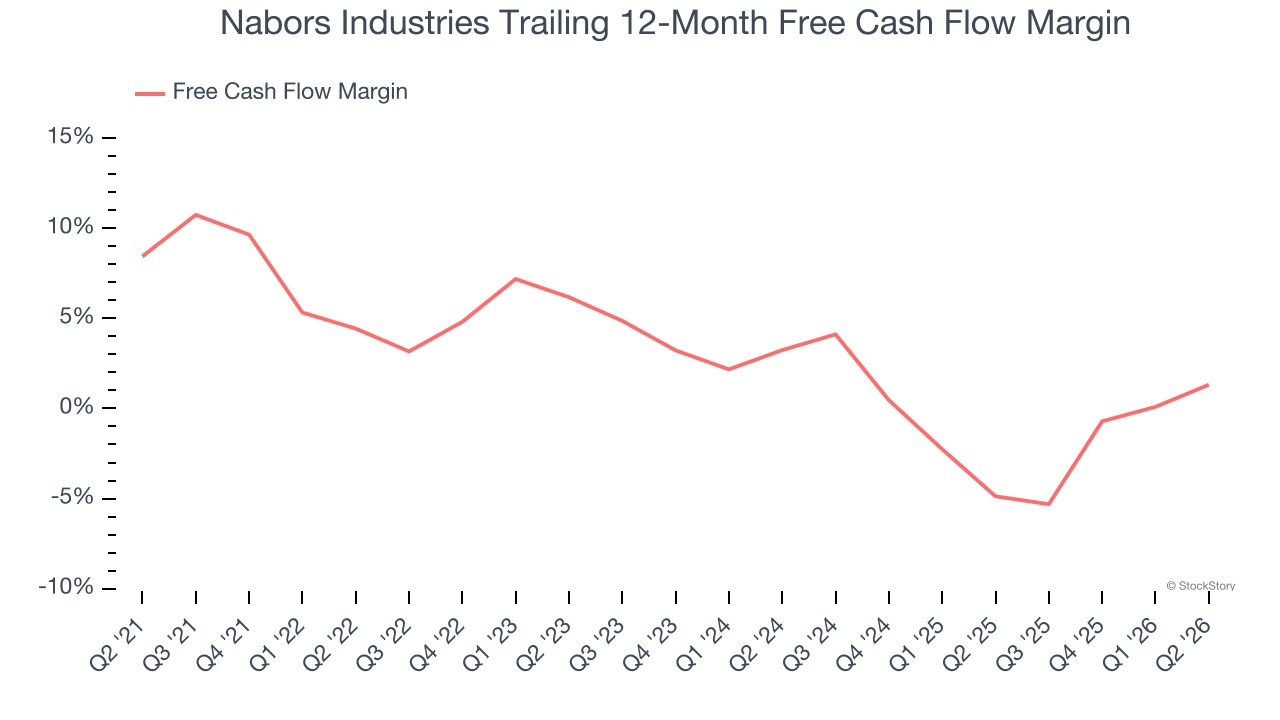
Nabors Industries’s free cash flow clocked in at $12.34 million in Q2, equivalent to a 1.5% margin. Its cash flow turned positive after being negative in the same quarter last year, but we wouldn’t put too much weight on the short term because investment needs can be seasonal, causing temporary swings. Long-term trends trump fluctuations.
Key Takeaways from Nabors Industries’s Q2 Results
It was good to see Nabors Industries narrowly top analysts’ revenue expectations this quarter. We were also happy its EBITDA outperformed Wall Street’s estimates. Overall, this was a solid quarter. The stock remained flat at $75.75 immediately after reporting.
Is Nabors Industries an attractive investment opportunity at the current price? When making that decision, it’s important to consider its valuation, business qualities, as well as what has happened in the latest quarter. We cover that in our actionable full research report which you can read here (it’s free).