Live events and entertainment company Live Nation (NYSE: LYV) reported revenue ahead of Wall Street’s expectations in Q2 CY2026, with sales up 9.4% year on year to $7.67 billion. Its GAAP profit of $1.05 per share was 62.3% above analysts’ consensus estimates.
Is now the time to buy Live Nation? Find out by accessing our full research report, it’s free.
Live Nation (LYV) Q2 CY2026 Highlights:
- Revenue: $7.67 billion vs analyst estimates of $7.56 billion (9.4% year-on-year growth, 1.4% beat)
- EPS (GAAP): $1.05 vs analyst estimates of $0.65 (62.3% beat)
- Adjusted Operating Income: $817 million vs analyst estimates of $488.8 million (10.7% margin, 67.2% beat)
- Operating Margin: 6.8%, in line with the same quarter last year
- Free Cash Flow Margin: 6.7%, down from 8.6% in the same quarter last year
- Market Capitalization: $42.92 billion
None of this happens without the artists — they make these moments, and we're grateful to every artist and crew who trust us with their tours. This was a quarter of milestones: nearly 49 million fans attended our shows, Ticketmaster grew adjusted operating income 14%, and all-time-high deferred revenue points to a strong second half. The first-quarter legal accrual will weigh on reported operating income, but we remain on track for double-digit adjusted operating income growth this year — and to compound at that level for years to come." –Michael Rapino, President and CEO
Company Overview
Owner of Ticketmaster and operator of music festival EDC, Live Nation (NYSE: LYV) is a company specializing in live event promotion, venue management, and ticketing services for concerts and shows.
Revenue Growth
Examining a company’s long-term performance can provide clues about its quality. Any business can put up a good quarter or two, but the best consistently grow over the long haul. Luckily, Live Nation’s sales grew at an incredible 82.8% compounded annual growth rate over the last five years. Its growth beat the average consumer discretionary company and shows its offerings resonate with customers.
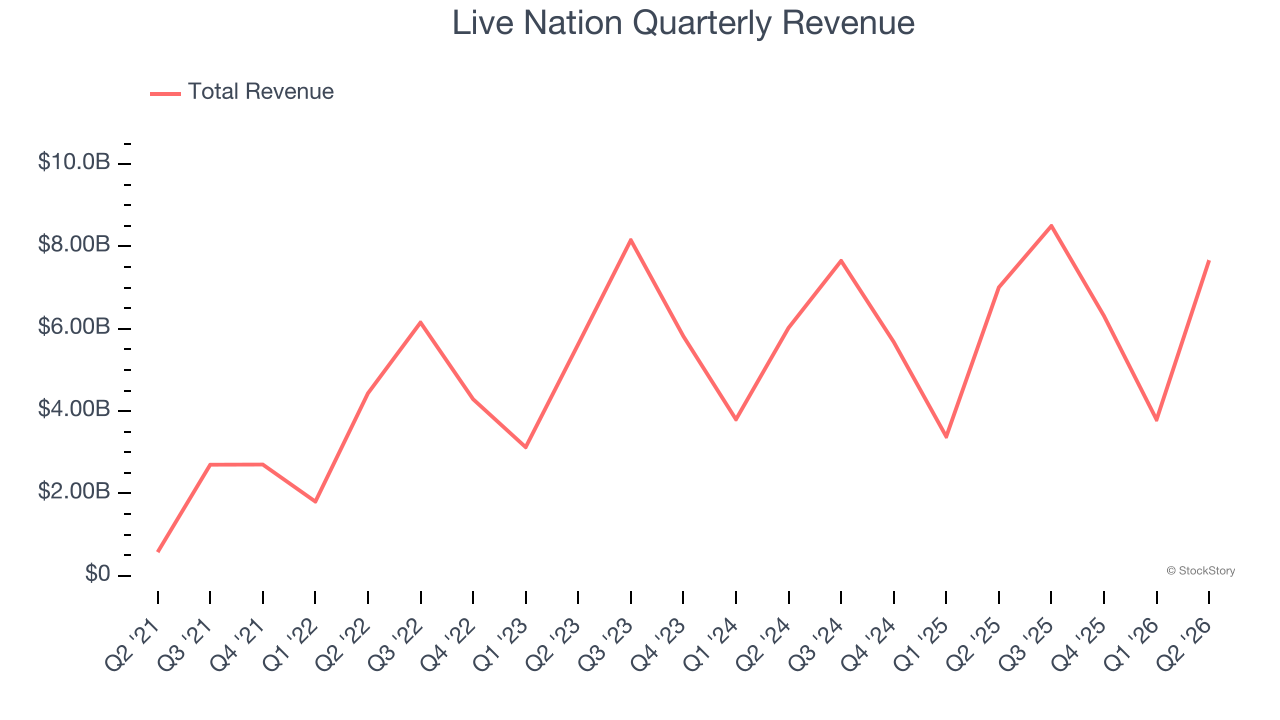
We at StockStory place the most emphasis on long-term growth, but within consumer discretionary, a stretched historical view may miss a company riding a successful new product or trend. Live Nation’s recent performance shows its demand has slowed significantly as its annualized revenue growth of 5.1% over the last two years was well below its five-year trend. Note that COVID hurt Live Nation’s business in 2020 and part of 2021, and it bounced back in a big way thereafter. 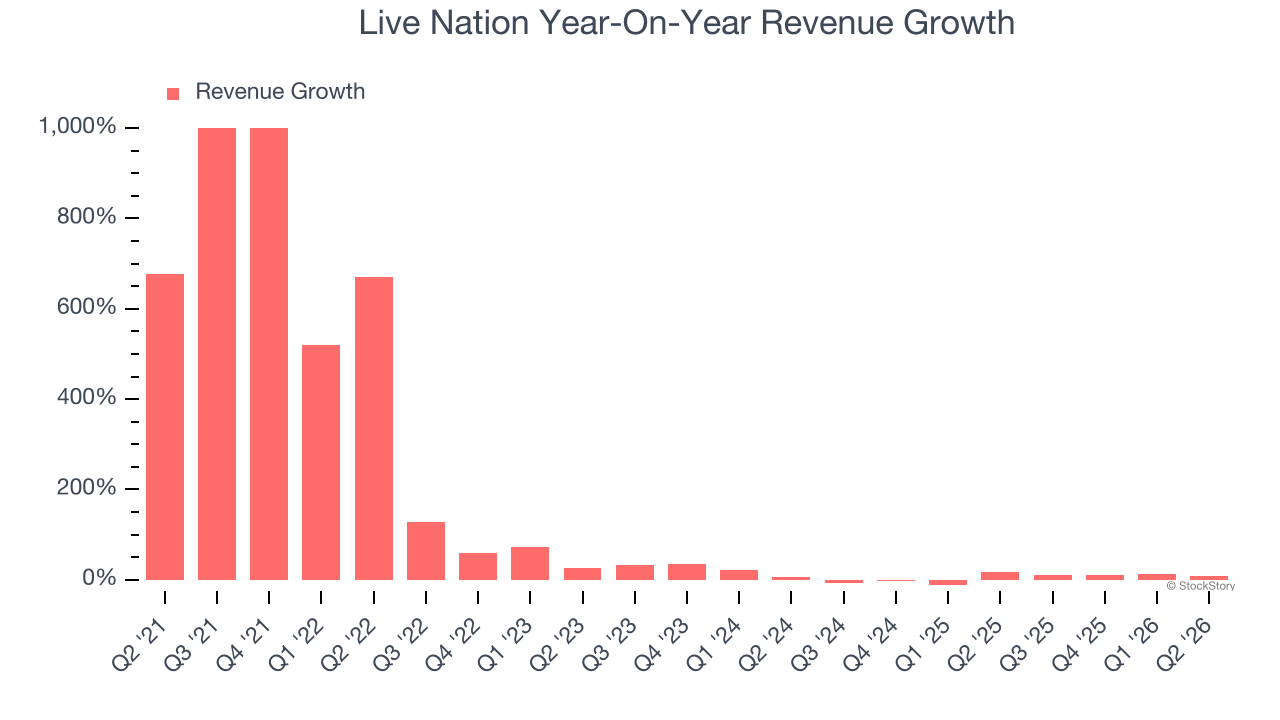
This quarter, Live Nation reported year-on-year revenue growth of 9.4%, and its $7.67 billion of revenue exceeded Wall Street’s estimates by 1.4%.
Looking ahead, sell-side analysts expect revenue to grow 10.2% over the next 12 months. Although this projection implies its newer products and services will spur better top-line performance, it is still below average for the sector.
ONE MORE THING: The $21 AI Application Stock Wall Street Forgot. While Wall Street obsesses over who’s building AI, one company is already using it to print money. And nobody’s paying attention.
AI chip stocks trade at ridiculous valuations. This company processes a trillion consumer signals monthly using AI and trades at a third of the price. The gap won’t last. The institutions will figure it out. You need to see this first. Read the FREE Report Before They Notice.
Operating Margin
Live Nation’s operating margin has been trending down over the last 12 months and averaged 3.6% over the last two years. Although this result isn’t good, the company’s elite historical revenue growth suggests it ramped up investments to capture market share. We’ll keep a close eye to see if this strategy pays off.
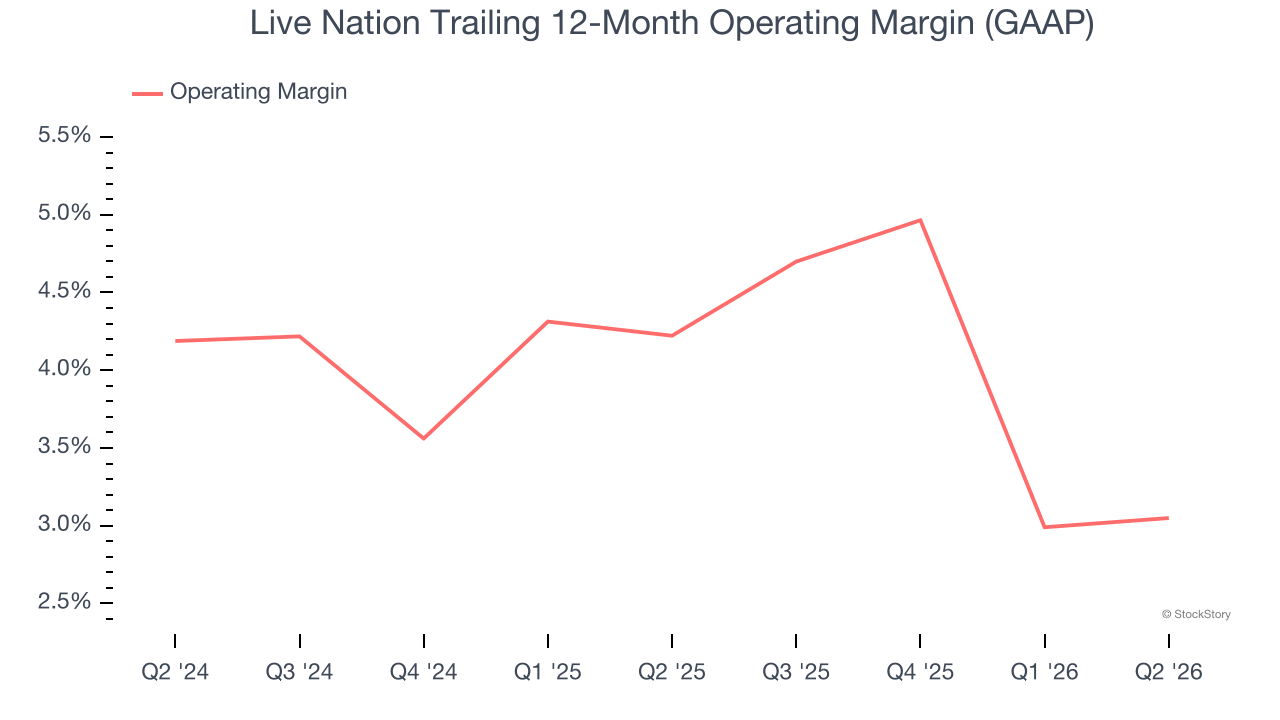
This quarter, Live Nation generated an operating margin profit margin of 6.8%, in line with the same quarter last year. This indicates the company’s overall cost structure has been relatively stable.
Earnings Per Share
We track the long-term change in earnings per share (EPS) for the same reason as long-term revenue growth. Compared to revenue, however, EPS highlights whether a company’s growth is profitable.
Although Live Nation’s full-year earnings are still negative, it reduced its losses and improved its EPS by 30.2% annually over the last five years. The next few quarters will be critical for assessing its long-term profitability.
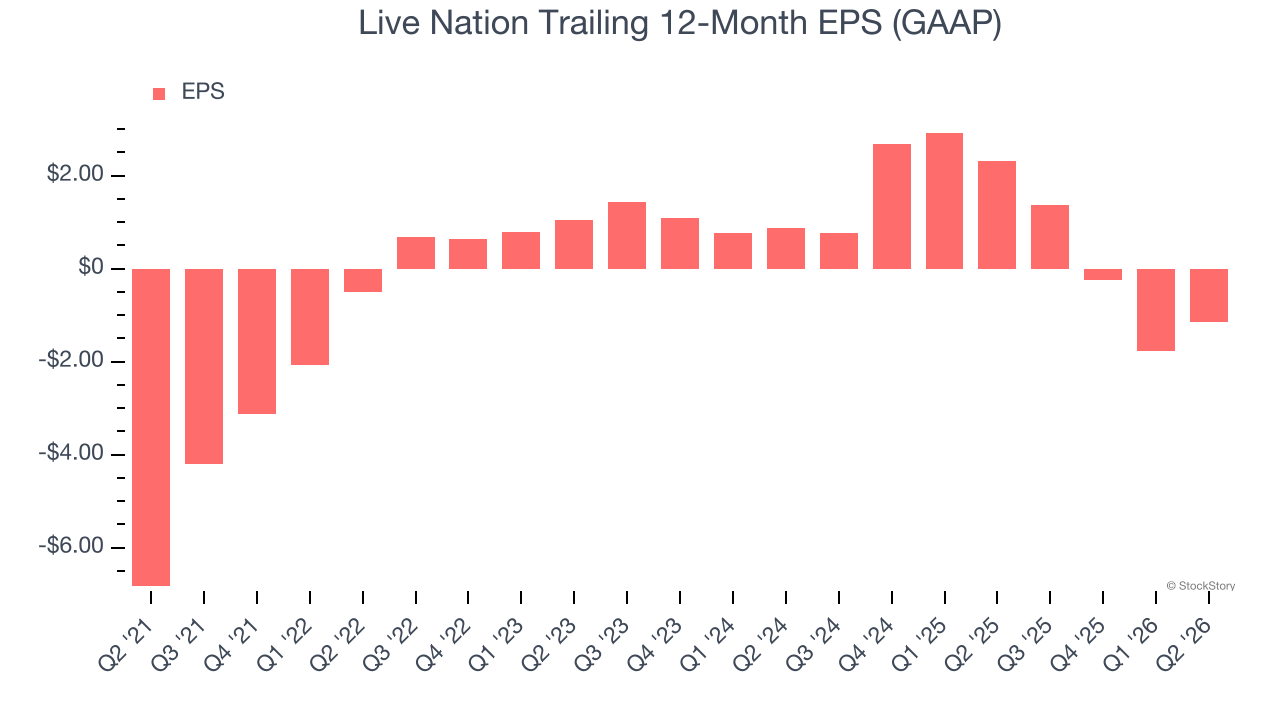
In Q2, Live Nation reported EPS of $1.05, up from $0.41 in the same quarter last year. This print easily cleared analysts’ estimates, and shareholders should be content with the results. Over the next 12 months, Wall Street is optimistic. Analysts forecast Live Nation’s full-year EPS will flip from negative $1.14 to positive $1.77.
Key Takeaways from Live Nation’s Q2 Results
It was good to see Live Nation beat analysts’ EPS expectations this quarter. We were also excited its adjusted operating income outperformed Wall Street’s estimates by a wide margin. Zooming out, we think this was a good print with some key areas of upside. The stock traded up 1.3% to $185.68 immediately after reporting.
Live Nation may have had a good quarter, but does that mean you should invest right now? When making that decision, it’s important to consider its valuation, business qualities, as well as what has happened in the latest quarter. We cover that in our actionable full research report which you can read here (it’s free).