
Energy infrastructure company The Williams Companies, Inc. (WMB) will report its fourth-quarter and full-year 2023 financial results tomorrow. Ahead of the earnings release, the company announced a 6.1% increase in its quarterly dividend to $0.4750 per share, payable to shareholders on March 25, 2024.
Its annual dividend of $1.90 yields 5.50% on the prevailing price, lower than the four-year average yield of 6.23%. Additionally, last month, WMB declared the closing of a major acquisition of a portfolio of natural gas storage assets from an affiliate of Hartree Partners LP for $1.95 billion, expected to cater to growing LNG demand.
However, the company possesses a higher-than-industry valuation and an ambiguous profitability scenario. Its forward EV/Sales and Price/Sales ratios of 6.18x and 3.81x are 216% and 183.9% higher than the respective industry averages of 1.96x and 1.34x.
On the other hand, WMB’s trailing-12-month gross profit margin of 58.92% is 27.9% higher than the industry average of 46.07%, while its asset turnover ratio of 0.21x is 62.1% lower than the 0.55x industry average.
Despite WMB’s dividend and recent acquisition, due to its stretched valuation and mixed profitability, it might be wise for investors to exercise caution and wait for a more opportune moment to invest in the stock.
Analyzing Williams Companies, Inc.'s Financial Performance Over a Two-year Period
The trailing-12-month net income of WMB showed a general upward trend over the provided two-year period from March 2021 to September 2023 with minor fluctuations. The net income started at $1.15 billion in March 2021 and increased to $2.71 billion by September 2023, with an overall growth rate of approximately 135%.
- From the first to the second quarter of 2021, the net income slightly increased from $1.15 billion to $1.16 billion.
- However, it experienced a slight drop in the third quarter of 2021 to $1.01 billion, followed by an increase to $1.52 billion at the end of 2021.
- In the first quarter of 2022, WMB’s net income decreased slightly again to $1.47 billion but rose consistently through the rest of 2022, culminating at $2.05 billion in December 2022, a clear upward trend for the year.
- The rising trend continued into 2023, with substantial increases seen each quarter. By the second quarter of 2023, the net income crossed the two-billion-dollar mark with a value of $2.66 billion.
- The highest value in this series was recorded in the third quarter of 2023, where the net income reached its peak at $2.71 billion.
In summary, WMB's net income reported fluctuations, especially in the year 2021, but a predominant upward direction highlights a positive financial performance with an increase in net income from $1.15 billion to $2.71 billion.

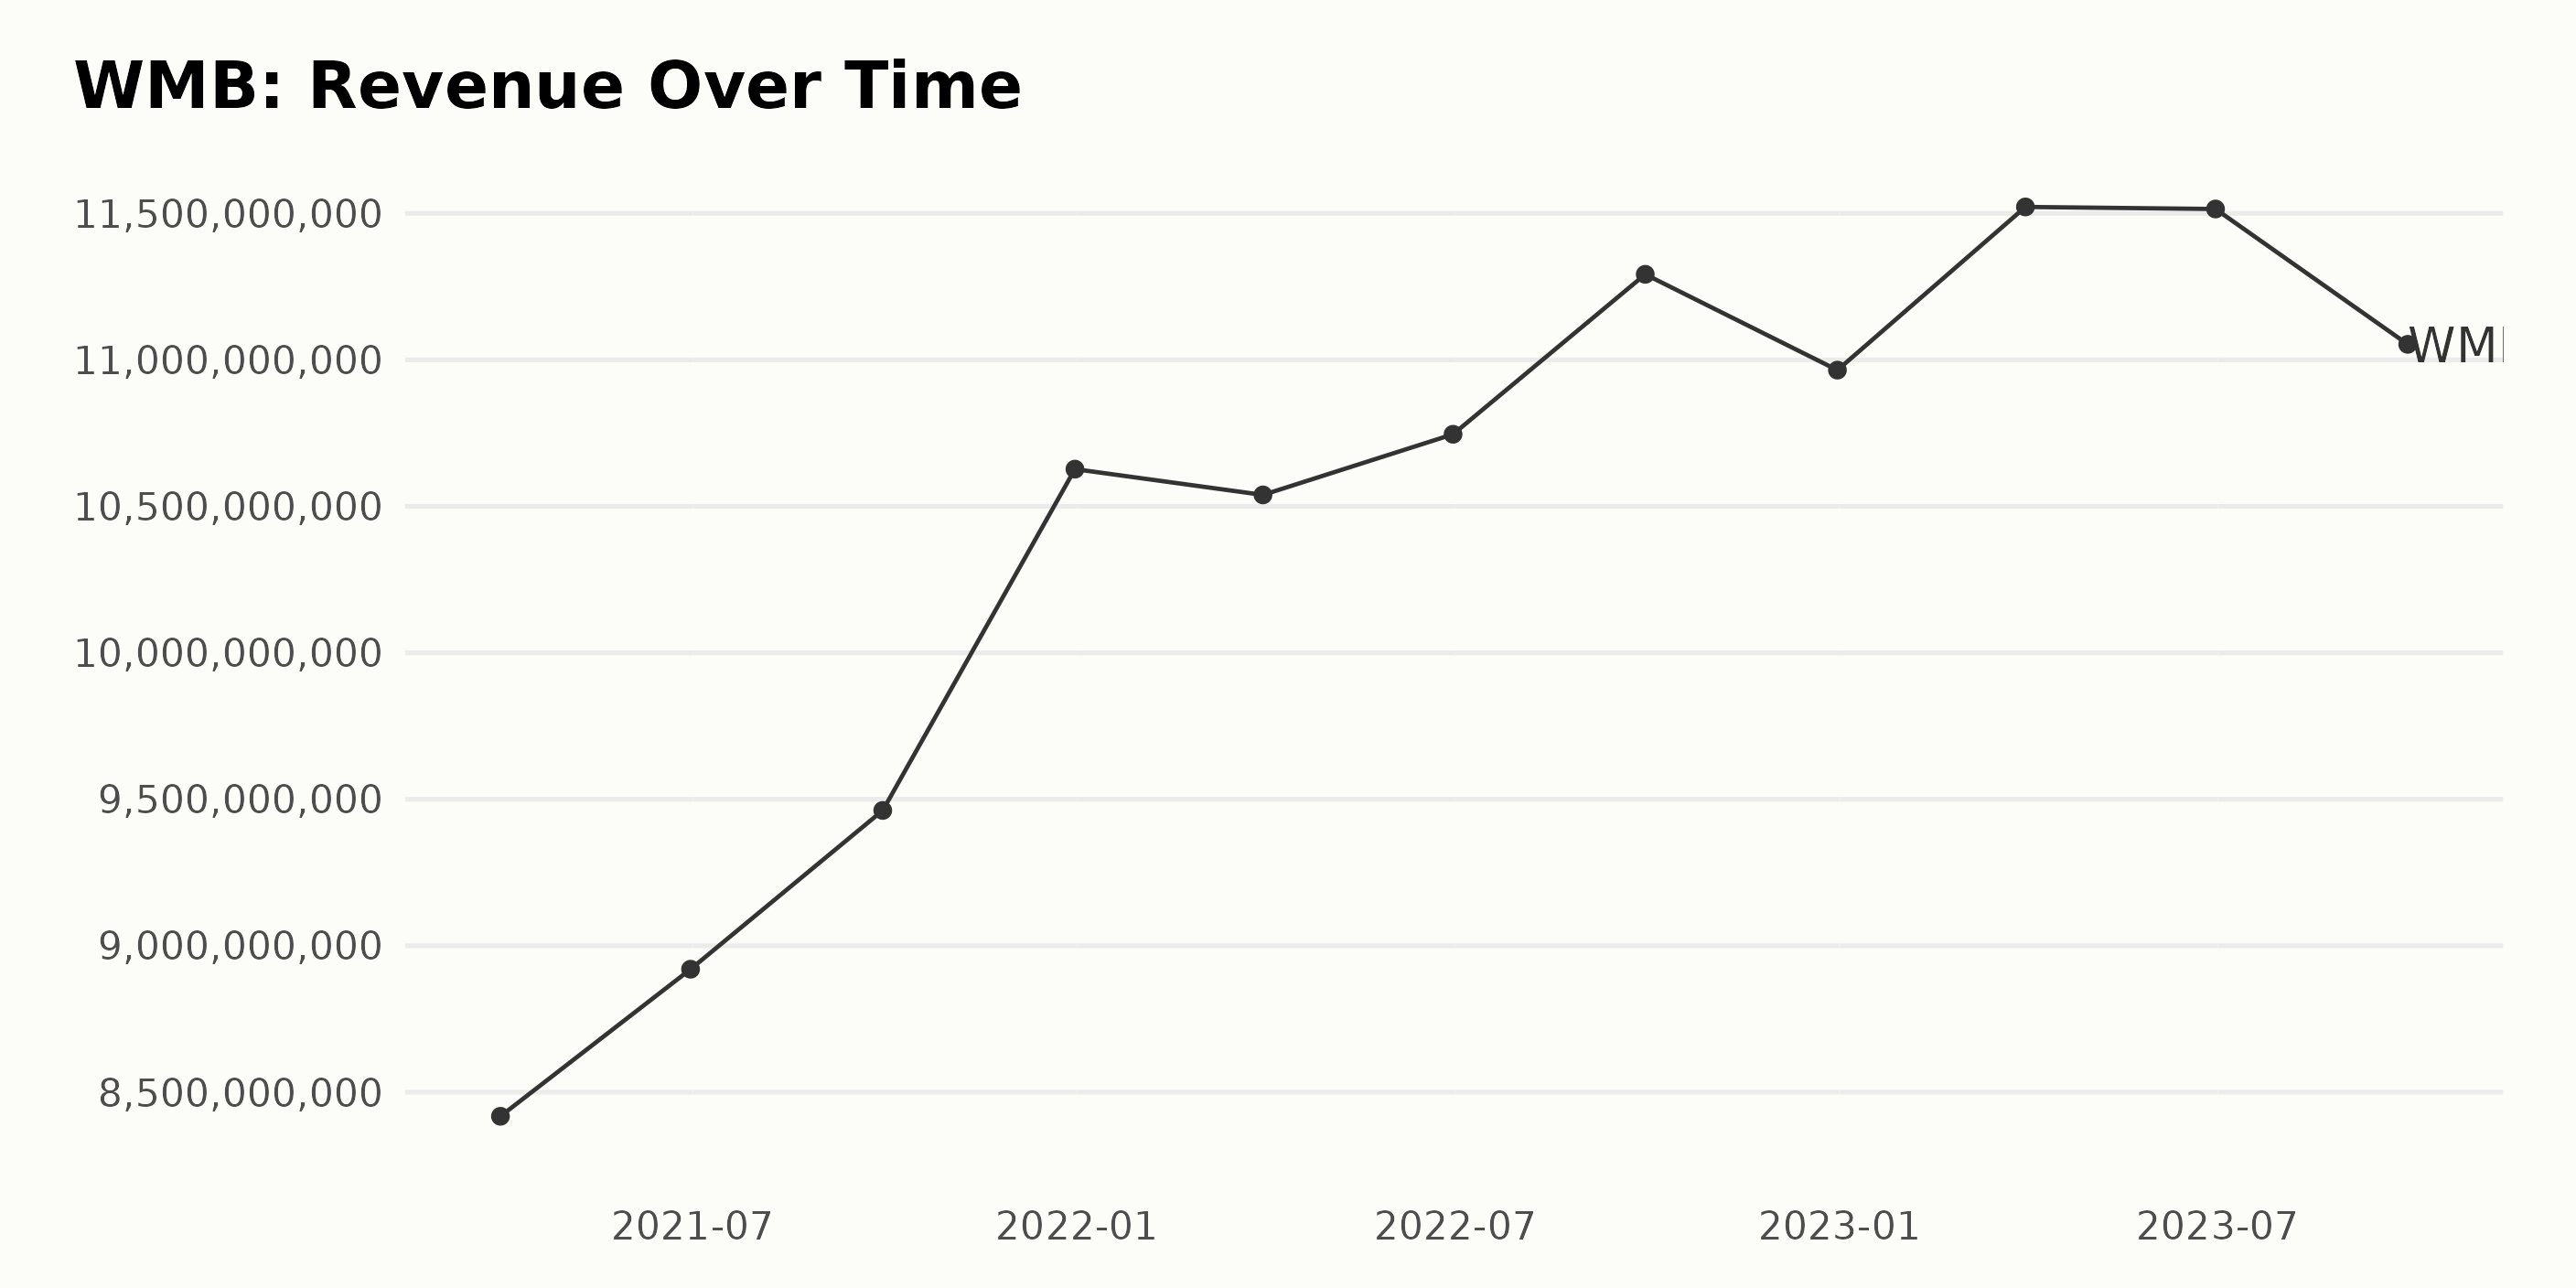
Based on the available data, the trailing-12-month revenue trend of WMB shows a general upward inclination between March 2021 and September 2023. Here are a few highlights:
- The revenue started at $8.42 billion in March 2021 and rose to $11.53 billion by March 2023. The growth was not linear but presented some fluctuations during this period.
- A noticeable drop in revenue from $10.62 billion in December 2021 to $10.54 billion in March 2022 was followed by a steady increase till September 2022, reaching $11.29 billion.
- The last quarter of 2022 saw another slight decrease in revenue to $10.96 billion before shooting up to its peak of $11.52 billion in March 2023.
- Unusually, the next quarter (June 2023) showed almost no change in revenue, maintaining the figure around $11.51 billion.
- By the end of the series in September 2023, the revenue fell slightly to $11.05 billion, still showing a net positive growth when compared with the first entry in March 2021.
Considering the starting and ending points of the data series, the overall growth rate of the revenue for WMB is approximately 31% over 2.5 years. It should be noted that while the overall trend is upward, periods of moderate volatility were witnessed throughout this time frame.
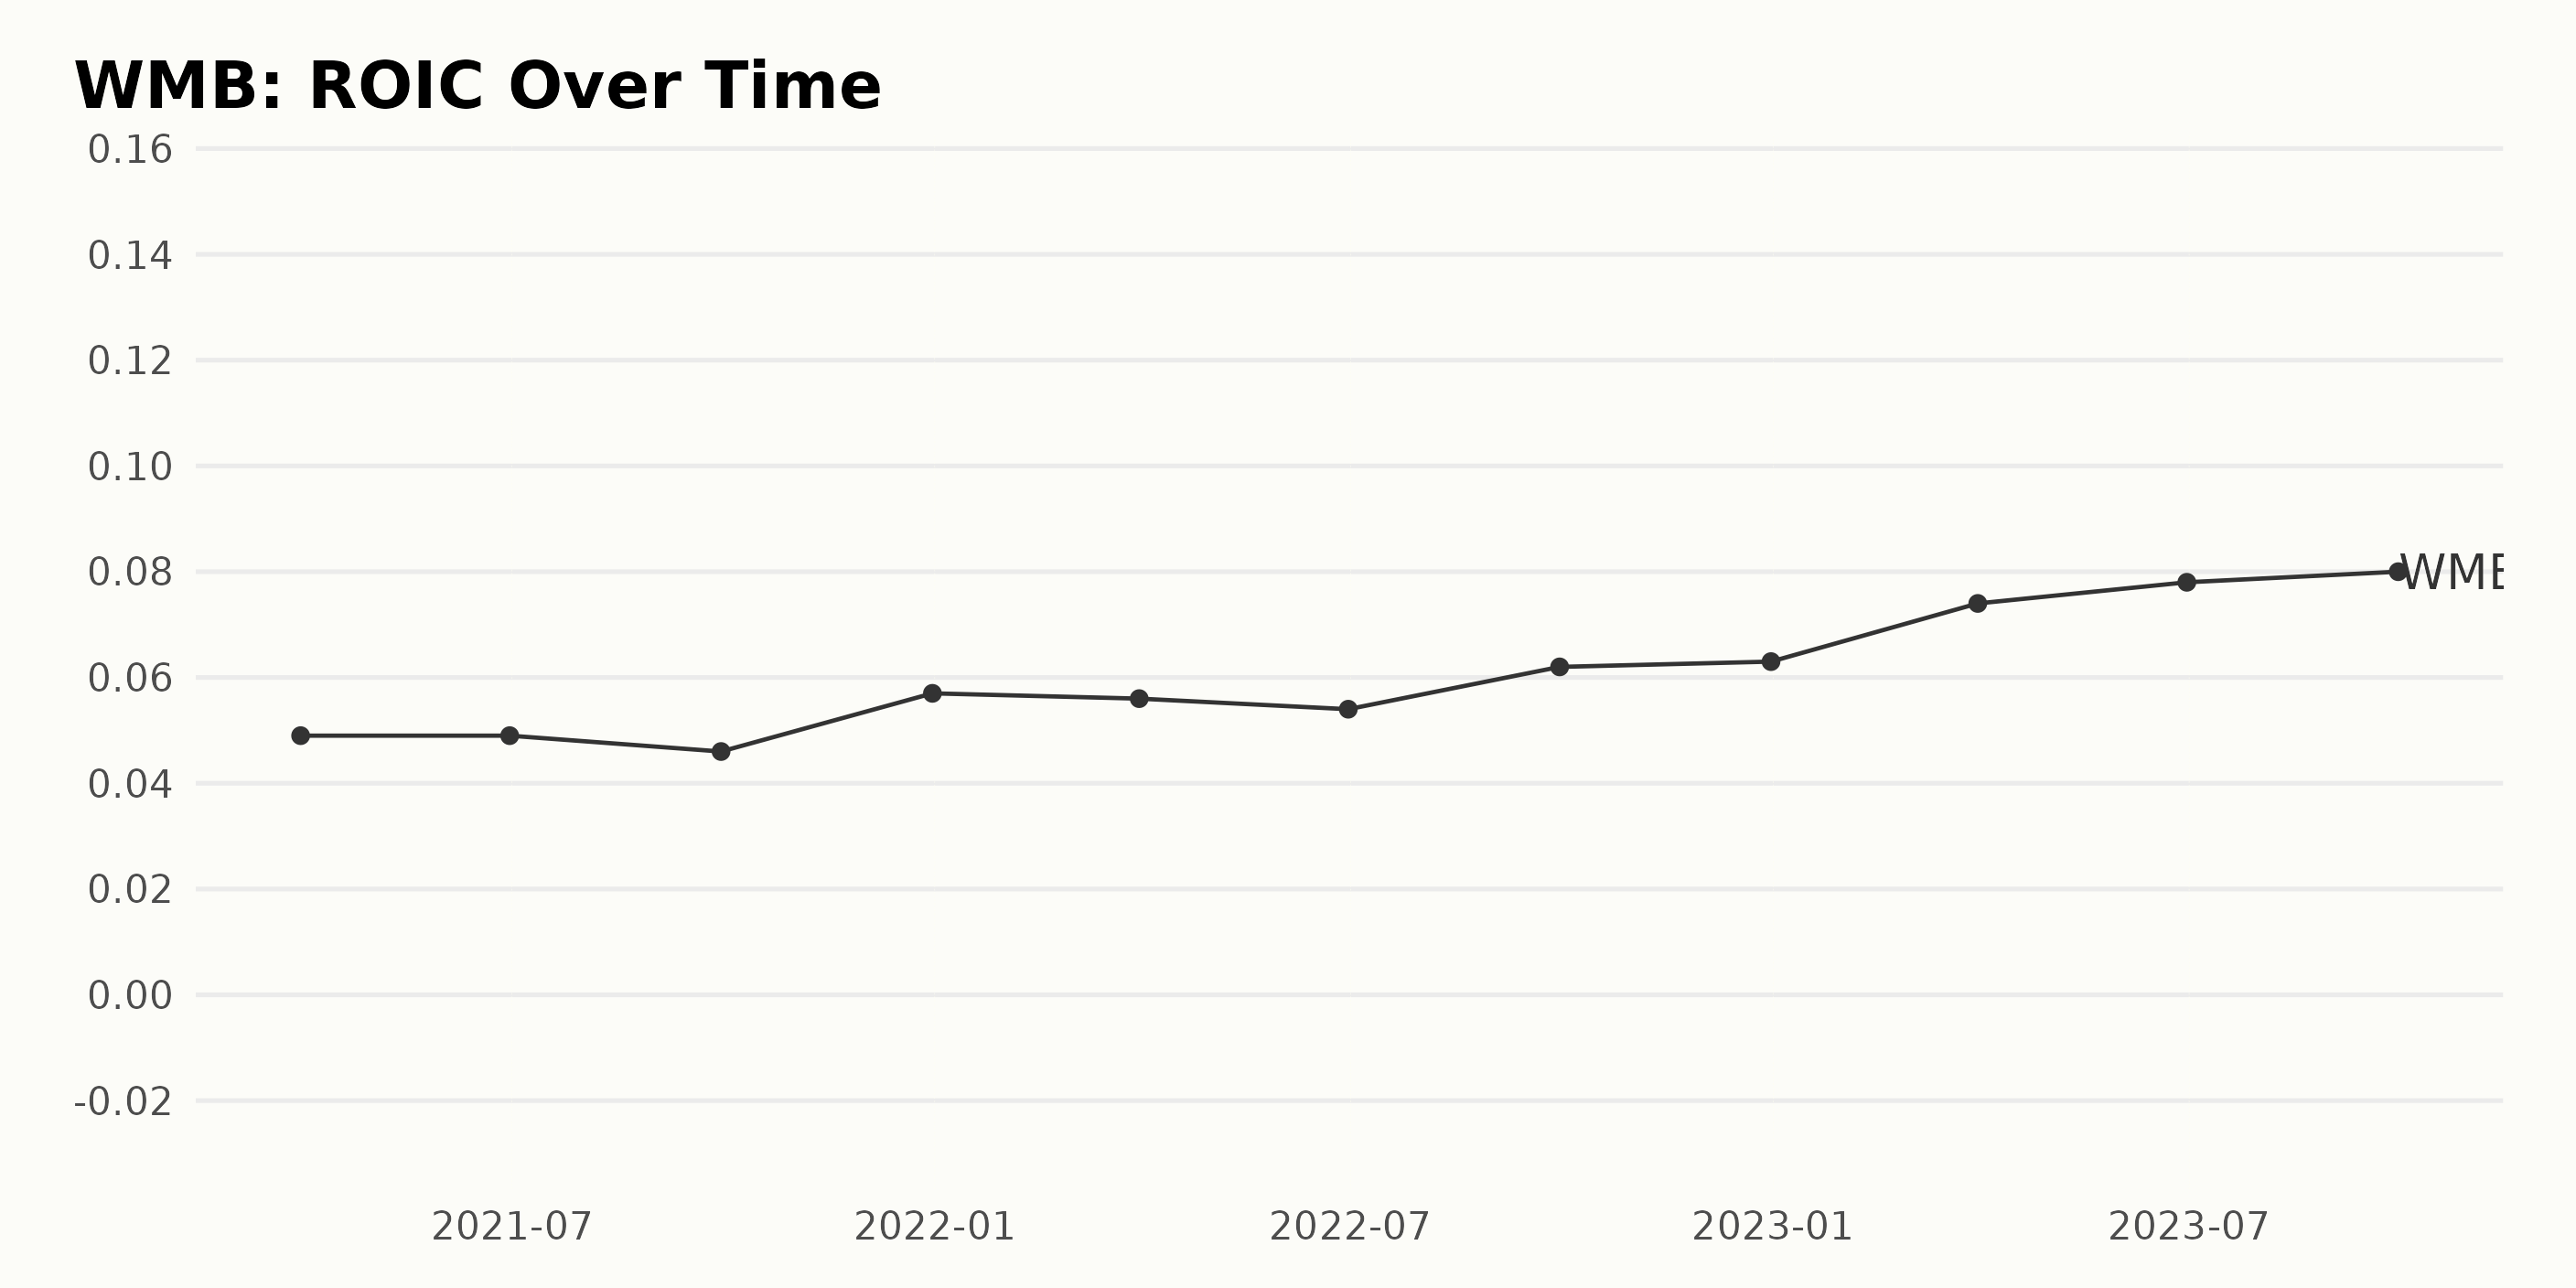
In analyzing the ROIC (Return On Invested Capital) trend for WMB from March 2021 through to September 2023, several important points emerge:
- The ROIC value in March 2021 was 4.9%, after which it stayed steady for the second quarter of 2021 before dipping slightly to 4.6% by the end of the third quarter.
- There was an upswing by year-end 2021 as the ROIC climbed to 5.7%
- Throughout 2022, there were minor fluctuations, with the value dropping initially to 5.6% in the first quarter, followed by a further decrease to 5.4% in the second quarter, and eventually rising to close the year at 6.3%.
- Notably, the year 2023 witnessed a steady increase in the ROIC throughout all three quarters reported, from 7.4% in the first quarter to 7.8% in the second quarter, reaching up to 8% by September 2023.
Taking the first value (March 2021, 4.9%) and the last value (September 2023, 8.0%), the growth rate over this period is approximately 63%. Therefore, while there are minor upheavals within the period, the overall trend sees WMB's ROIC experience reasonably consistent growth between March 2021 and September 2023.
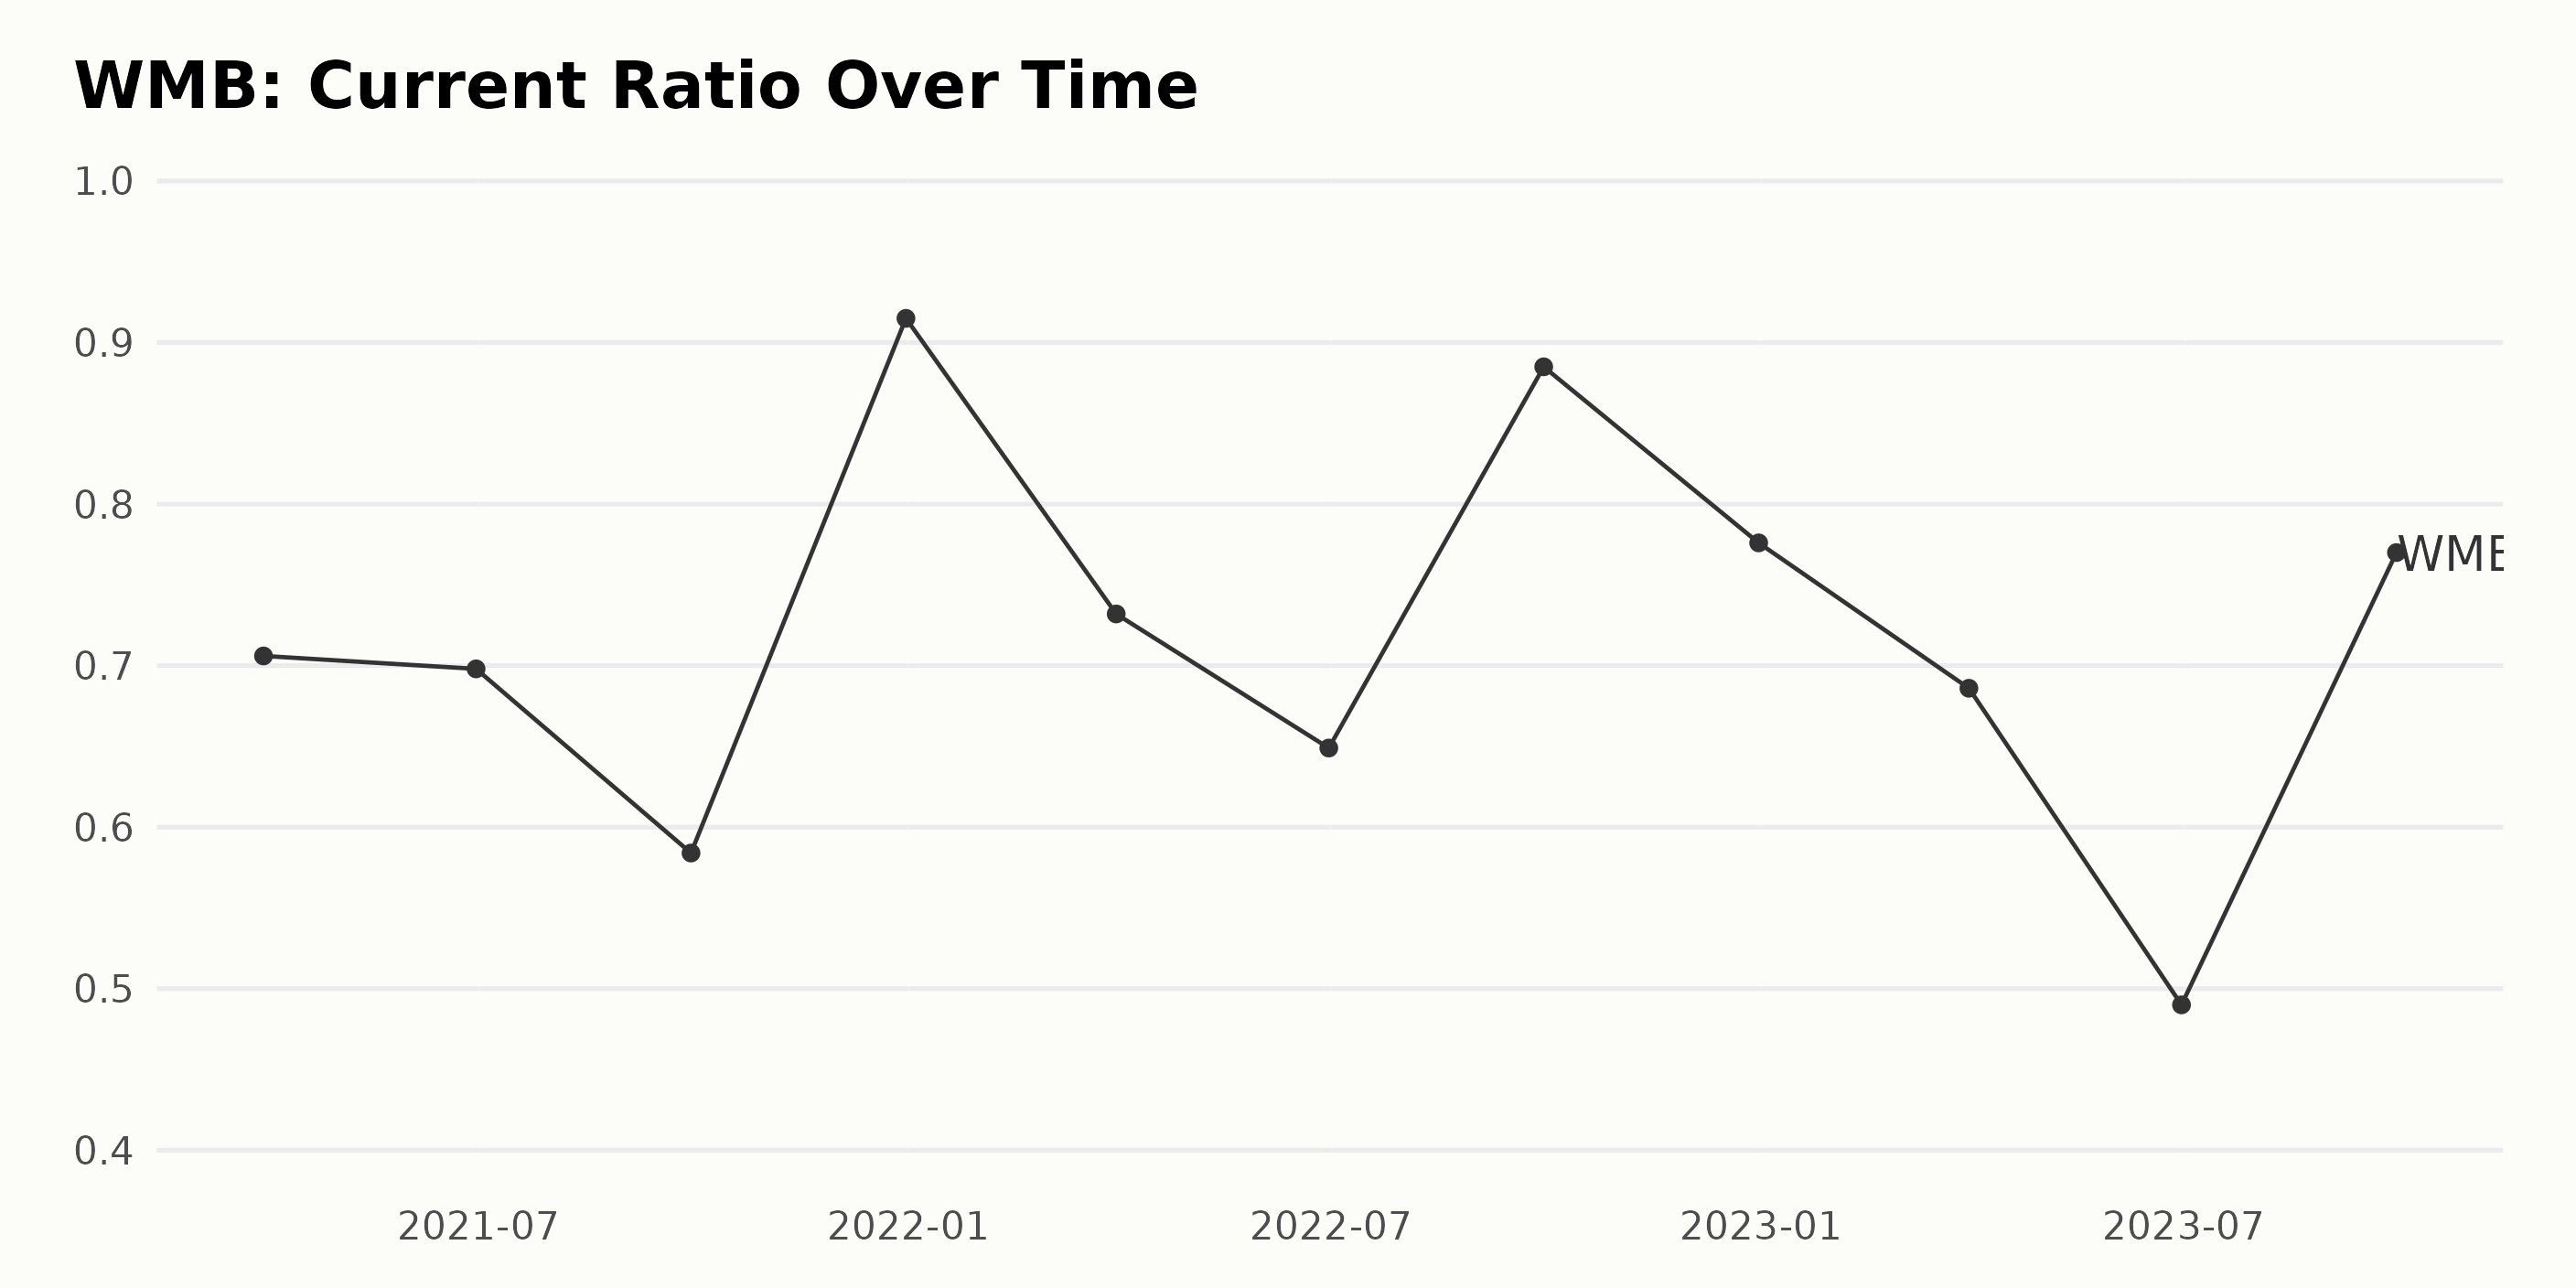
Over the course of this data series, the current ratio of WMB has witnessed notable fluctuations and a general downward trend. The significant dates and corresponding current ratios are as follows:
- On March 31, 2021, the current ratio was 0.71.
- On June 30, 2021, a slight decrease to 0.70 was seen.
- A more pronounced drop occurred on September 30, 2021, when the ratio declined to 0.58.
- The ratio then climbed significantly to 0.92 by December 31, 2021.
- Subsequently, it fell to 0.73 on March 31, 2022.
- On June 30, 2022, a further decrease to 0.65 was reported.
- However, there was a considerable rise on September 30, 2022, with the current ratio reaching 0.89.
- By December 31, 2022, it had dropped again to 0.78.
- In 2023, the ratio continued its fluctuations, decreasing to 0.69 on March 31, then declining further to 0.49 by June 30.
- On the latest reported date on, September 30, 2023, there was a significant rebound, bringing the ratio up to 0.77.
When calculating the growth rate from March 31, 2021 (0.71), to the last reported date on September 30, 2023 (0.77), there is an approximate 8.45% increase in the current ratio for WMB. However, this growth isn't consistent, as the ratio has experienced multiple rises and falls throughout the period.
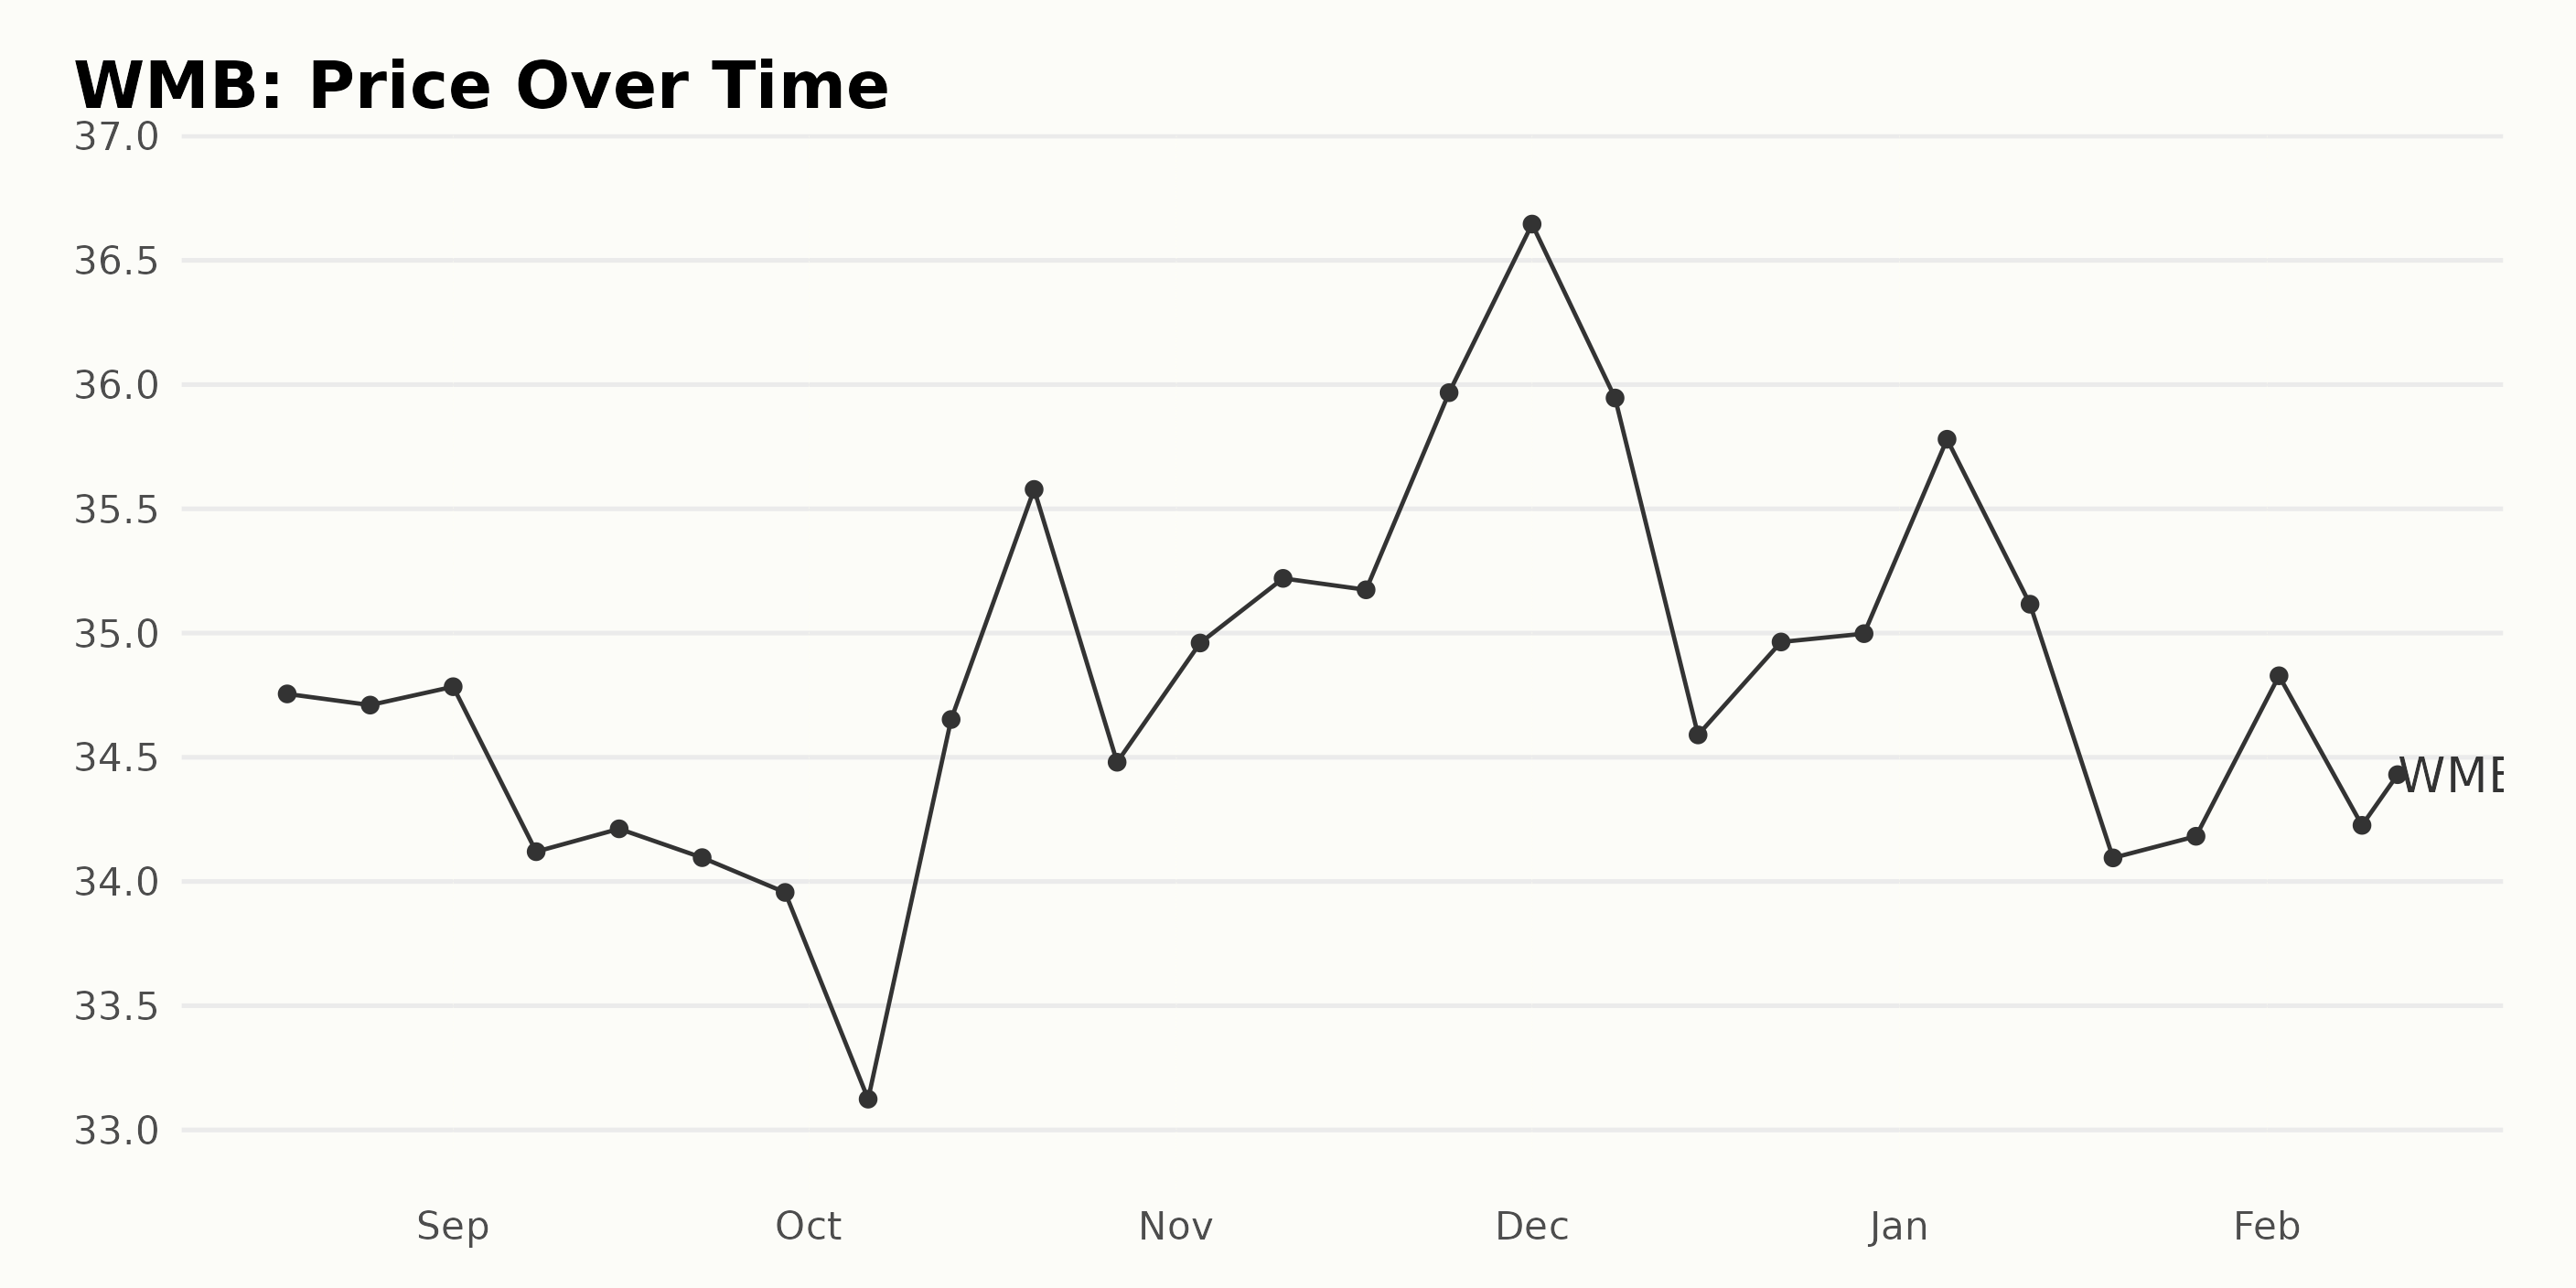
Reviewing WMB's Share Price Fluctuations: August 2023 - February 2024
Looking at the data, WMB did see some fluctuation in its share price between August 2023 and February 2024. Here are key takeaways:
- August 2023: The share price was relatively stable, decreasing slightly from $34.76 on August 18 to $34.71 on August 25.
- September 2023: A mild downtrend can be seen as the value dropped from $34.78 on the 1st to $33.96 on September 29.
- October 2023: Shares rebounded strongly in this month, starting at $33.12 on October 6 and reaching a peak of $35.58 on October 20 before pulling back slightly to $34.48 by the end of the month.
- November 2023: The share price exhibited a slight uptrend, increasing from $34.96 at the beginning of the month to $35.97 toward the end.
- December 2023: A sense of volatility comes into play, with the price going up to $36.65 before declining to $34.99 by month-end.
- January 2024: WMB experienced a minor downtrend as the price fell from $35.78 early on to $34.18 on January 26.
- Early February 2024: The month started with a share price of $34.83, decreasing to $34.55 on February 12.
There does not appear to be a clear and consistent growth rate nor an accelerating or decelerating trend in the share price over this period examined. Nonetheless, it is marked by intervals of both upswings and corrections. Here is a chart of WMB's price over the past 180 days.
Analyzing Williams Companies, Inc.'s Performance: Momentum, Quality, and Stability Ratings
When evaluating the POWR Ratings grade of WMB, it is noted that there has been a consistent C (Neutral) rating from August 19, 2023, through February 13, 2024. It is notable that this grade holds steady even as its rank within the Energy - Oil & Gas category fluctuates. Below are some key points regarding WMB's performance:
- On August 19, 2023, WMB had a rank of 34 out of 83 stocks in the Energy - Oil & Gas category.
- By September 30, 2023, WMB improved its standing, coming in at a rank of 27.
- However, the rank slipped back to 37 by October 14, 2023.
- The rank improved significantly by November 4, 2023, coming in at 19.
- Following a slight dip, by December 30, 2023, WMB steadied its rank at 23.
- As of the latest available data on February 13, 2024, WMB’s rank dropped to 30 while still maintaining a C (Neutral) POWR Grade.
It's critical to keep in mind that these rankings consistently placed WMB in the top half of all stocks within the Energy - Oil & Gas category. A C (Neutral) POWR Grade typically denotes an average forecasted result and is seen as neutral, suggesting holding positions or considering other stocks for new investments.
The POWR Ratings for WMB along the three most noteworthy dimensions are as follows:
Momentum: The company scored the highest in Momentum. In August 2023, the momentum was at a value of 87. It continued to rise in the subsequent months, reaching 92 in November 2023 before declining slightly to 88 in December 2023. As of January 12, 2024, the Momentum value stands at 85. This trend suggests continuously strong performance in this dimension.
Quality: Quality is another dimension where the company has been performing well. The quality values have been consistently high, showing a minor fluctuation from 79 in August 2023 to 80 in January 2024. This indicates a stable and high-Quality operational capacity of the firm.
Stability: The Stability rating of WMB has shown a progressive increase over time. From a value of 57 in August 2023, it rose steadily to attain a value of 72 by January 12, 2024. This signifies that the company has shown incremental improvements in its stability over the period evaluated.
It's worth noting that while Momentum has had the highest values among the three dimensions discussed, the improving trend in the company's Stability makes it a noteworthy facet of its performance. The maintenance of high Quality scores also indicates a consistently sound operational parameter.

How does The Williams Companies, Inc. (WMB) Stack Up Against its Peers?
Other stocks in the Energy - Oil & Gas sector that may be worth considering are Secure Energy Services Inc. (SECYF), Cheniere Energy, Inc. (LNG), and Weatherford International plc (WFRD) - they have better POWR Ratings. Click here to explore more Energy - Oil & Gas stocks.
What To Do Next?
Get your hands on this special report with 3 low priced companies with tremendous upside potential even in today’s volatile markets:
3 Stocks to DOUBLE This Year >
WMB shares were trading at $34.24 per share on Tuesday morning, down $0.31 (-0.90%). Year-to-date, WMB has declined -1.69%, versus a 4.22% rise in the benchmark S&P 500 index during the same period.
About the Author: Anushka Dutta

Anushka is an analyst whose interest in understanding the impact of broader economic changes on financial markets motivated her to pursue a career in investment research.
The post Williams Companies (WMB) Earnings Watch: Strategies for Energy Investors appeared first on StockNews.com