

Aerospace and defense company HEICO (NSYE:HEI) beat Wall Street’s revenue expectations in Q3 CY2025, with sales up 19.3% year on year to $1.21 billion. Its GAAP profit of $1.33 per share was 8.9% above analysts’ consensus estimates.
Is now the time to buy HEICO? Find out by accessing our full research report, it’s free for active Edge members.
HEICO (HEI) Q3 CY2025 Highlights:
- Revenue: $1.21 billion vs analyst estimates of $1.17 billion (19.3% year-on-year growth, 3.2% beat)
- EPS (GAAP): $1.33 vs analyst estimates of $1.22 (8.9% beat)
- Adjusted EBITDA: $331.4 million vs analyst estimates of $319.5 million (27.4% margin, 3.7% beat)
- Operating Margin: 23.1%, up from 21.6% in the same quarter last year
- Free Cash Flow Margin: 22.2%, up from 18.7% in the same quarter last year
- Market Capitalization: $37.12 billion
Company Overview
Founded in 1957, HEICO (NYSE: HEI) manufactures and services aerospace and electronic components for commercial aviation, defense, space, and other industries.
Revenue Growth
A company’s long-term sales performance can indicate its overall quality. Any business can put up a good quarter or two, but many enduring ones grow for years. Luckily, HEICO’s sales grew at an incredible 20.2% compounded annual growth rate over the last five years. Its growth surpassed the average industrials company and shows its offerings resonate with customers, a great starting point for our analysis.
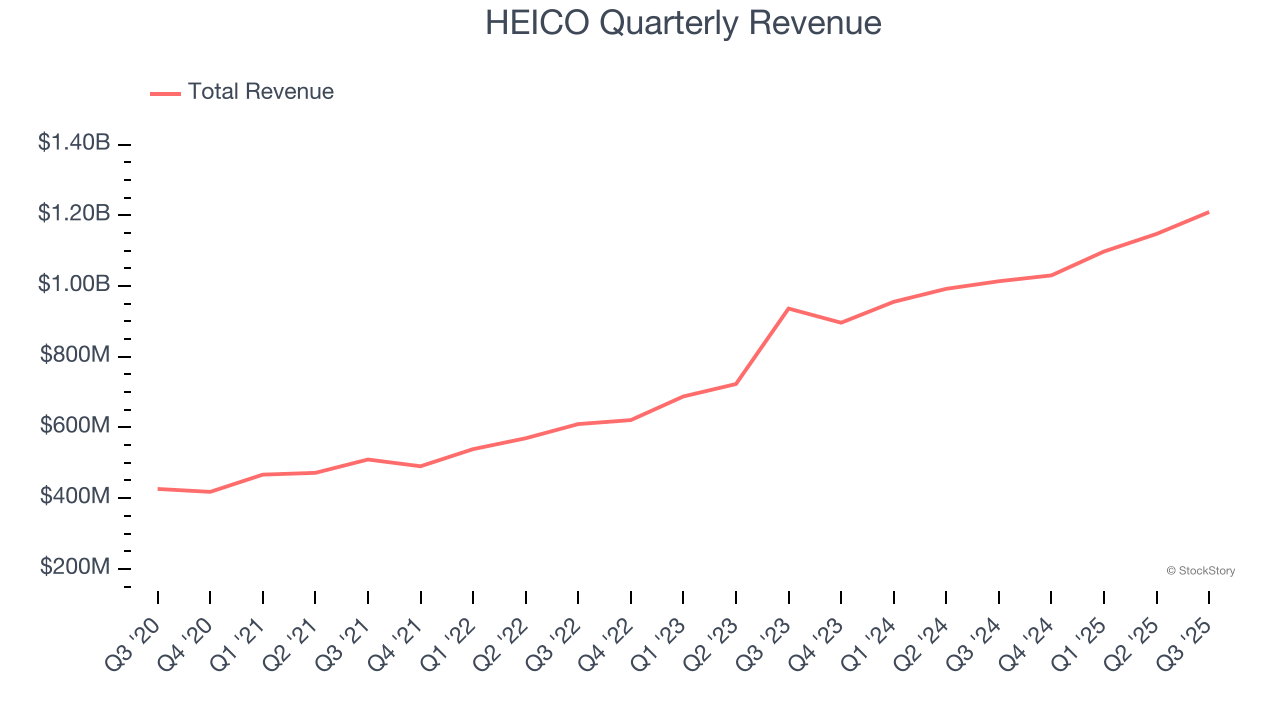
Long-term growth is the most important, but within industrials, a half-decade historical view may miss new industry trends or demand cycles. HEICO’s annualized revenue growth of 22.9% over the last two years is above its five-year trend, suggesting its demand was strong and recently accelerated. 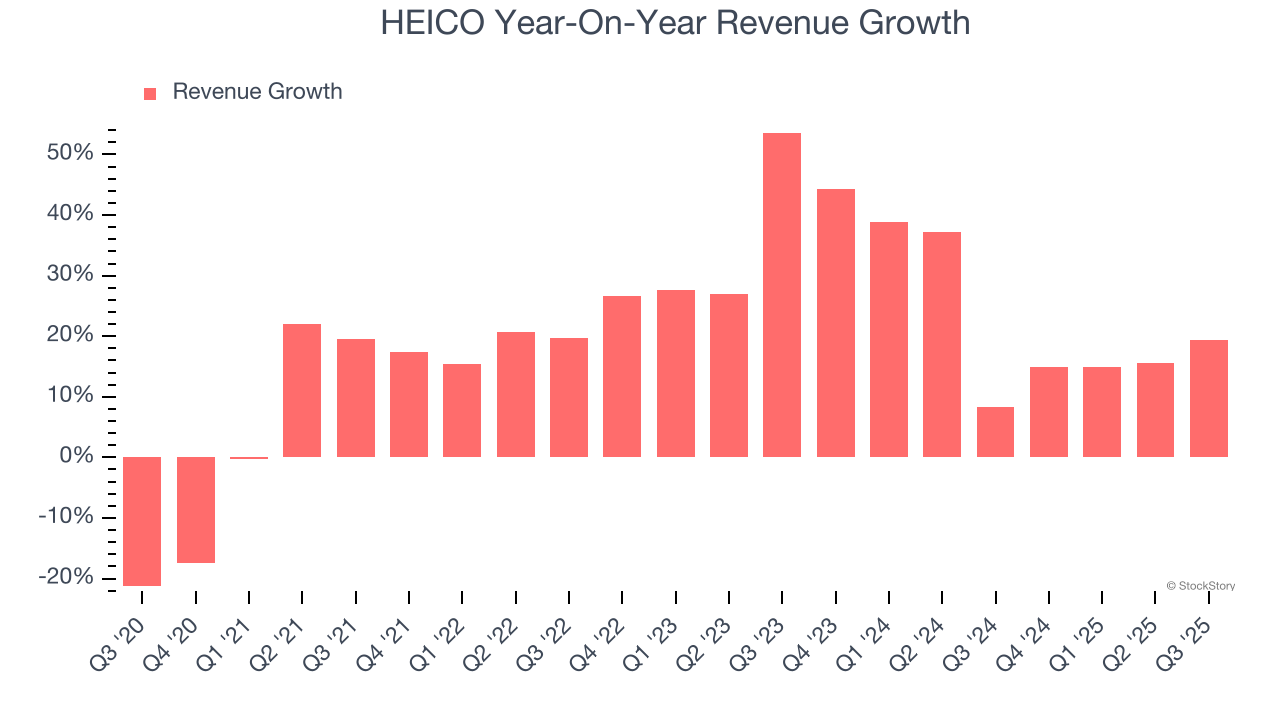
This quarter, HEICO reported year-on-year revenue growth of 19.3%, and its $1.21 billion of revenue exceeded Wall Street’s estimates by 3.2%.
Looking ahead, sell-side analysts expect revenue to grow 9.4% over the next 12 months, a deceleration versus the last two years. Still, this projection is commendable and indicates the market is baking in success for its products and services.
Software is eating the world and there is virtually no industry left that has been untouched by it. That drives increasing demand for tools helping software developers do their jobs, whether it be monitoring critical cloud infrastructure, integrating audio and video functionality, or ensuring smooth content streaming. Click here to access a free report on our 3 favorite stocks to play this generational megatrend.
Operating Margin
Operating margin is a key measure of profitability. Think of it as net income - the bottom line - excluding the impact of taxes and interest on debt, which are less connected to business fundamentals.
HEICO has been a well-oiled machine over the last five years. It demonstrated elite profitability for an industrials business, boasting an average operating margin of 21.8%.
Analyzing the trend in its profitability, HEICO’s operating margin rose by 1.7 percentage points over the last five years, as its sales growth gave it operating leverage.
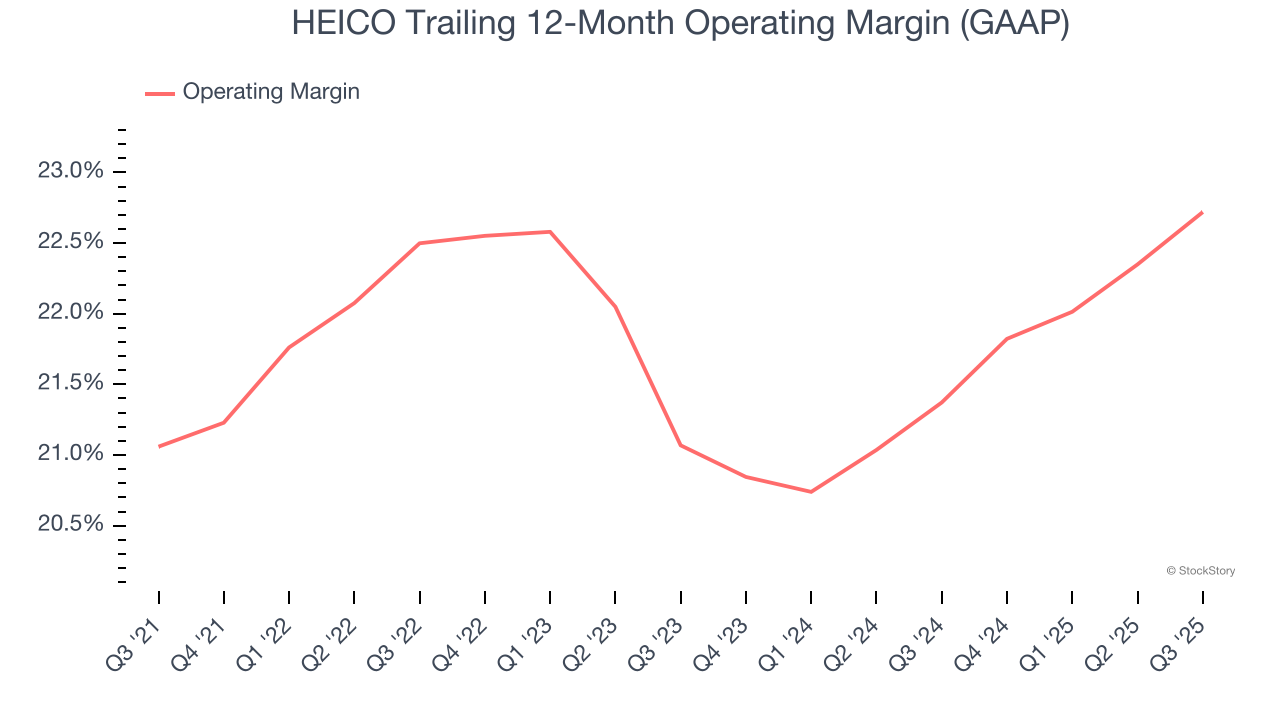
In Q3, HEICO generated an operating margin profit margin of 23.1%, up 1.5 percentage points year on year. This increase was a welcome development and shows it was more efficient.
Earnings Per Share
Revenue trends explain a company’s historical growth, but the long-term change in earnings per share (EPS) points to the profitability of that growth – for example, a company could inflate its sales through excessive spending on advertising and promotions.
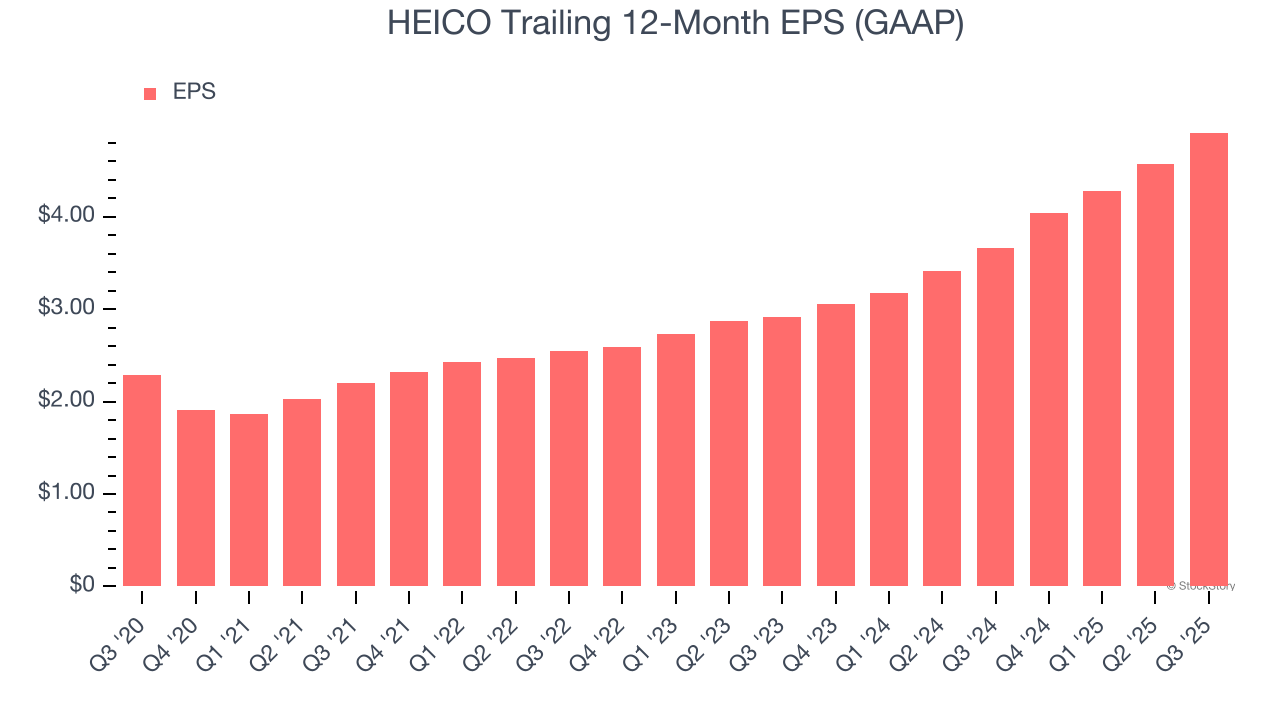
HEICO’s EPS grew at a spectacular 16.5% compounded annual growth rate over the last five years. Despite its operating margin improvement during that time, this performance was lower than its 20.2% annualized revenue growth, telling us that non-fundamental factors such as interest and taxes affected its ultimate earnings.
We can take a deeper look into HEICO’s earnings quality to better understand the drivers of its performance. A five-year view shows HEICO has diluted its shareholders, growing its share count by 2.6%. This dilution overshadowed its increased operational efficiency and has led to lower per share earnings. Taxes and interest expenses can also affect EPS but don’t tell us as much about a company’s fundamentals. 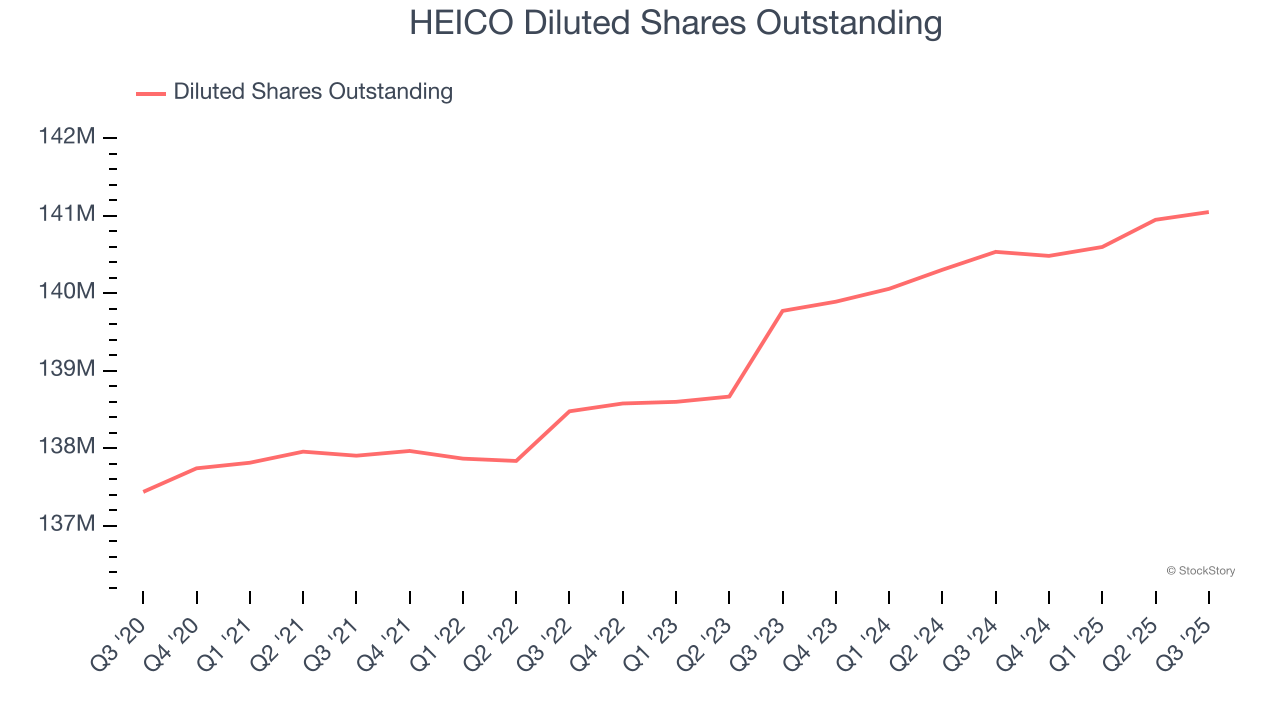
Like with revenue, we analyze EPS over a more recent period because it can provide insight into an emerging theme or development for the business.
For HEICO, its two-year annual EPS growth of 29.9% was higher than its five-year trend. We love it when earnings growth accelerates, especially when it accelerates off an already high base.
In Q3, HEICO reported EPS of $1.33, up from $0.99 in the same quarter last year. This print beat analysts’ estimates by 8.9%. Over the next 12 months, Wall Street expects HEICO’s full-year EPS of $4.91 to grow 10.2%.
Key Takeaways from HEICO’s Q3 Results
We enjoyed seeing HEICO beat analysts’ revenue expectations this quarter. We were also happy its EPS outperformed Wall Street’s estimates. Zooming out, we think this quarter featured some important positives. The stock remained flat at $309.03 immediately after reporting.
HEICO had an encouraging quarter, but one earnings result doesn’t necessarily make the stock a buy. Let’s see if this is a good investment. We think that the latest quarter is only one piece of the longer-term business quality puzzle. Quality, when combined with valuation, can help determine if the stock is a buy. We cover that in our actionable full research report which you can read here, it’s free for active Edge members.


