
Specialty insurance provider Skyward Specialty Insurance (NASDAQ: SKWD) beat Wall Street’s revenue expectations in Q4 CY2025, with sales up 26.7% year on year to $385.6 million. Its non-GAAP profit of $1.17 per share was 14.9% above analysts’ consensus estimates.
Is now the time to buy Skyward Specialty Insurance? Find out by accessing our full research report, it’s free.
Skyward Specialty Insurance (SKWD) Q4 CY2025 Highlights:
- Net Premiums Earned: $356.8 million vs analyst estimates of $356.5 million (21.7% year-on-year growth, in line)
- Revenue: $385.6 million vs analyst estimates of $380.5 million (26.7% year-on-year growth, 1.3% beat)
- Combined Ratio: 88.5% vs analyst estimates of 90.9% (241.4 basis point beat)
- Adjusted EPS: $1.17 vs analyst estimates of $1.02 (14.9% beat)
- Book Value per Share: $24.92 vs analyst estimates of $23.51 (25.9% year-on-year growth, 6% beat)
- Market Capitalization: $2.07 billion
Skyward Group Chairman and CEO Andrew Robinson commented, “The fourth quarter was another excellent quarter and capped off a truly transformational year for the Company. Similar to the previous three quarters, we delivered Company bests in adjusted operating income(1), underwriting income(1) and the combined ratio of 88.5%. Our gross written premiums growth in the quarter of 13% culminated a year of 24% growth, and our return on equity and return on tangible equity of 18.9% and 20.9%(1) respectively for the full year are simply outstanding.”
Company Overview
Founded in 2006 to serve markets where standard insurance coverage falls short, Skyward Specialty Insurance (NASDAQ: SKWD) provides customized commercial property, casualty, and health insurance solutions for underserved or specialized market niches.
Revenue Growth
Insurance companies generate revenue three ways. The first is the core insurance business itself, represented in the income statement as premiums earned. The second source is investment income from investing the “float” (premiums collected but not yet paid out as claims) in assets such as fixed-income assets and equities. The third is fees from policy administration, annuities, and other value-added services. Over the last four years, Skyward Specialty Insurance grew its revenue at an incredible 26.7% compounded annual growth rate. Its growth surpassed the average insurance company and shows its offerings resonate with customers, a great starting point for our analysis.
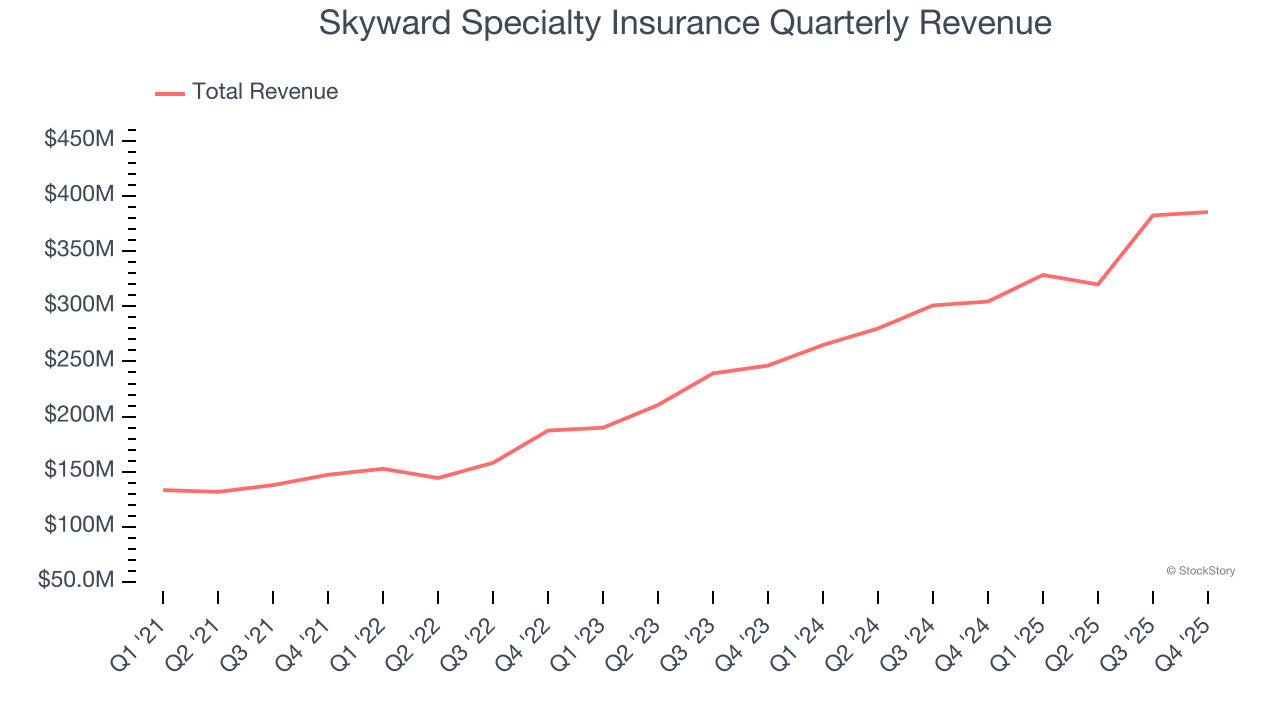
Long-term growth is the most important, but within financials, a stretched historical view may miss recent interest rate changes and market returns. Skyward Specialty Insurance’s annualized revenue growth of 26.4% over the last two years aligns with its four-year trend, suggesting its demand was predictably strong. 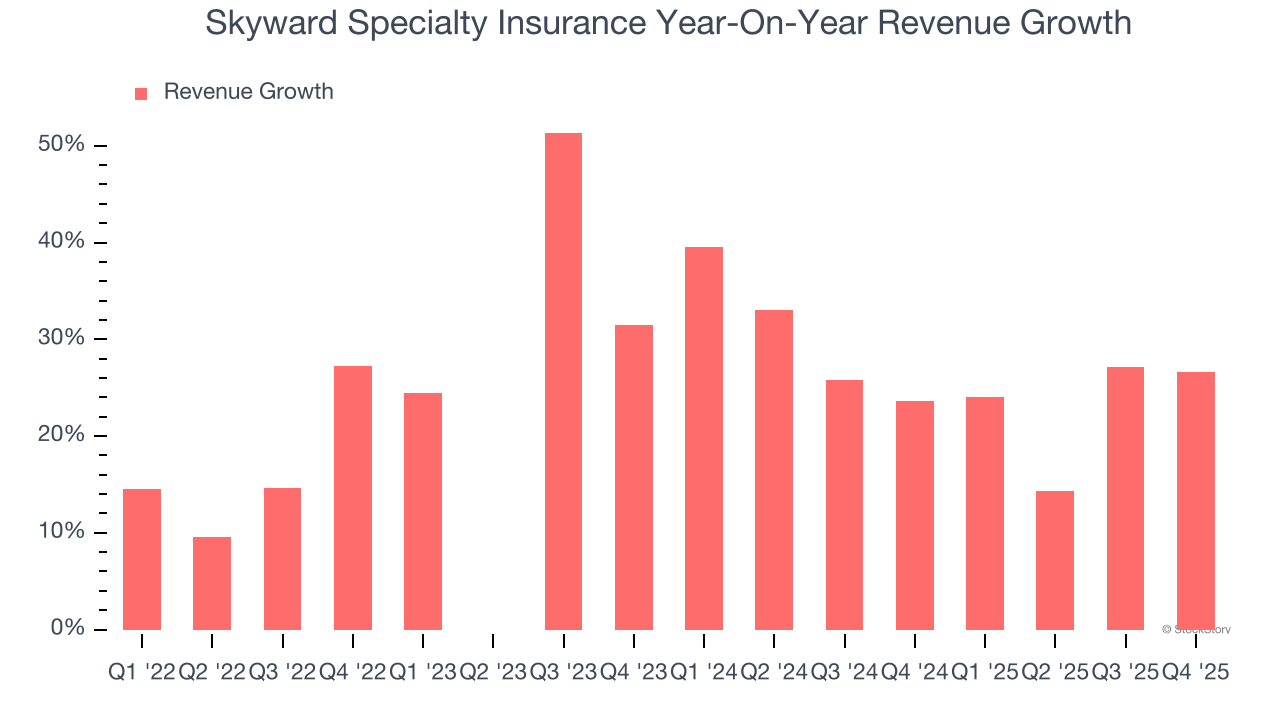 Note: Quarters not shown were determined to be outliers, impacted by outsized investment gains/losses that are not indicative of the recurring fundamentals of the business.
This quarter, Skyward Specialty Insurance reported robust year-on-year revenue growth of 26.7%, and its $385.6 million of revenue topped Wall Street estimates by 1.3%.
Net premiums earned made up 92.7% of the company’s total revenue during the last five years, meaning Skyward Specialty Insurance lives and dies by its underwriting activities because non-insurance operations barely move the needle.
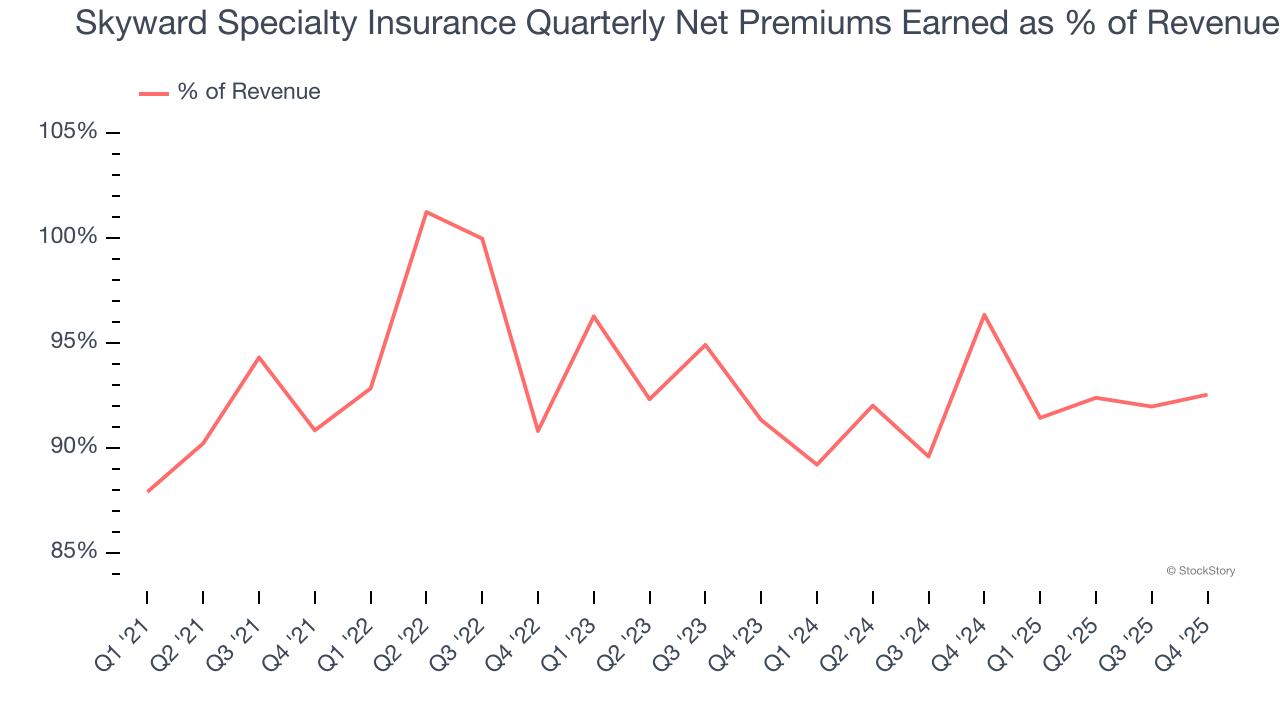
Our experience and research show the market cares primarily about an insurer’s net premiums earned growth as investment and fee income are considered more susceptible to market volatility and economic cycles.
Microsoft, Alphabet, Coca-Cola, Monster Beverage—all began as under-the-radar growth stories riding a massive trend. We’ve identified the next one: a profitable AI semiconductor play Wall Street is still overlooking. Go here for access to our full report.
Book Value Per Share (BVPS)
Insurers are balance sheet businesses, collecting premiums upfront and paying out claims over time. Premiums collected but not yet paid out, often referred to as the float, are invested and create an asset base supported by a liability structure. Book value per share (BVPS) captures this dynamic by measuring these assets (investment portfolio, cash, reinsurance recoverables) less liabilities (claim reserves, debt, future policy benefits). BVPS is essentially the residual value for shareholders.
We therefore consider BVPS very important to track for insurers and a metric that sheds light on business quality because it reflects long-term capital growth and is harder to manipulate than more commonly-used metrics like EPS.
Skyward Specialty Insurance’s BVPS was flat over the last four years. However, BVPS growth has accelerated recently, growing by 22.6% annually over the last two years from $16.58 to $24.92 per share.
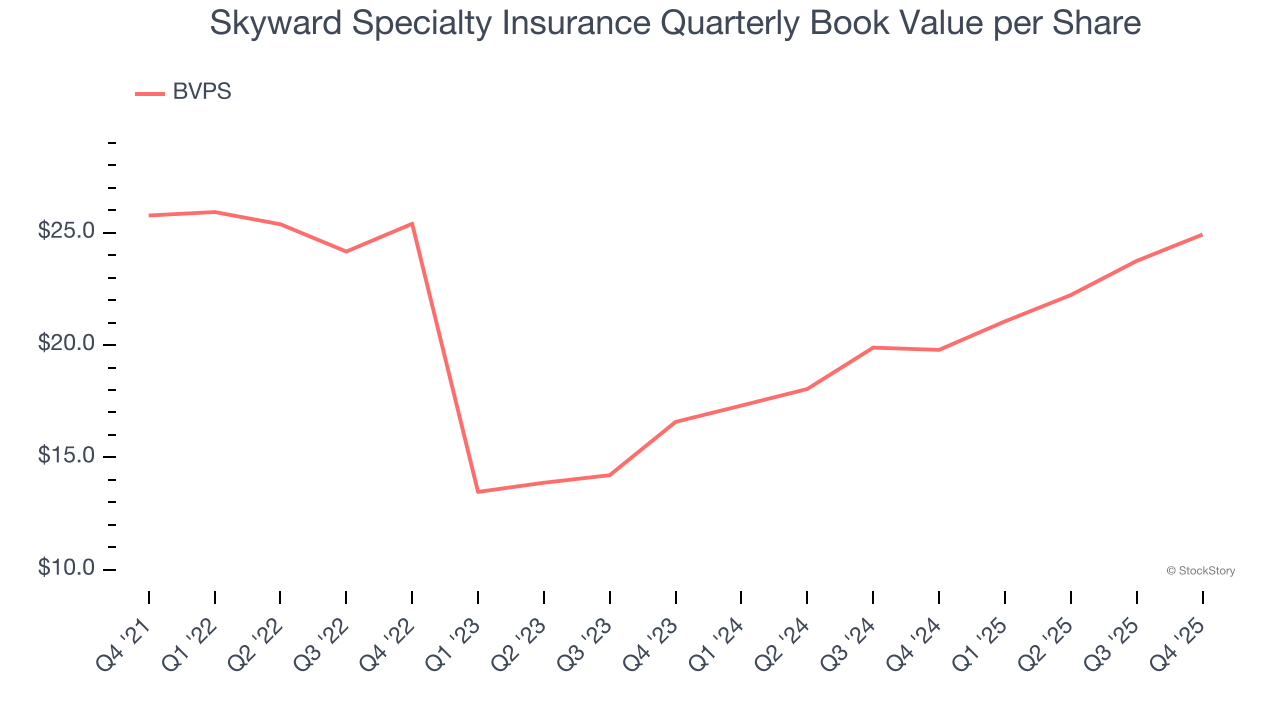
Over the next 12 months, Consensus estimates call for Skyward Specialty Insurance’s BVPS to grow by 21.3% to $23.51, elite growth rate.
Key Takeaways from Skyward Specialty Insurance’s Q4 Results
We were impressed by how significantly Skyward Specialty Insurance blew past analysts’ book value per share expectations this quarter. We were also glad its EPS outperformed Wall Street’s estimates. Zooming out, we think this was a solid print. The stock remained flat at $47.50 immediately following the results.
Skyward Specialty Insurance had an encouraging quarter, but one earnings result doesn’t necessarily make the stock a buy. Let’s see if this is a good investment. When making that decision, it’s important to consider its valuation, business qualities, as well as what has happened in the latest quarter. We cover that in our actionable full research report which you can read here (it’s free).