

Safety and specialty services provider APi (NYSE: APG) reported Q1 CY2026 results topping the market’s revenue expectations, with sales up 15.3% year on year to $1.98 billion. Guidance for next quarter’s revenue was optimistic at $2.2 billion at the midpoint, 2.6% above analysts’ estimates. Its non-GAAP profit of $0.32 per share was 5.3% above analysts’ consensus estimates.
Is now the time to buy APi? Find out by accessing our full research report, it’s free.
APi (APG) Q1 CY2026 Highlights:
- Revenue: $1.98 billion vs analyst estimates of $1.92 billion (15.3% year-on-year growth, 3.5% beat)
- Adjusted EPS: $0.32 vs analyst estimates of $0.30 (5.3% beat)
- Adjusted EBITDA: $235 million vs analyst estimates of $228.9 million (11.9% margin, 2.7% beat)
- The company slightly lifted its revenue guidance for the full year to $8.58 billion at the midpoint from $8.5 billion
- EBITDA guidance for Q2 CY2026 is $305 million at the midpoint, in line with analyst expectations
- Operating Margin: 5.2%, in line with the same quarter last year
- Free Cash Flow Margin: 3.4%, similar to the same quarter last year
- Organic Revenue rose 10.4% year on year (beat)
- Market Capitalization: $20.99 billion
Russ Becker, APi’s President and Chief Executive Officer, stated: "We are off to a strong start in 2026, delivering 10% organic net revenue growth and expanding adjusted EBITDA margins by 70 basis points year over year, with strength across both our Safety Services and Specialty Services segments. At the same time, we continued to advance our M&A strategy. We closed the CertaSite acquisition and signed transactions for Wtech and Onyx, representing an investment of more than $1 billion across these three acquisitions to further build out our Safety Services segment across the U.S., Europe, and Canada. In a year that marks APi's 100th anniversary, I am proud of our team's execution, and we remain confident in our path toward our "10/16/60+" targets.
Company Overview
Started in 1926 as an insulation contractor, APi (NYSE: APG) provides life safety solutions and specialty services for buildings and infrastructure.
Revenue Growth
Reviewing a company’s long-term sales performance reveals insights into its quality. Any business can experience short-term success, but top-performing ones enjoy sustained growth for years. Thankfully, APi’s 18.6% annualized revenue growth over the last five years was incredible. Its growth beat the average industrials company and shows its offerings resonate with customers, a helpful starting point for our analysis.
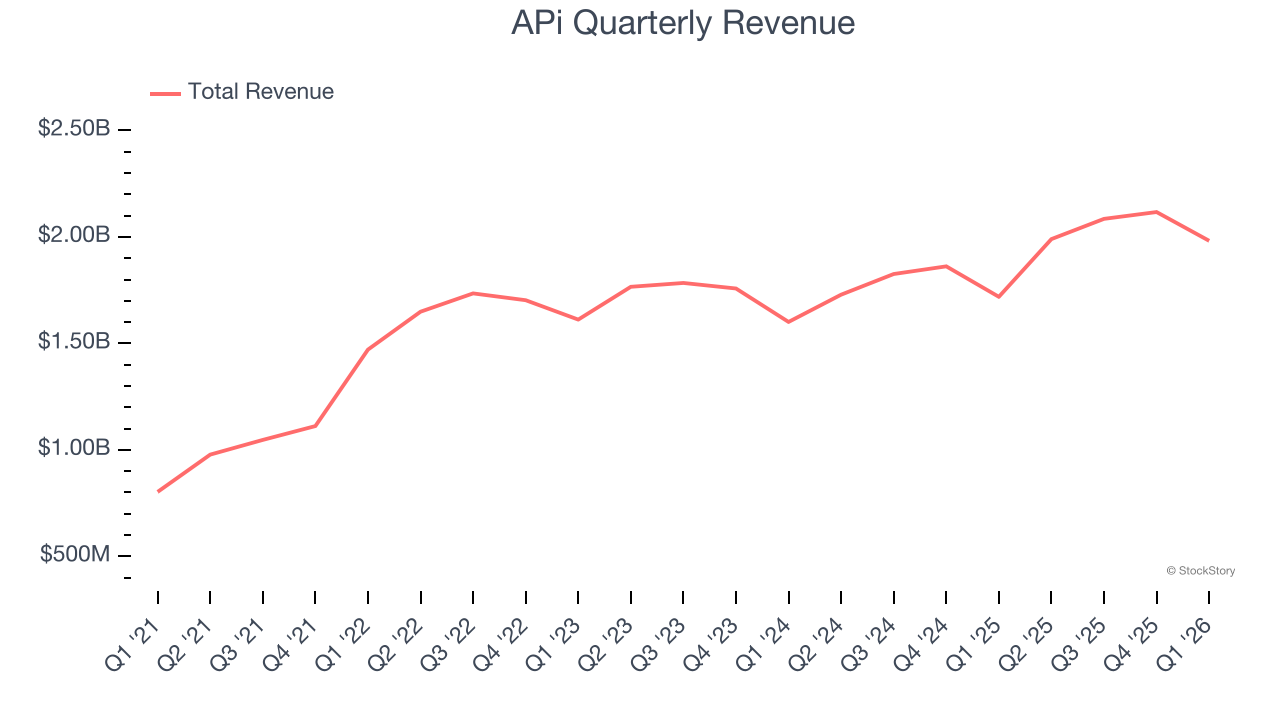
Long-term growth is the most important, but within industrials, a half-decade historical view may miss new industry trends or demand cycles. APi’s annualized revenue growth of 8.8% over the last two years is below its five-year trend, but we still think the results were respectable. 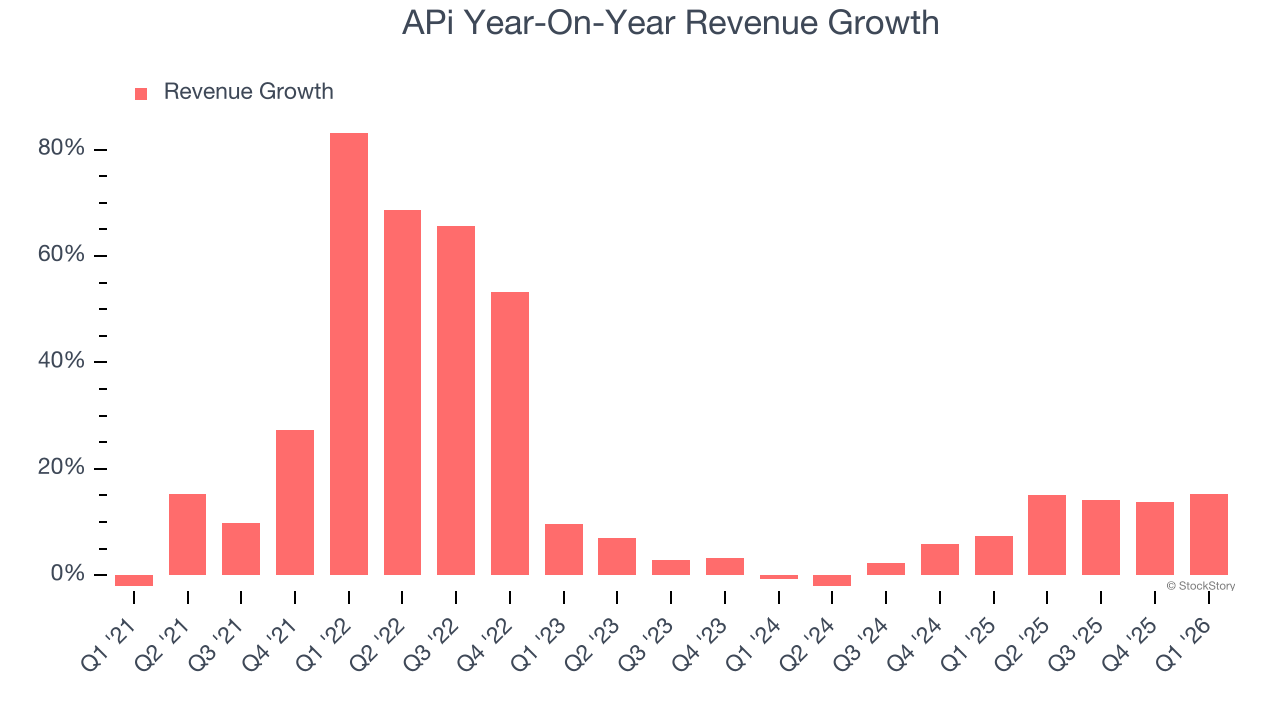
We can better understand the company’s sales dynamics by analyzing its organic revenue, which strips out one-time events like acquisitions and currency fluctuations that don’t accurately reflect its fundamentals. Over the last two years, APi’s organic revenue averaged 4.9% year-on-year growth. Because this number is lower than its two-year revenue growth, we can see that some mixture of acquisitions and foreign exchange rates boosted its headline results. 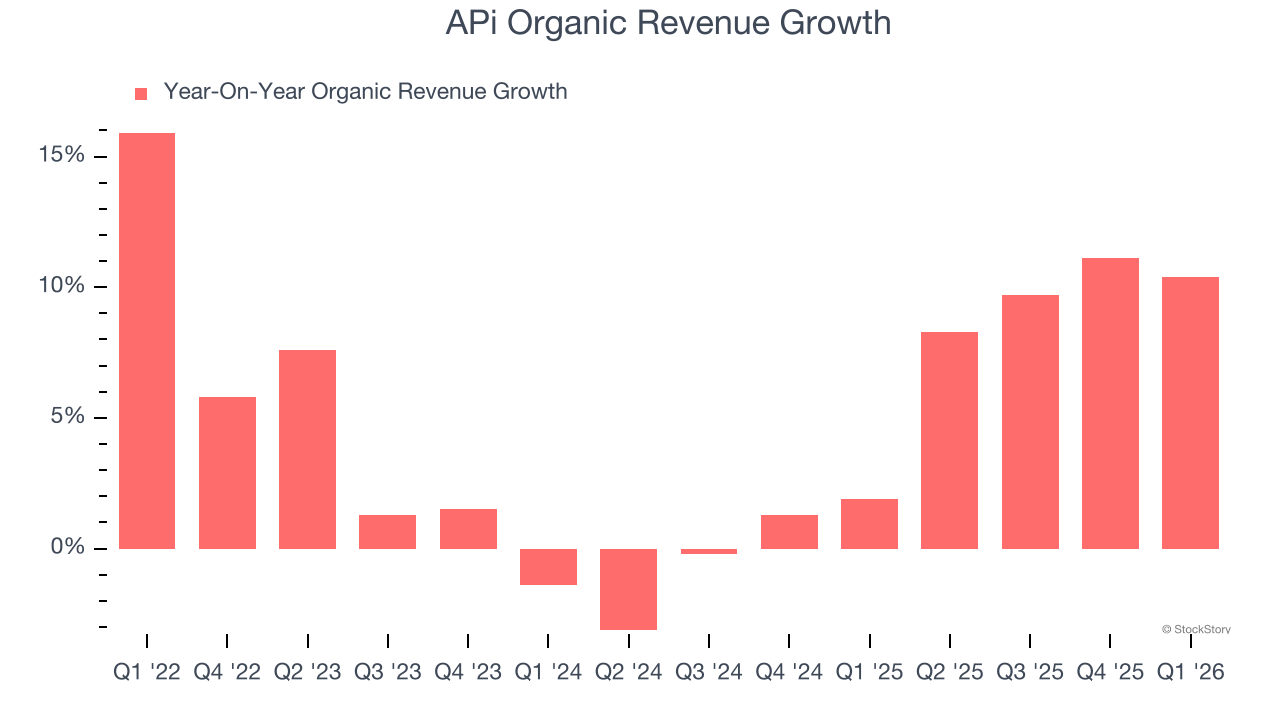
This quarter, APi reported year-on-year revenue growth of 15.3%, and its $1.98 billion of revenue exceeded Wall Street’s estimates by 3.5%. Company management is currently guiding for a 10.6% year-on-year increase in sales next quarter.
Looking further ahead, sell-side analysts expect revenue to grow 5.4% over the next 12 months, a deceleration versus the last two years. This projection doesn't excite us and suggests its products and services will face some demand challenges. At least the company is tracking well in other measures of financial health.
WHILE YOU’RE HERE: The Next Palantir? One satellite company captures images of every point on Earth. Every single day. The Pentagon wants it. Hedge funds are using it to beat earnings. You’ve probably never heard of it.
This is what the early days of Palantir looked like before it became a $437 billion giant. Same playbook. Different technology. If you missed Palantir, you need to see this. Claim The Stock Ticker for Free HERE.
Operating Margin
APi was profitable over the last five years but held back by its large cost base. Its average operating margin of 5.3% was weak for an industrials business. This result isn’t too surprising given its low gross margin as a starting point.
On the plus side, APi’s operating margin rose by 4.2 percentage points over the last five years, as its sales growth gave it operating leverage.
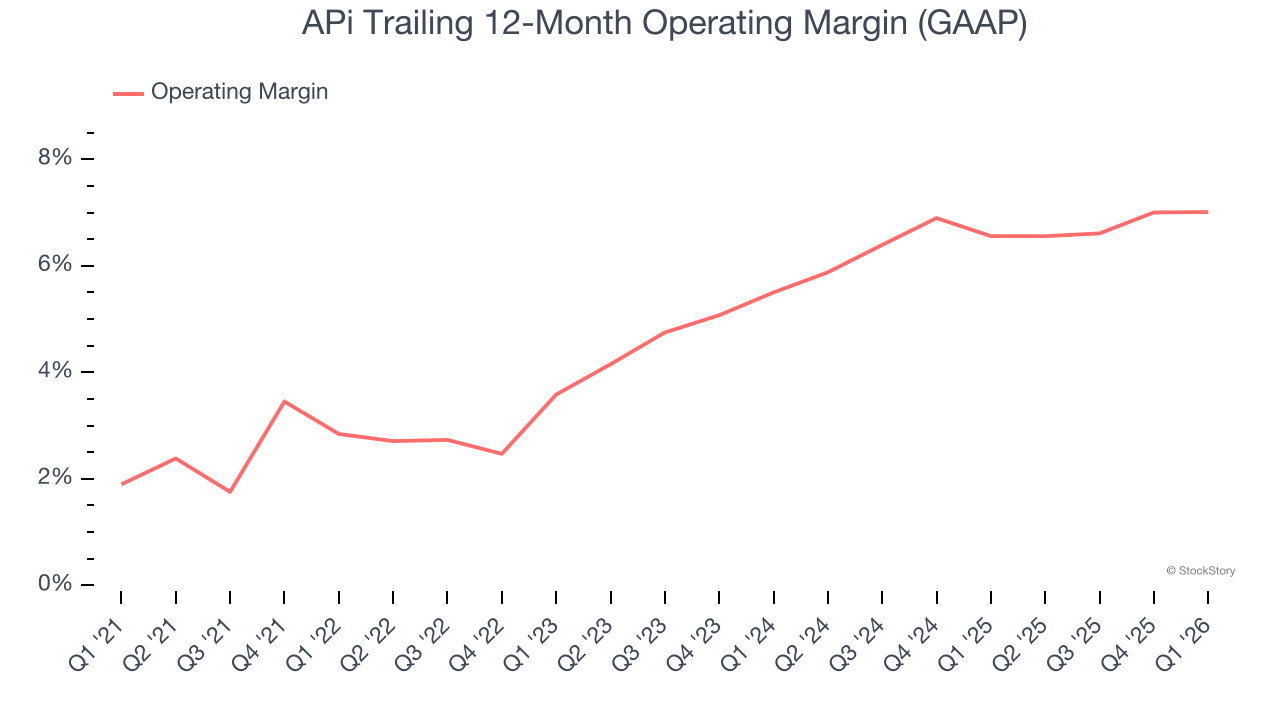
In Q1, APi generated an operating margin profit margin of 5.2%, in line with the same quarter last year. This indicates the company’s cost structure has recently been stable.
Earnings Per Share
We track the long-term change in earnings per share (EPS) for the same reason as long-term revenue growth. Compared to revenue, however, EPS highlights whether a company’s growth is profitable.
APi’s EPS grew at a spectacular 14.9% compounded annual growth rate over the last five years. Despite its operating margin improvement during that time, this performance was lower than its 18.6% annualized revenue growth, telling us that non-fundamental factors such as interest and taxes affected its ultimate earnings.
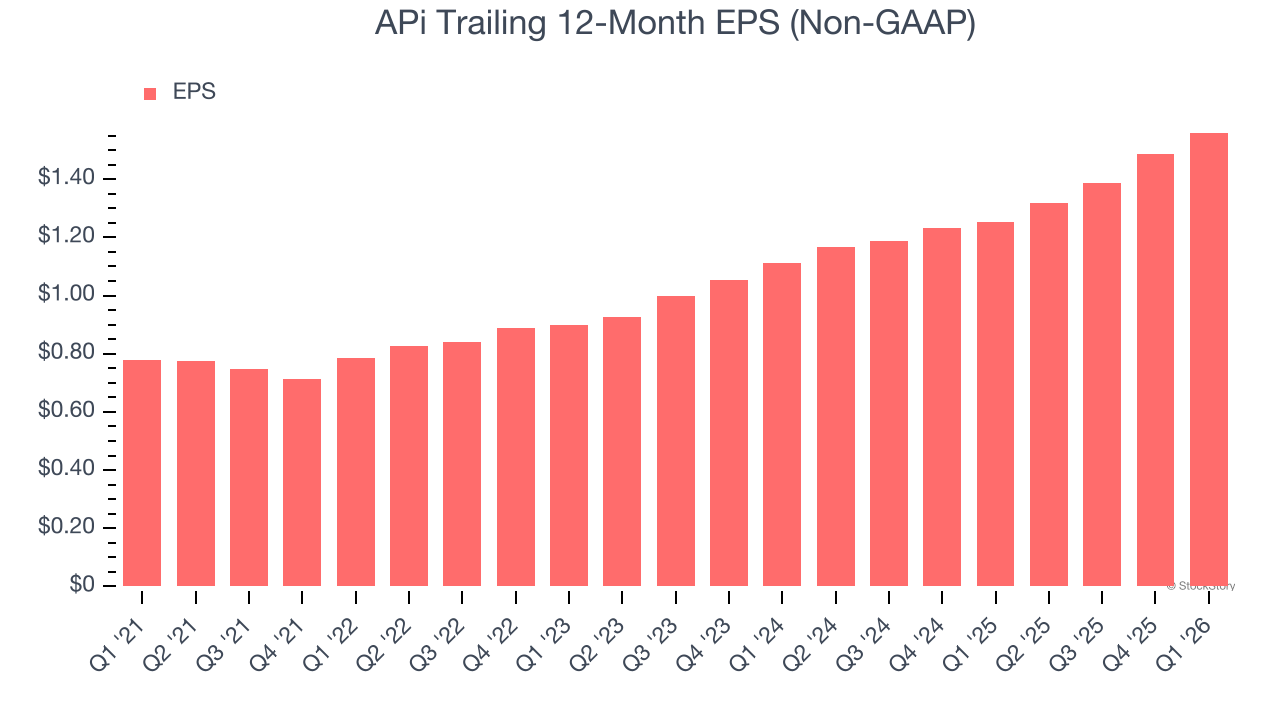
Diving into the nuances of APi’s earnings can give us a better understanding of its performance. A five-year view shows APi has diluted its shareholders, growing its share count by 50.8%. This dilution overshadowed its increased operational efficiency and has led to lower per share earnings. Taxes and interest expenses can also affect EPS but don’t tell us as much about a company’s fundamentals. 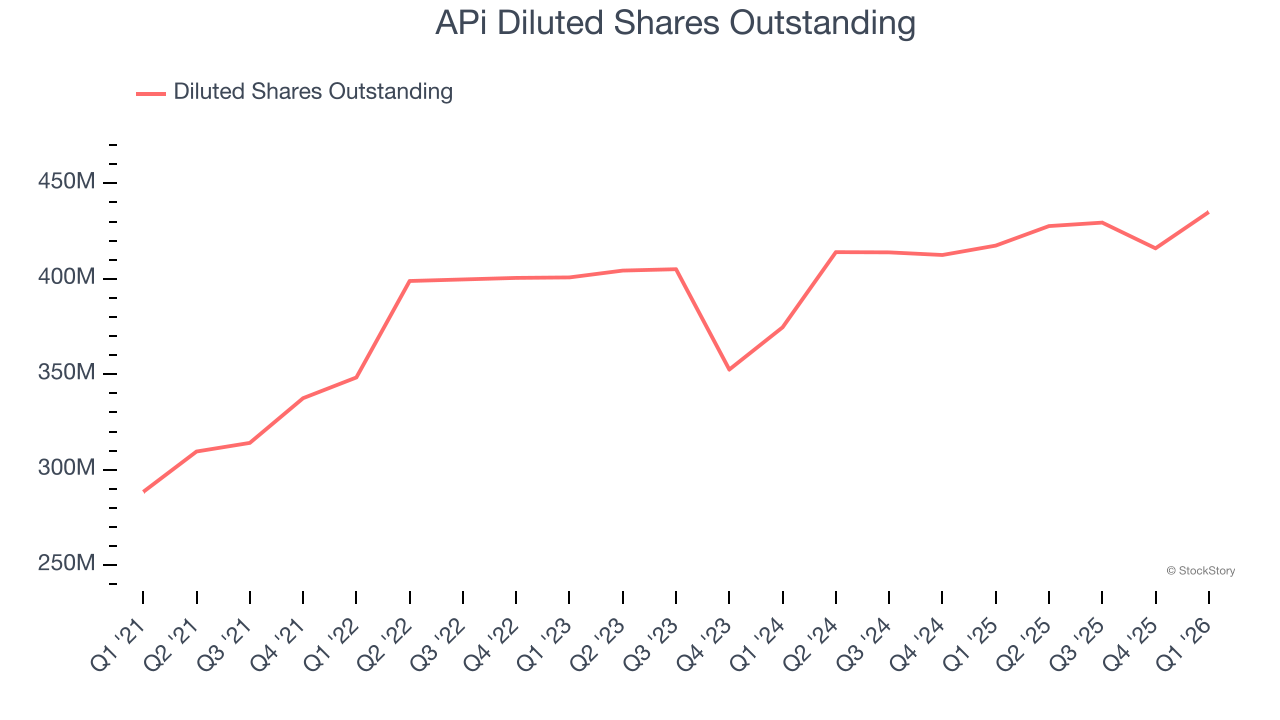
Like with revenue, we analyze EPS over a shorter period to see if we are missing a change in the business.
For APi, its two-year annual EPS growth of 18.4% was higher than its five-year trend. We love it when earnings growth accelerates, especially when it accelerates off an already high base.
In Q1, APi reported adjusted EPS of $0.32, up from $0.25 in the same quarter last year. This print beat analysts’ estimates by 5.3%. Over the next 12 months, Wall Street expects APi’s full-year EPS of $1.56 to grow 10.1%.
Key Takeaways from APi’s Q1 Results
We enjoyed seeing APi beat analysts’ revenue expectations this quarter. We were also glad its organic revenue outperformed Wall Street’s estimates. On the other hand, its adjusted operating income missed. Overall, this print had some key positives. The stock remained flat at $48.33 immediately following the results.
Is APi an attractive investment opportunity at the current price? We think that the latest quarter is only one piece of the longer-term business quality puzzle. Quality, when combined with valuation, can help determine if the stock is a buy. We cover that in our actionable full research report which you can read here (it’s free).


