Marine transportation service company Kirby (NYSE: KEX) announced better-than-expected revenue in Q1 CY2026, with sales up 7.4% year on year to $844.1 million. Its GAAP profit of $1.50 per share was 8.3% above analysts’ consensus estimates.
Is now the time to buy Kirby? Find out by accessing our full research report, it’s free.
Kirby (KEX) Q1 CY2026 Highlights:
- Revenue: $844.1 million vs analyst estimates of $821.7 million (7.4% year-on-year growth, 2.7% beat)
- EPS (GAAP): $1.50 vs analyst estimates of $1.39 (8.3% beat)
- Adjusted EBITDA: $183.1 million vs analyst estimates of $172.8 million (21.7% margin, 5.9% beat)
- Operating Margin: 12.8%, in line with the same quarter last year
- Free Cash Flow was $49.4 million, up from -$42.2 million in the same quarter last year
- Market Capitalization: $8.18 billion
David Grzebinski, Kirby’s Chief Executive Officer, commented, “Our first quarter results reflected improving market conditions in marine transportation where utilization and pricing strengthened as the quarter progressed, resulting in positive momentum entering the second quarter. In distribution and services, year-over-year revenue growth remained strong driven by continued strength in power generation orders. While results were impacted early in the quarter by normal seasonal challenges in marine transportation and project timing dynamics in distribution and services, overall performance improved as the quarter progressed, resulting in strong year-over-year growth in earnings per share.”
Company Overview
Transporting goods along all U.S. coasts, Kirby (NYSE: KEX) provides inland and coastal marine transportation services.
Revenue Growth
Examining a company’s long-term performance can provide clues about its quality. Any business can put up a good quarter or two, but the best consistently grow over the long haul. Over the last five years, Kirby grew its sales at an impressive 11.1% compounded annual growth rate. Its growth beat the average industrials company and shows its offerings resonate with customers, a helpful starting point for our analysis.
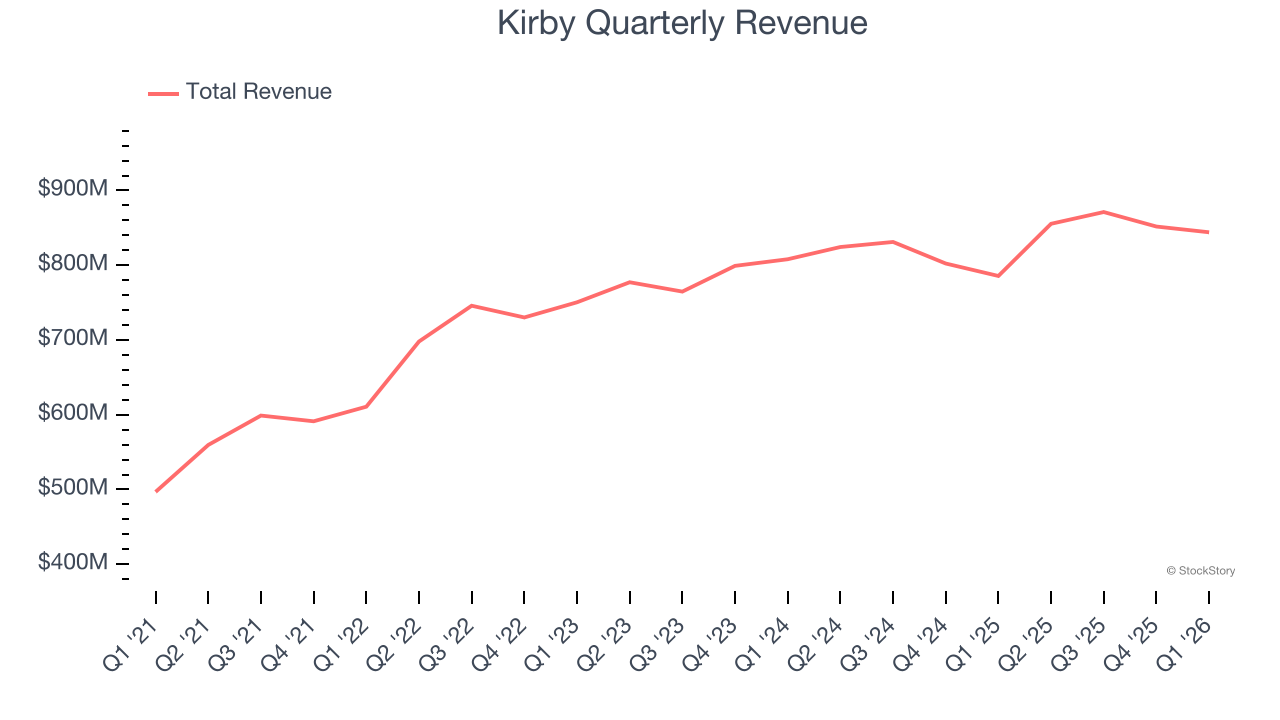
We at StockStory place the most emphasis on long-term growth, but within industrials, a half-decade historical view may miss cycles, industry trends, or a company capitalizing on catalysts such as a new contract win or a successful product line. Kirby’s recent performance shows its demand has slowed significantly as its annualized revenue growth of 4.2% over the last two years was well below its five-year trend. 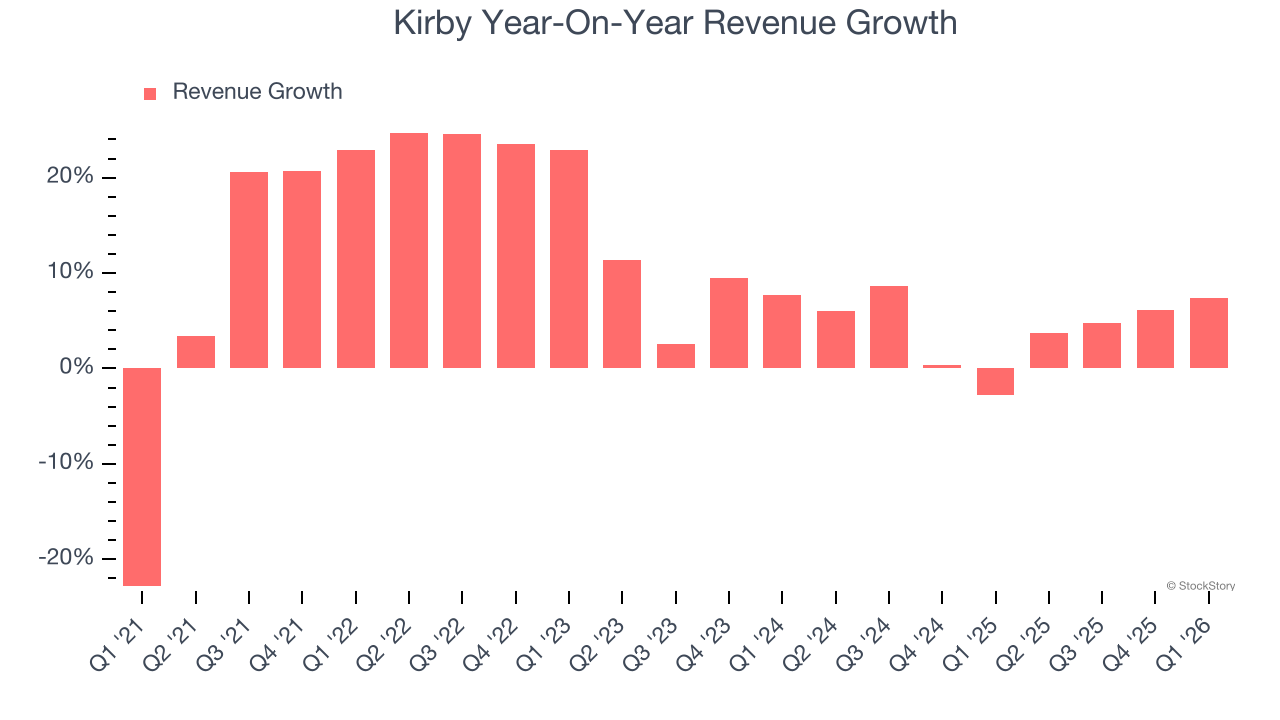
Kirby also breaks out the revenue for its most important segments, Marine Transportation and Distribution and Services, which are 58.9% and 41.1% of revenue. Over the last two years, Kirby’s Marine Transportation revenue (petroleum products and chemicals) averaged 1.8% year-on-year growth while its Distribution and Services revenue (aftermarket parts and equipment) averaged 6.8% growth. 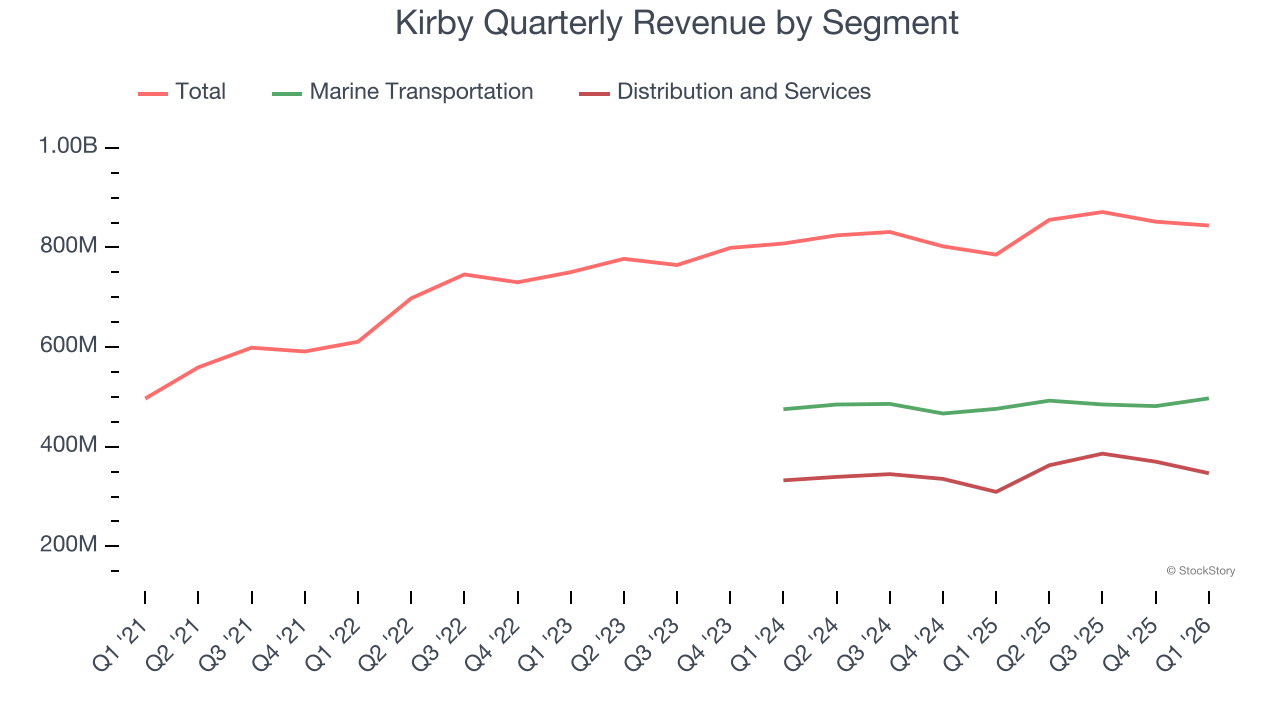
This quarter, Kirby reported year-on-year revenue growth of 7.4%, and its $844.1 million of revenue exceeded Wall Street’s estimates by 2.7%.
Looking ahead, sell-side analysts expect revenue to grow 3.5% over the next 12 months, similar to its two-year rate. This projection doesn't excite us and indicates its newer products and services will not catalyze better top-line performance yet. At least the company is tracking well in other measures of financial health.
ONE MORE THING: The $21 AI Application Stock Wall Street Forgot. While Wall Street obsesses over who’s building AI, one company is already using it to print money. And nobody’s paying attention.
AI chip stocks trade at ridiculous valuations. This company processes a trillion consumer signals monthly using AI and trades at a third of the price. The gap won’t last. The institutions will figure it out. You need to see this first. Read the FREE Report Before They Notice.
Operating Margin
Operating margin is one of the best measures of profitability because it tells us how much money a company takes home after procuring and manufacturing its products, marketing and selling those products, and most importantly, keeping them relevant through research and development.
Kirby has done a decent job managing its cost base over the last five years. The company has produced an average operating margin of 8.4%, higher than the broader industrials sector.
Analyzing the trend in its profitability, Kirby’s operating margin rose by 24.4 percentage points over the last five years, as its sales growth gave it immense operating leverage. Its expansion shows it’s one of the better Marine Transportation companies as most peers saw their margins plummet.
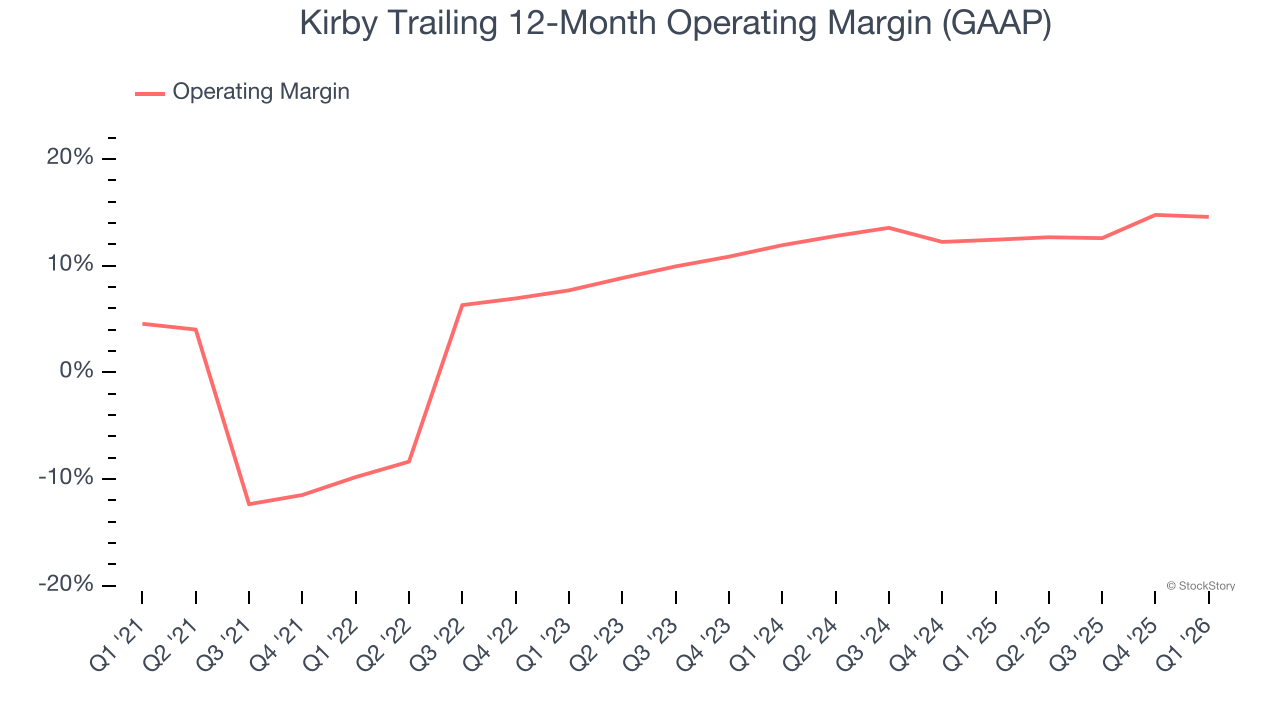
In Q1, Kirby generated an operating margin profit margin of 12.8%, in line with the same quarter last year. This indicates the company’s cost structure has recently been stable.
Earnings Per Share
We track the long-term change in earnings per share (EPS) for the same reason as long-term revenue growth. Compared to revenue, however, EPS highlights whether a company’s growth is profitable.
Kirby’s EPS grew at 40.5% compounded annual growth rate over the last five years, higher than its 11.1% annualized revenue growth. This tells us the company became more profitable on a per-share basis as it expanded.
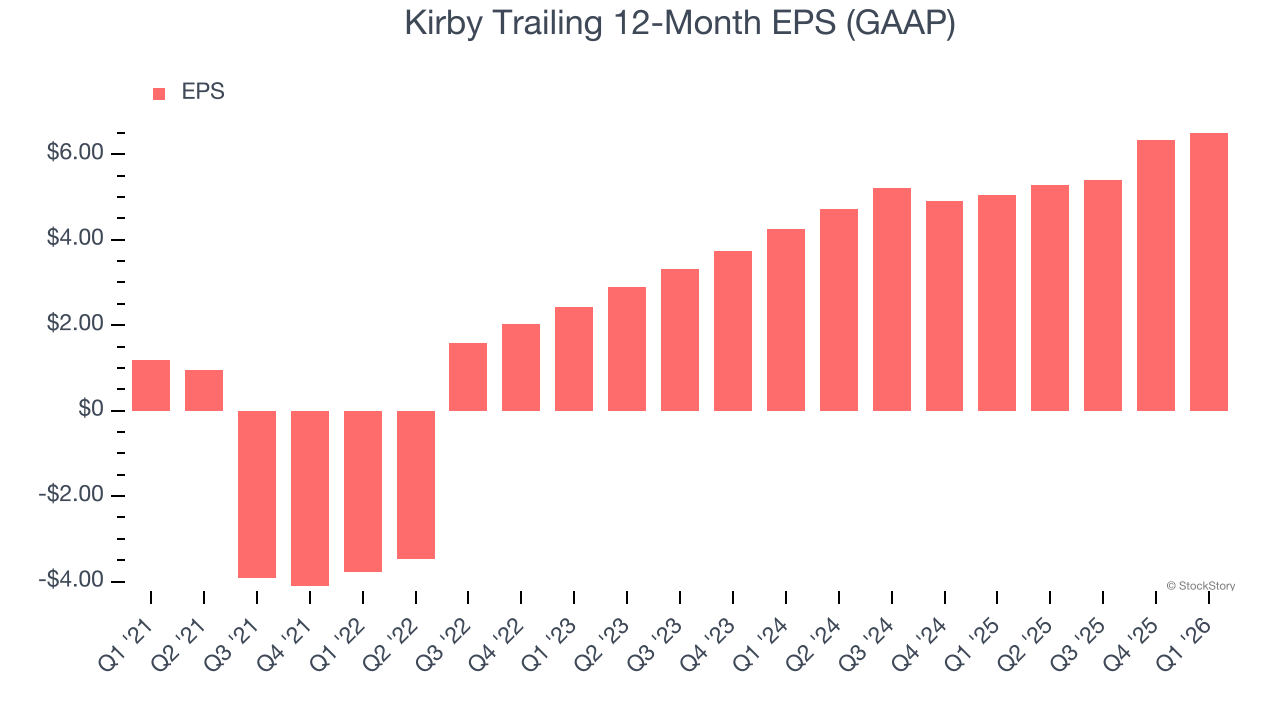
We can take a deeper look into Kirby’s earnings to better understand the drivers of its performance. As we mentioned earlier, Kirby’s operating margin was flat this quarter but expanded by 24.4 percentage points over the last five years. On top of that, its share count shrank by 10%. These are positive signs for shareholders because improving profitability and share buybacks turbocharge EPS growth relative to revenue growth. 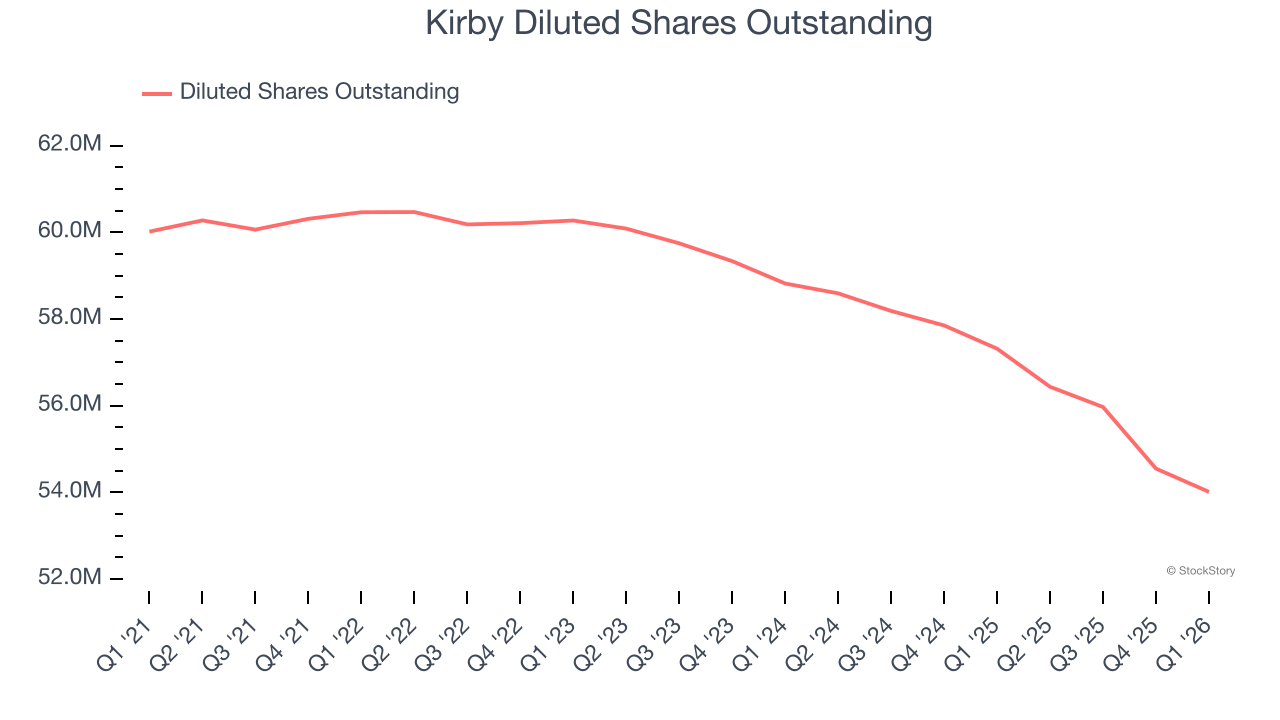
Like with revenue, we analyze EPS over a shorter period to see if we are missing a change in the business.
For Kirby, its two-year annual EPS growth of 23.8% was lower than its five-year trend. We still think its growth was good and hope it can accelerate in the future.
In Q1, Kirby reported EPS of $1.50, up from $1.33 in the same quarter last year. This print beat analysts’ estimates by 8.3%. Over the next 12 months, Wall Street expects Kirby’s full-year EPS of $6.51 to grow 10.4%.
Key Takeaways from Kirby’s Q1 Results
We enjoyed seeing Kirby beat analysts’ EBITDA expectations this quarter. We were also glad its revenue outperformed Wall Street’s estimates. Zooming out, we think this was a good print with some key areas of upside. The stock traded up 5.3% to $160.70 immediately after reporting.
Indeed, Kirby had a rock-solid quarterly earnings result, but is this stock a good investment here? What happened in the latest quarter matters, but not as much as longer-term business quality and valuation, when deciding whether to invest in this stock. We cover that in our actionable full research report which you can read here (it’s free).