
Industrial cleaning equipment manufacturer Tennant Company announced better-than-expected revenue in Q1 CY2026, with sales up 2.7% year on year to $297.9 million. The company expects the full year’s revenue to be around $1.26 billion, close to analysts’ estimates. Its non-GAAP profit of $0.58 per share was 43.8% above analysts’ consensus estimates.
Is now the time to buy Tennant? Find out by accessing our full research report, it’s free.
Tennant (TNC) Q1 CY2026 Highlights:
- Revenue: $297.9 million vs analyst estimates of $289.3 million (2.7% year-on-year growth, 3% beat)
- Adjusted EPS: $0.58 vs analyst estimates of $0.40 (43.8% beat)
- Adjusted EBITDA: $29.1 million vs analyst estimates of $22.03 million (9.8% margin, 32.1% beat)
- The company reconfirmed its revenue guidance for the full year of $1.26 billion at the midpoint
- Management reiterated its full-year Adjusted EPS guidance of $5 at the midpoint
- EBITDA guidance for the full year is $182.5 million at the midpoint, above analyst estimates of $173.1 million
- Operating Margin: 1.6%, down from 7.3% in the same quarter last year
- Free Cash Flow was -$34.4 million compared to -$7.5 million in the same quarter last year
- Market Capitalization: $1.49 billion
“Our first quarter results reflect strong net sales growth and solid order demand as we advanced key strategic priorities across the business,” said Dave Huml, Tennant President and Chief Executive Officer.
Company Overview
As the world’s largest manufacturer of autonomous mobile robots, Tennant (NYSE: TNC) designs, manufactures, and sells cleaning products to various sectors.
Revenue Growth
A company’s long-term performance is an indicator of its overall quality. Any business can put up a good quarter or two, but the best consistently grow over the long haul. Over the last five years, Tennant grew its sales at a sluggish 3.7% compounded annual growth rate. This was below our standard for the industrials sector and is a rough starting point for our analysis.
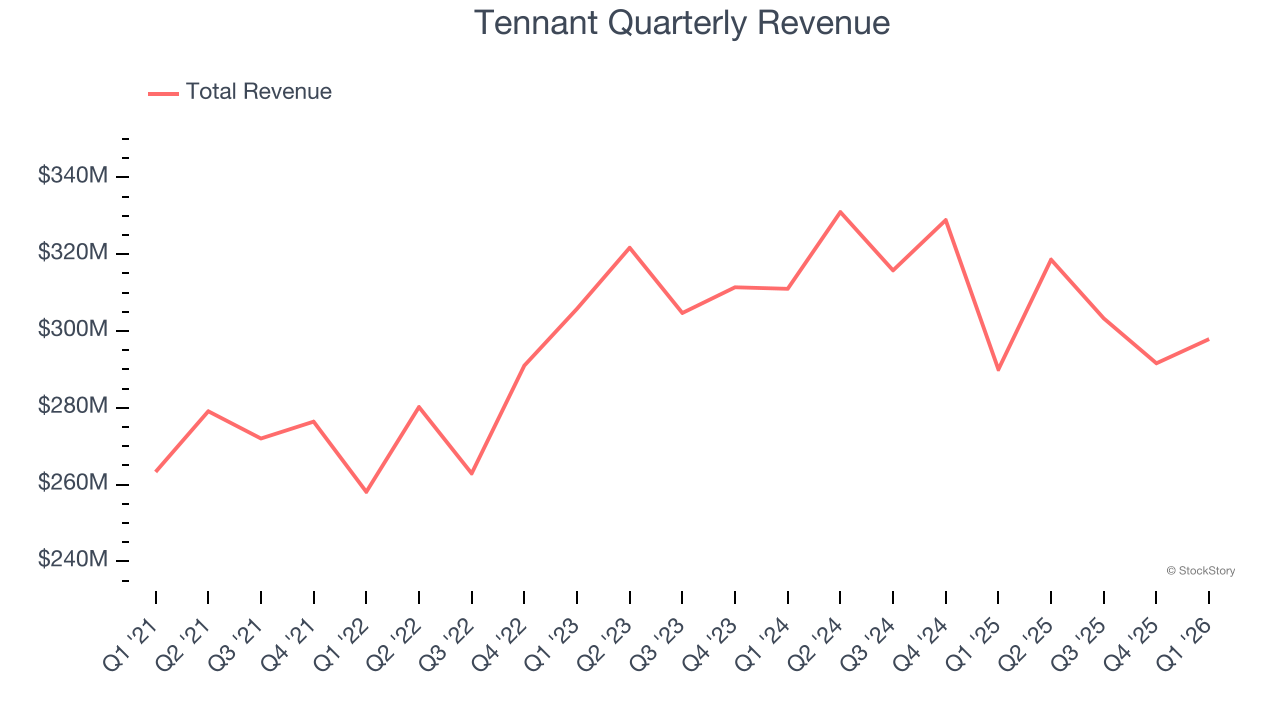
Long-term growth is the most important, but within industrials, a half-decade historical view may miss new industry trends or demand cycles. Tennant’s performance shows it grew in the past but relinquished its gains over the last two years, as its revenue fell by 1.5% annually. 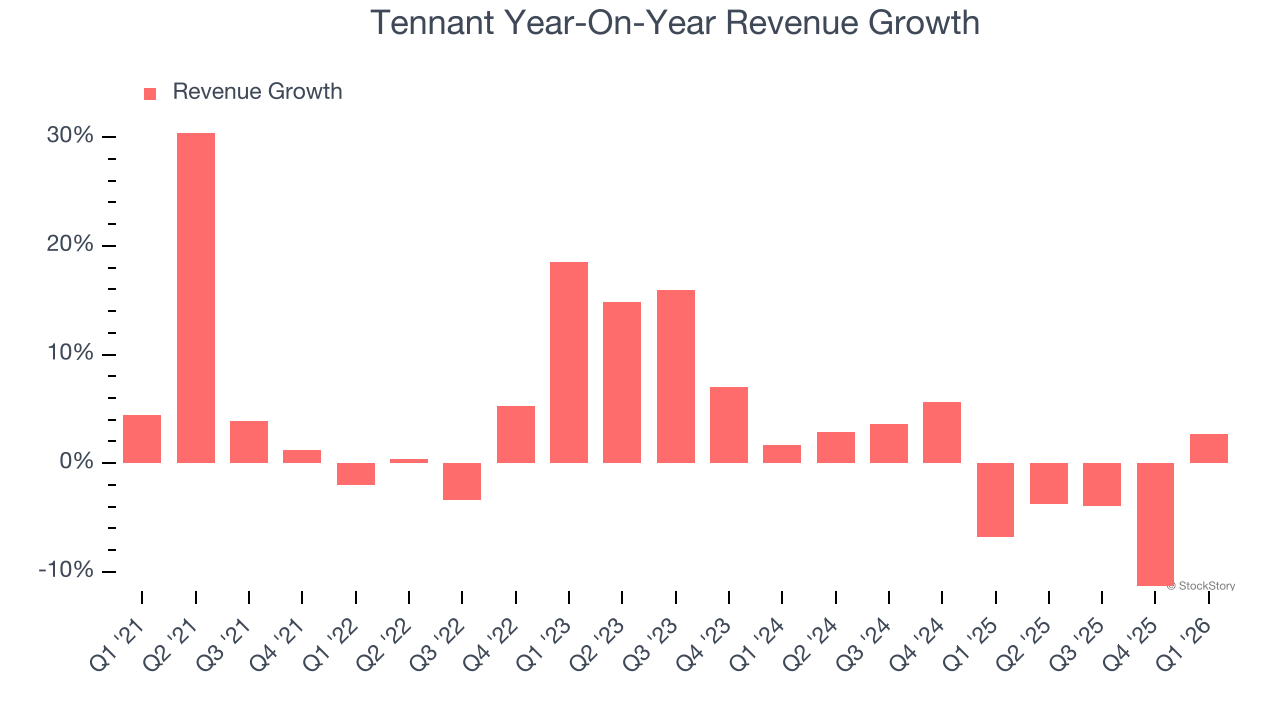
This quarter, Tennant reported modest year-on-year revenue growth of 2.7% but beat Wall Street’s estimates by 3%.
Looking ahead, sell-side analysts expect revenue to grow 6.3% over the next 12 months. Although this projection implies its newer products and services will fuel better top-line performance, it is still below average for the sector.
ONE MORE THING: 3 Hidden Platforms Growing 3X Faster than Amazon, Google, and PayPal. Amazon, Google, and Meta all followed the same playbook: Dominate an ignored market. Build an unbeatable moat. Scale until you’re unstoppable.
These three platforms are running that exact playbook right now. The early investors in Amazon made fortunes. The early investors in these could do the same. Get All 3 Stocks Here for FREE.
Operating Margin
Tennant has done a decent job managing its cost base over the last five years. The company has produced an average operating margin of 8.3%, higher than the broader industrials sector.
Analyzing the trend in its profitability, Tennant’s operating margin decreased by 2.3 percentage points over the last five years. This raises questions about the company’s expense base because its revenue growth should have given it leverage on its fixed costs, resulting in better economies of scale and profitability.
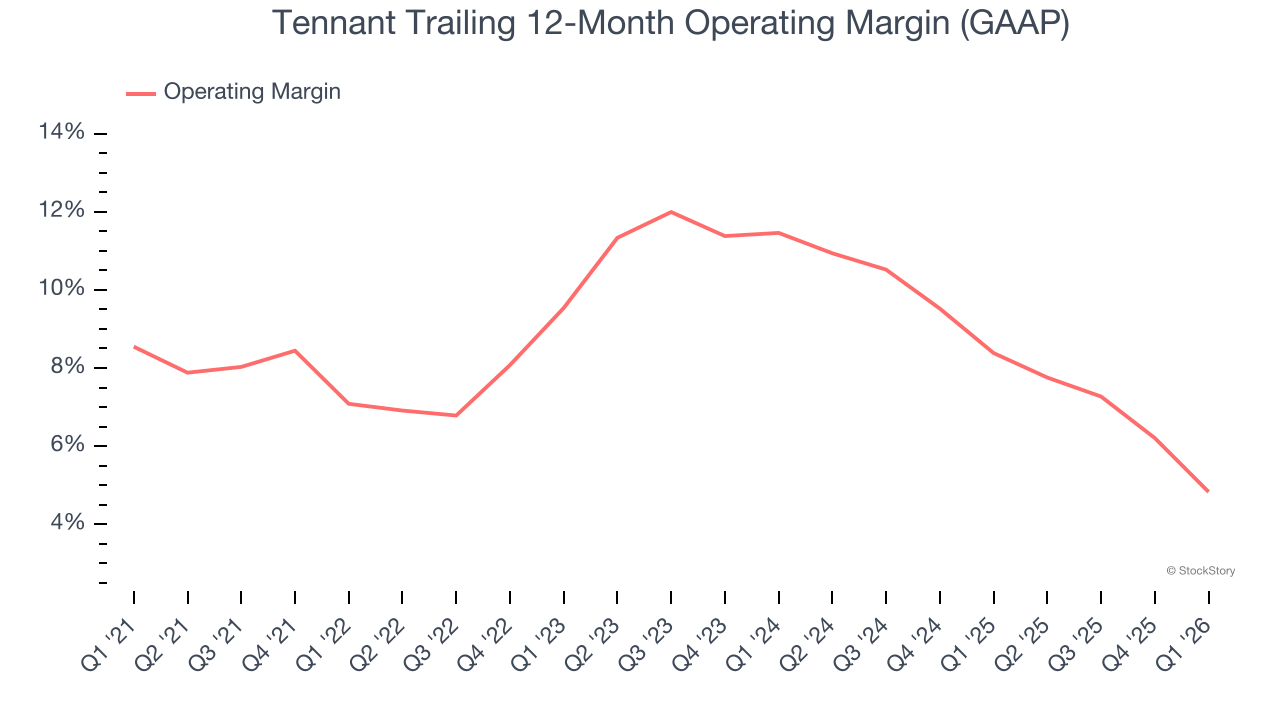
This quarter, Tennant generated an operating margin profit margin of 1.6%, down 5.6 percentage points year on year. Since Tennant’s operating margin decreased more than its gross margin, we can assume it was less efficient because expenses such as marketing, R&D, and administrative overhead increased.
Earnings Per Share
Revenue trends explain a company’s historical growth, but the long-term change in earnings per share (EPS) points to the profitability of that growth – for example, a company could inflate its sales through excessive spending on advertising and promotions.
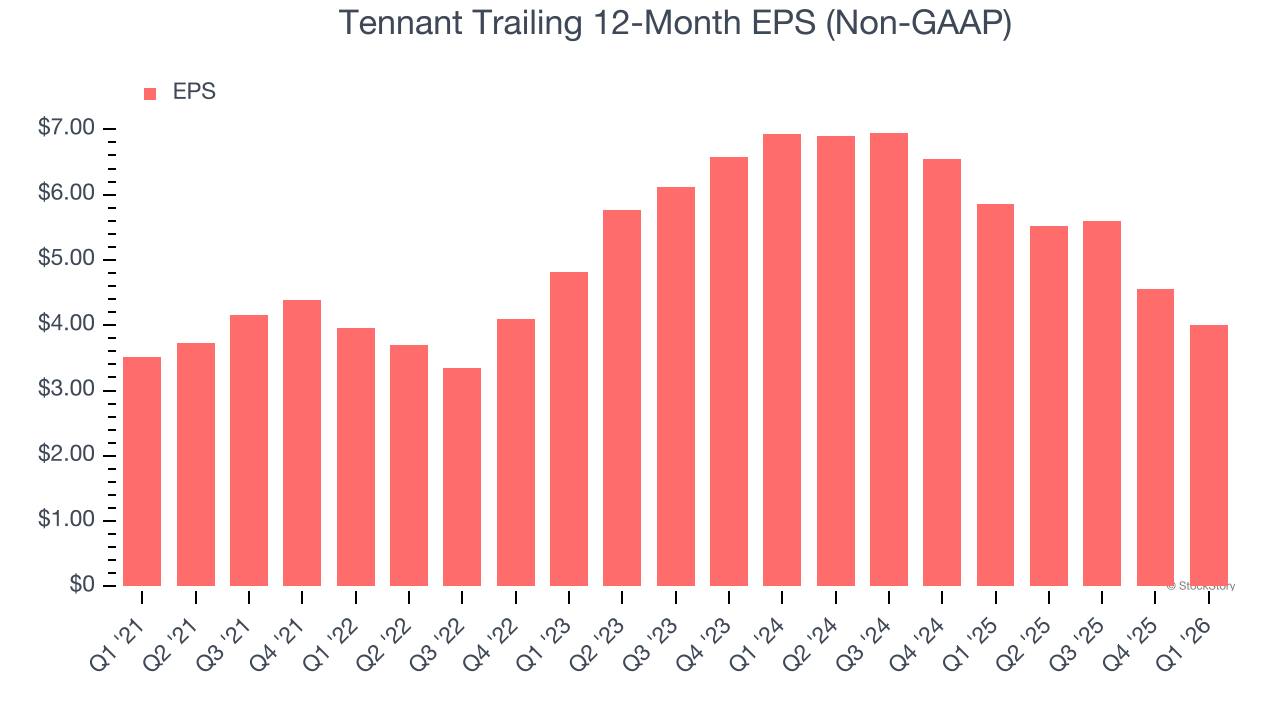
Tennant’s weak 2.7% annual EPS growth over the last five years aligns with its revenue performance. This tells us it maintained its per-share profitability as it expanded.
Like with revenue, we analyze EPS over a more recent period because it can provide insight into an emerging theme or development for the business.
Tennant’s two-year annual EPS declines of 23.9% were bad and lower than its two-year revenue losses.
We can take a deeper look into Tennant’s earnings to better understand the drivers of its performance. Tennant’s operating margin has declined over the last two years. This was the most relevant factor (aside from the revenue impact) behind its lower earnings; interest expenses and taxes can also affect EPS but don’t tell us as much about a company’s fundamentals.
In Q1, Tennant reported adjusted EPS of $0.58, down from $1.12 in the same quarter last year. Despite falling year on year, this print easily cleared analysts’ estimates. Over the next 12 months, Wall Street expects Tennant’s full-year EPS of $4.01 to grow 40.4%.
Key Takeaways from Tennant’s Q1 Results
It was good to see Tennant beat analysts’ EPS expectations this quarter. We were also excited its EBITDA outperformed Wall Street’s estimates by a wide margin. Zooming out, we think this was a solid print. The stock traded up 3.7% to $84.93 immediately following the results.
Indeed, Tennant had a rock-solid quarterly earnings result, but is this stock a good investment here? We think that the latest quarter is only one piece of the longer-term business quality puzzle. Quality, when combined with valuation, can help determine if the stock is a buy. We cover that in our actionable full research report which you can read here (it’s free).