Building products installation services company Installed Building Products (NYSE: IBP) missed Wall Street’s revenue expectations in Q1 CY2026, with sales falling 3.5% year on year to $660.5 million. Its non-GAAP profit of $1.79 per share was 8.7% below analysts’ consensus estimates.
Is now the time to buy Installed Building Products? Find out by accessing our full research report, it’s free.
Installed Building Products (IBP) Q1 CY2026 Highlights:
- Revenue: $660.5 million vs analyst estimates of $668.9 million (3.5% year-on-year decline, 1.3% miss)
- Adjusted EPS: $1.79 vs analyst expectations of $1.96 (8.7% miss)
- Adjusted EBITDA: $92.1 million vs analyst estimates of $100.1 million (13.9% margin, 8% miss)
- Operating Margin: 8.7%, down from 10.2% in the same quarter last year
- Free Cash Flow Margin: 13%, up from 10.5% in the same quarter last year
- Market Capitalization: $8.07 billion
Company Overview
Founded in 1977, Installed Building Products (NYSE: IBP) is a company specializing in the installation of insulation, waterproofing, and other complementary building products for residential and commercial construction.
Revenue Growth
A company’s long-term performance is an indicator of its overall quality. Any business can experience short-term success, but top-performing ones enjoy sustained growth for years. Thankfully, Installed Building Products’s 11.7% annualized revenue growth over the last five years was impressive. Its growth beat the average industrials company and shows its offerings resonate with customers, a helpful starting point for our analysis.
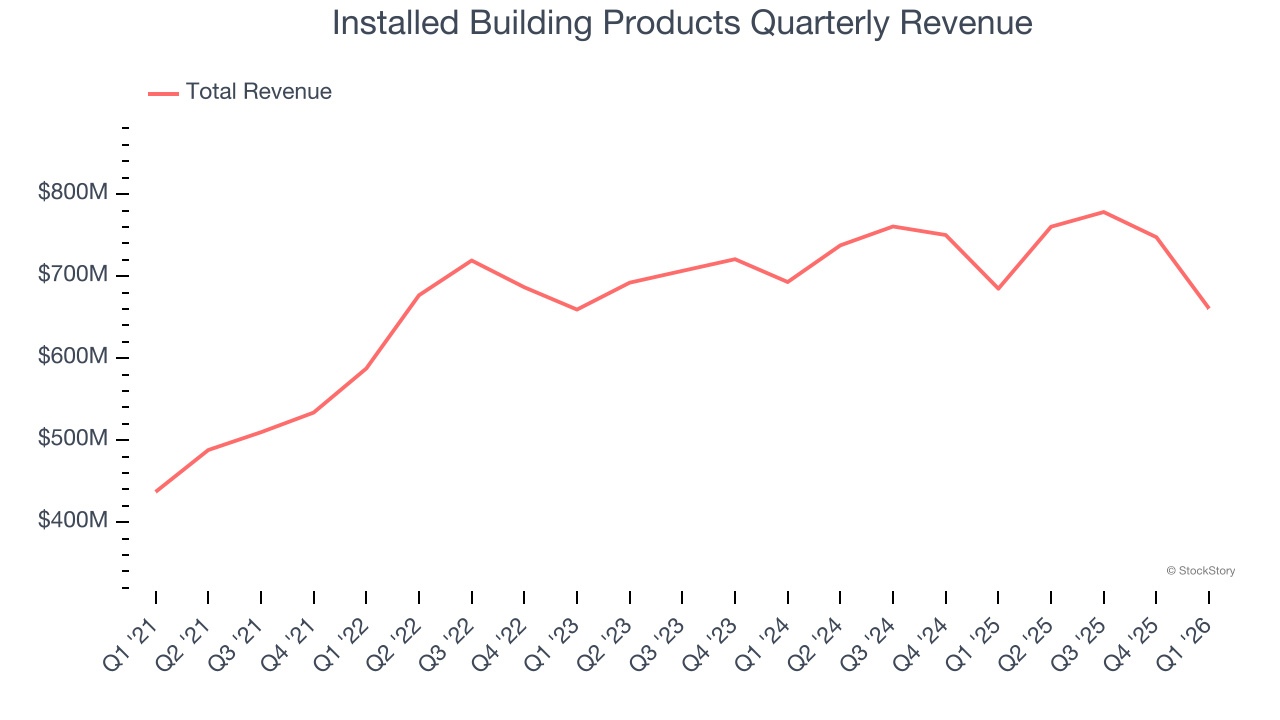
We at StockStory place the most emphasis on long-term growth, but within industrials, a half-decade historical view may miss cycles, industry trends, or a company capitalizing on catalysts such as a new contract win or a successful product line. Installed Building Products’s recent performance shows its demand has slowed significantly as its annualized revenue growth of 2.4% over the last two years was well below its five-year trend. 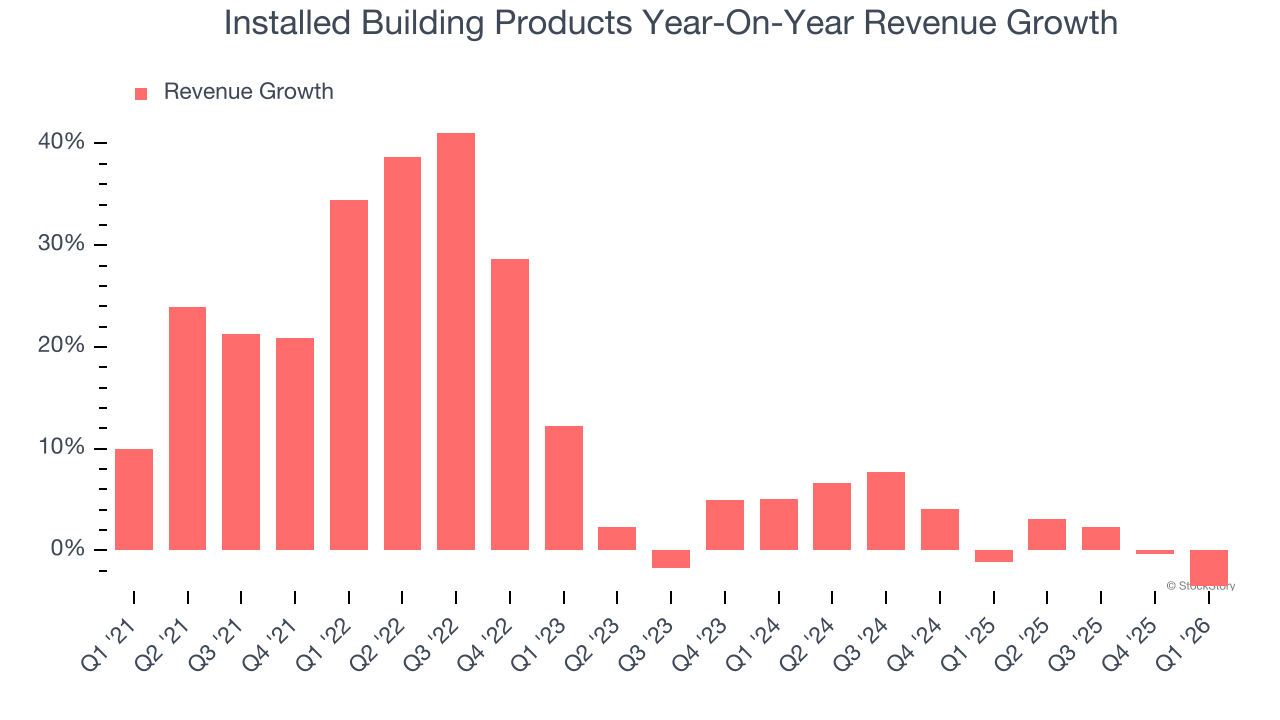
This quarter, Installed Building Products missed Wall Street’s estimates and reported a rather uninspiring 3.5% year-on-year revenue decline, generating $660.5 million of revenue.
Looking ahead, sell-side analysts expect revenue to grow 2.4% over the next 12 months, similar to its two-year rate. This projection doesn't excite us and indicates its newer products and services will not catalyze better top-line performance yet. At least the company is tracking well in other measures of financial health.
ONE MORE THING: The $21 AI Application Stock Wall Street Forgot. While Wall Street obsesses over who’s building AI, one company is already using it to print money. And nobody’s paying attention.
AI chip stocks trade at ridiculous valuations. This company processes a trillion consumer signals monthly using AI and trades at a third of the price. The gap won’t last. The institutions will figure it out. You need to see this first. Read the FREE Report Before They Notice.
Operating Margin
Operating margin is an important measure of profitability as it shows the portion of revenue left after accounting for all core expenses – everything from the cost of goods sold to advertising and wages. It’s also useful for comparing profitability across companies with different levels of debt and tax rates because it excludes interest and taxes.
Installed Building Products has been an efficient company over the last five years. It was one of the more profitable businesses in the industrials sector, boasting an average operating margin of 12.5%.
Looking at the trend in its profitability, Installed Building Products’s operating margin rose by 2.6 percentage points over the last five years, as its sales growth gave it operating leverage. Its expansion was impressive, especially when considering most Home Builders peers saw their margins plummet.
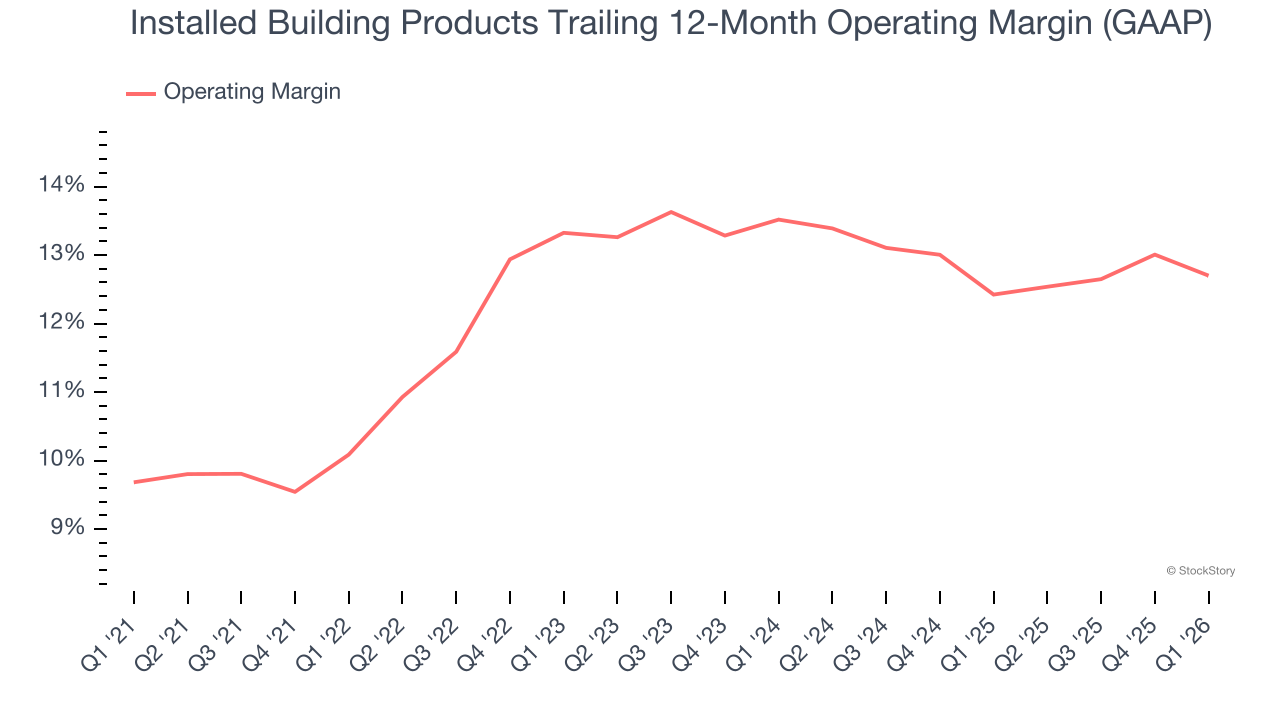
This quarter, Installed Building Products generated an operating margin profit margin of 8.7%, down 1.5 percentage points year on year. Since Installed Building Products’s operating margin decreased more than its gross margin, we can assume it was less efficient because expenses such as marketing, R&D, and administrative overhead increased.
Earnings Per Share
Revenue trends explain a company’s historical growth, but the long-term change in earnings per share (EPS) points to the profitability of that growth – for example, a company could inflate its sales through excessive spending on advertising and promotions.
Installed Building Products’s EPS grew at 20.1% compounded annual growth rate over the last five years, higher than its 11.7% annualized revenue growth. This tells us the company became more profitable on a per-share basis as it expanded.
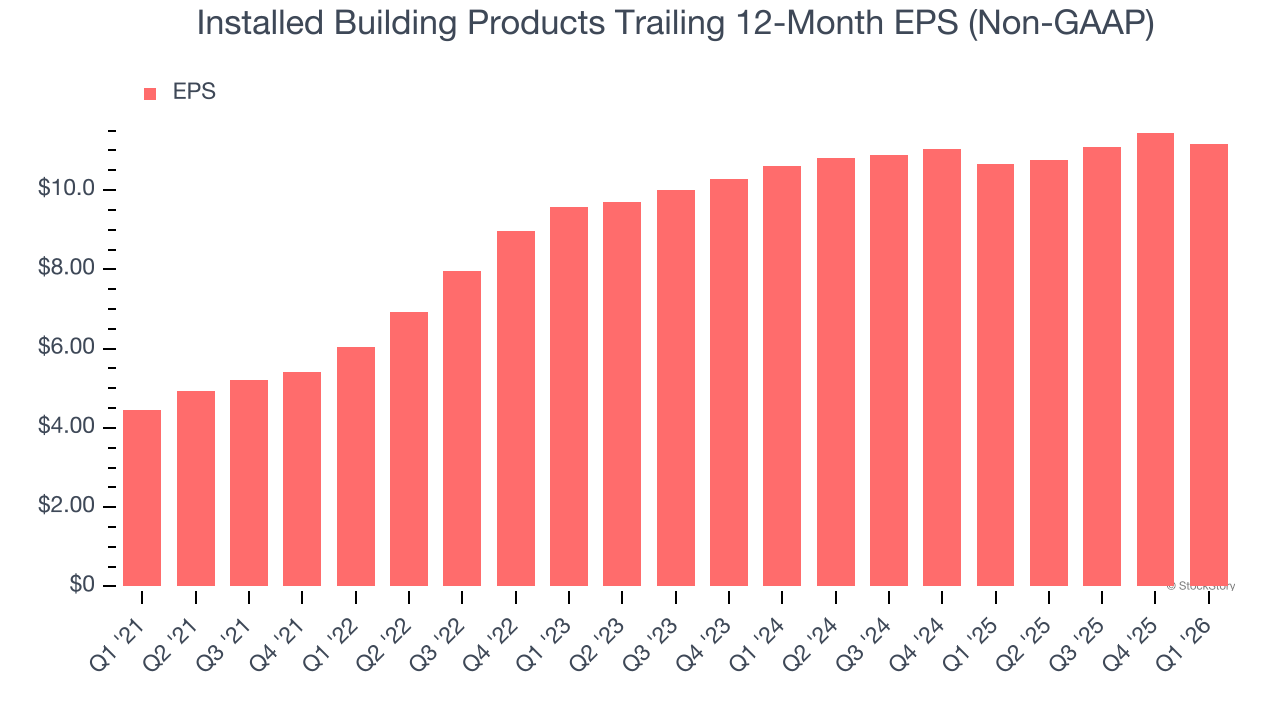
We can take a deeper look into Installed Building Products’s earnings quality to better understand the drivers of its performance. As we mentioned earlier, Installed Building Products’s operating margin declined this quarter but expanded by 2.6 percentage points over the last five years. Its share count also shrank by 8.9%, and these factors together are positive signs for shareholders because improving profitability and share buybacks turbocharge EPS growth relative to revenue growth. 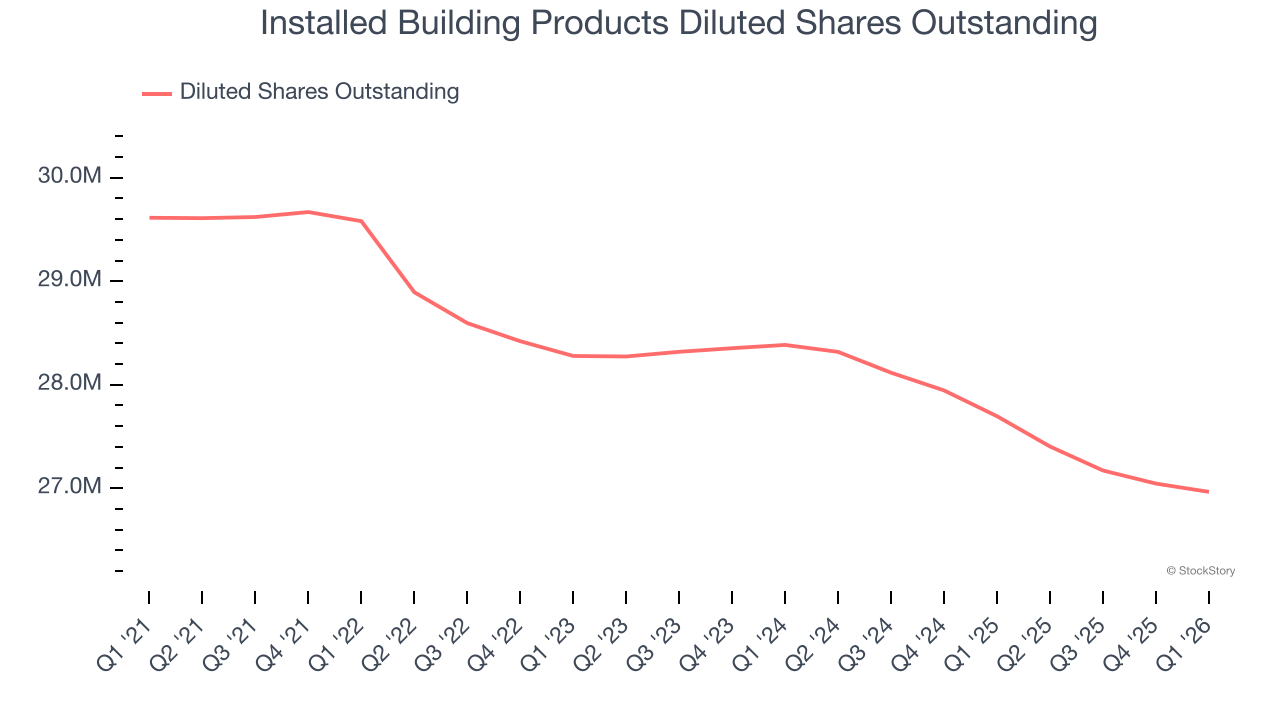
Like with revenue, we analyze EPS over a more recent period because it can provide insight into an emerging theme or development for the business.
For Installed Building Products, its two-year annual EPS growth of 2.6% was lower than its five-year trend. This wasn’t great, but at least the company was successful in other measures of financial health.
In Q1, Installed Building Products reported adjusted EPS of $1.79, down from $2.08 in the same quarter last year. This print missed analysts’ estimates, but we care more about long-term adjusted EPS growth than short-term movements. Over the next 12 months, Wall Street expects Installed Building Products’s full-year EPS of $11.16 to stay about the same.
Key Takeaways from Installed Building Products’s Q1 Results
We struggled to find many positives in these results. Its adjusted operating income missed and its EBITDA fell short of Wall Street’s estimates. Overall, this quarter could have been better. The stock traded down 10.6% to $267.55 immediately following the results.
Installed Building Products didn’t show it’s best hand this quarter, but does that create an opportunity to buy the stock right now? We think that the latest quarter is only one piece of the longer-term business quality puzzle. Quality, when combined with valuation, can help determine if the stock is a buy. We cover that in our actionable full research report which you can read here (it’s free).