Non-lethal weapons company Byrna (NASDAQ: BYRN) missed Wall Street’s revenue expectations in Q2 CY2026, with sales falling 42.5% year on year to $16.39 million. Its GAAP loss of $0.44 per share was significantly below analysts’ consensus estimates.
Is now the time to buy Byrna? Find out by accessing our full research report, it’s free.
Byrna (BYRN) Q2 CY2026 Highlights:
- Revenue: $16.39 million vs analyst estimates of $22.22 million (42.5% year-on-year decline, 26.3% miss)
- EPS (GAAP): -$0.44 vs analyst estimates of -$0.11 (significant miss)
- Adjusted EBITDA: -$605,000 (-3.7% margin, 114% year-on-year decline)
- Adjusted EBITDA Margin: -3.7%, down from 15.1% in the same quarter last year
- Market Capitalization: $146.3 million
Management Commentary“Our second quarter results did not reflect the level of performance we believe Byrna can deliver,” said Byrna CEO Conn Davis.
Company Overview
Providing civilians with tools to disable, disarm, and deter would-be assailants, Byrna (NASDAQ: BYRN) is a provider of non-lethal weapons.
Revenue Growth
Examining a company’s long-term performance can provide clues about its quality. Even a bad business can shine for one or two quarters, but a top-tier one grows for years. Luckily, Byrna’s sales grew at an incredible 23.7% compounded annual growth rate over the last five years. Its growth beat the average industrials company and shows its offerings resonate with customers.
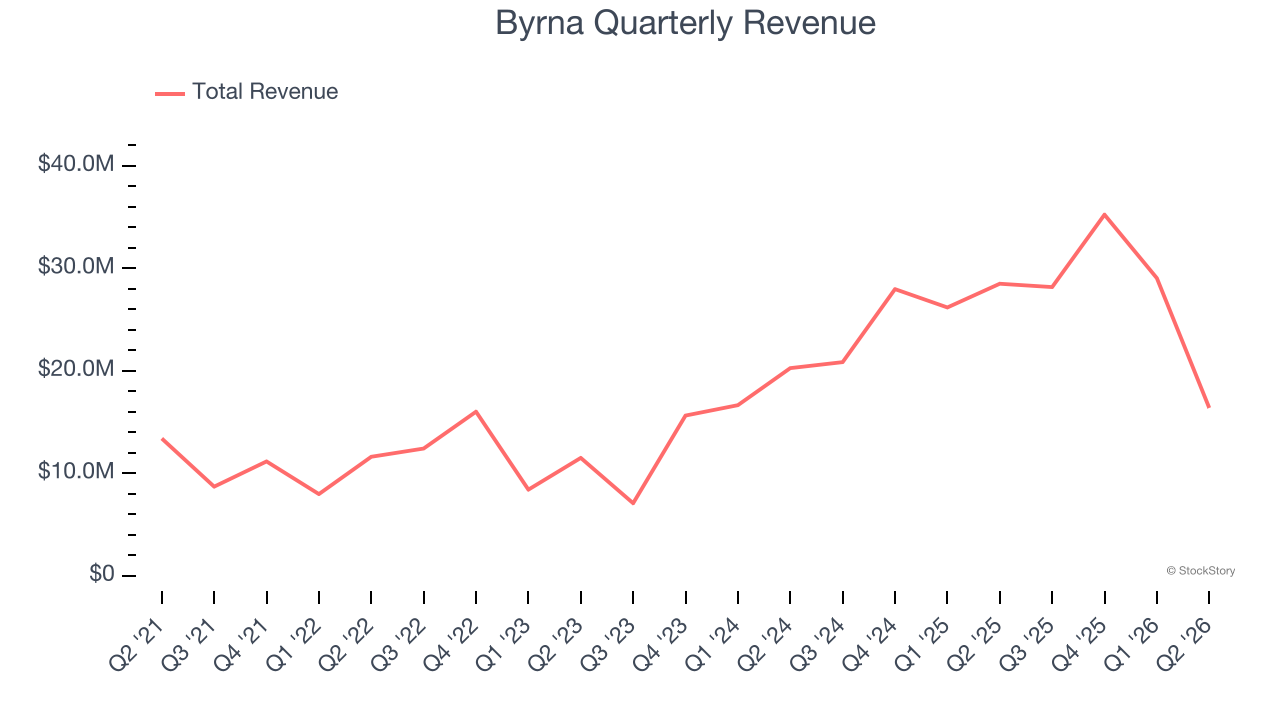
Long-term growth is the most important, but within industrials, a half-decade historical view may miss new industry trends or demand cycles. Byrna’s annualized revenue growth of 35.1% over the last two years is above its five-year trend, suggesting its demand was strong and recently accelerated. 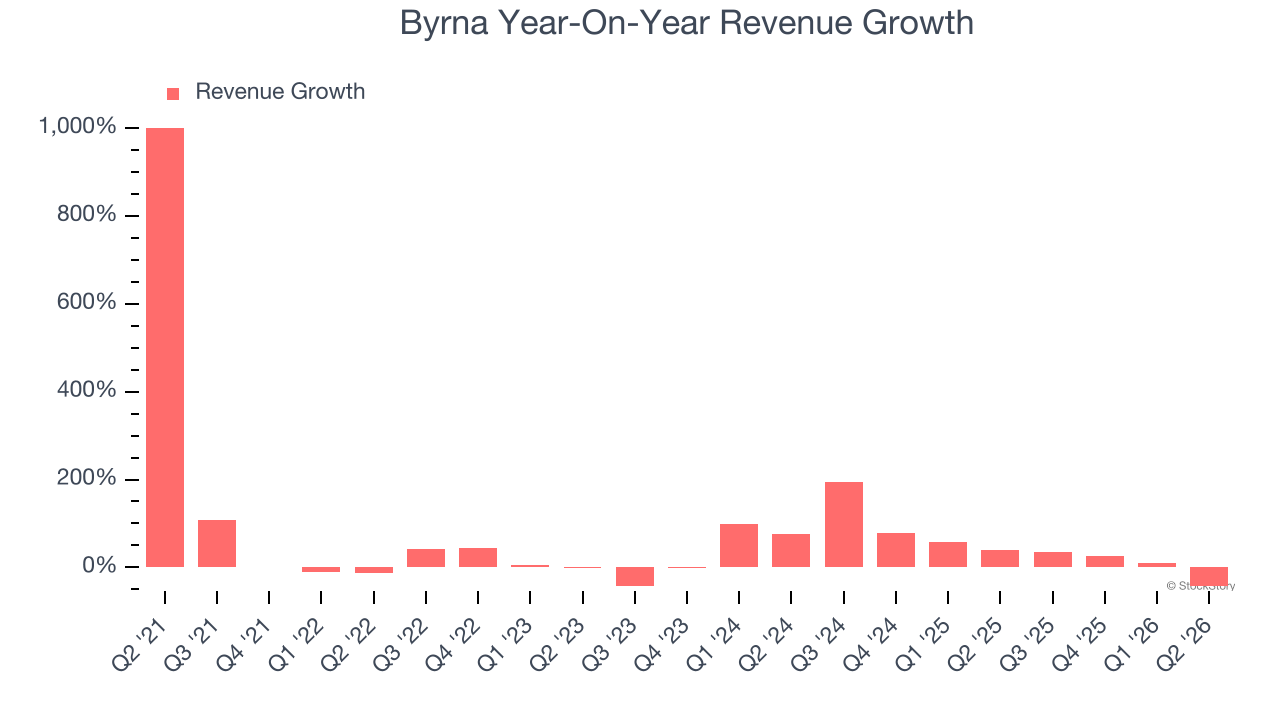
This quarter, Byrna missed Wall Street’s estimates and reported a rather uninspiring 42.5% year-on-year revenue decline, generating $16.39 million of revenue.
Looking ahead, sell-side analysts expect revenue to grow 9.2% over the next 12 months, a deceleration versus the last two years. Despite the slowdown, this projection is noteworthy and implies the market sees success for its products and services.
ONE MORE THING: 3 Hidden Platforms Growing 3X Faster than Amazon, Google, and PayPal. Amazon, Google, and Meta all followed the same playbook: Dominate an ignored market. Build an unbeatable moat. Scale until you’re unstoppable.
These three platforms are running that exact playbook right now. The early investors in Amazon made fortunes. The early investors in these could do the same. Get All 3 Stocks Here for FREE.
Operating Margin
Byrna’s high expenses have contributed to an average operating margin of negative 3.9% over the last five years. Unprofitable industrials companies require extra attention because they could get caught swimming naked when the tide goes out. It’s hard to trust that the business can endure a full cycle.
On the plus side, Byrna’s operating margin rose by 23 percentage points over the last five years, as its sales growth gave it operating leverage. Still, it will take much more for the company to reach long-term profitability.
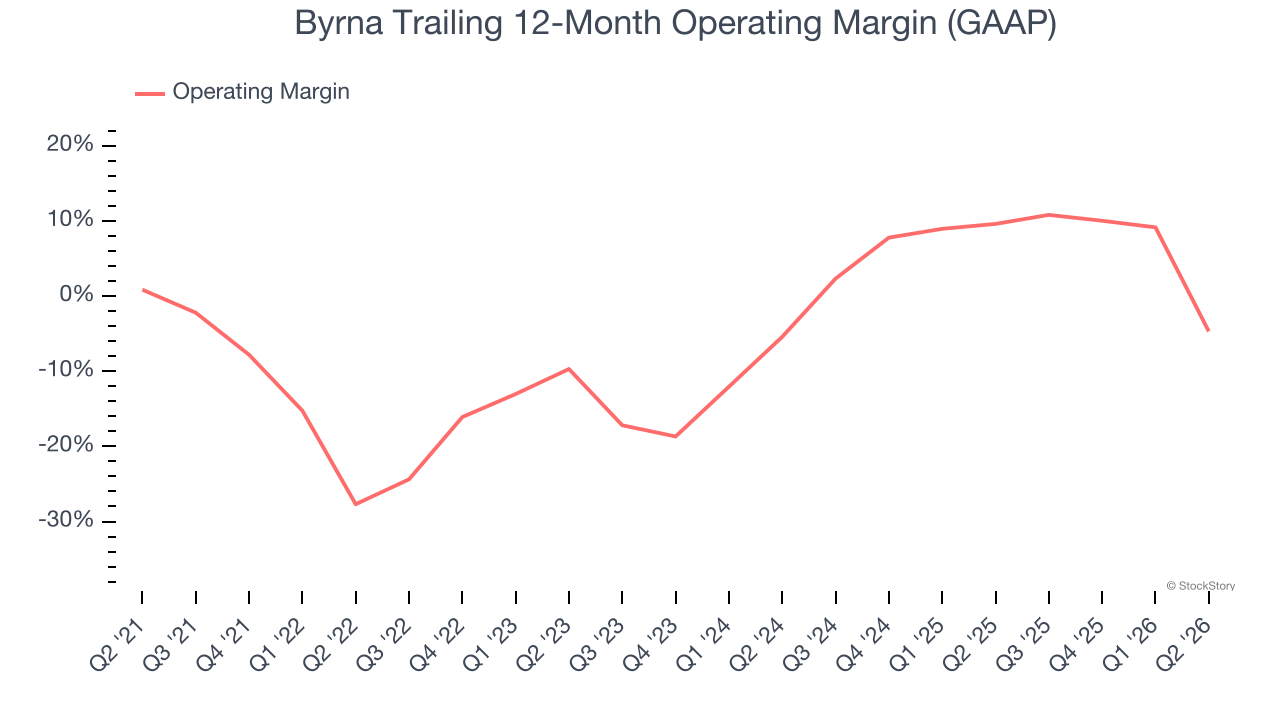
This quarter, Byrna generated a negative 78.4% operating margin.
Earnings Per Share
We track the long-term change in earnings per share (EPS) for the same reason as long-term revenue growth. Compared to revenue, however, EPS highlights whether a company’s growth is profitable.
Byrna’s earnings losses deepened over the last five years as its EPS dropped 38% annually. We’ll keep a close eye on the company as diminishing earnings could imply changing secular trends and preferences.
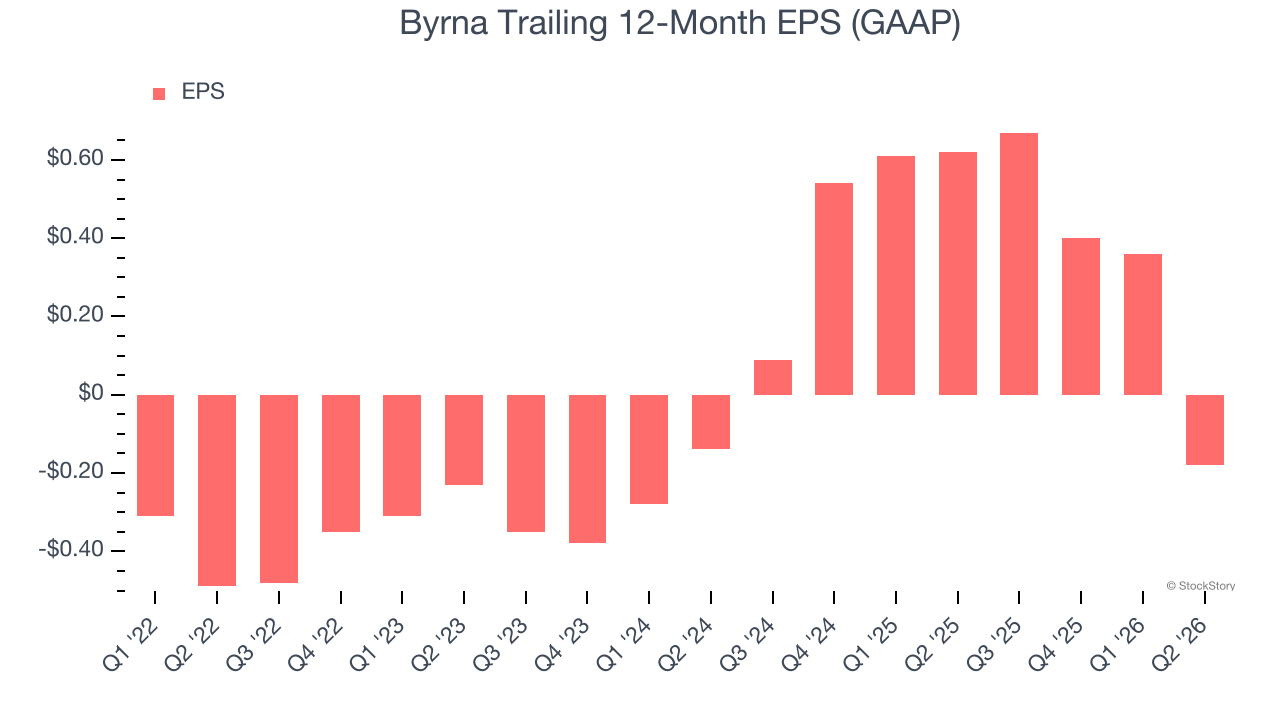
Like with revenue, we analyze EPS over a more recent period because it can provide insight into an emerging theme or development for the business.
For Byrna, its two-year annual EPS declines of 13.4% show it’s still underperforming. These results were bad no matter how you slice the data.
In Q2, Byrna reported EPS of negative $0.44, down from $0.10 in the same quarter last year. This print missed analysts’ estimates. Over the next 12 months, Wall Street is optimistic. Analysts forecast Byrna’s full-year EPS will flip from negative $0.18 to positive $0.08.
Key Takeaways from Byrna’s Q2 Results
While EBITDA beat analyst expectations this quarter, revenue and EPS fell short of expectations materially. The quarter marks a significant departure from prior results. The stock traded down 24.4% to $4.49 immediately following the results.
Byrna’s earnings report left more to be desired. Let’s look forward to see if this quarter has created an opportunity to buy the stock. If you’re making that decision, you should consider the bigger picture of valuation, business qualities, as well as the latest earnings. We cover that in our actionable full research report which you can read here (it’s free).