Online fashion resale marketplace ThredUp (NASDAQ: TDUP) reported Q2 CY2025 results topping the market’s revenue expectations, with sales up 16.4% year on year to $77.66 million. On top of that, next quarter’s revenue guidance ($74 million at the midpoint) was surprisingly good and 3.7% above what analysts were expecting. Its GAAP loss of $0.04 per share was $0.01 above analysts’ consensus estimates.
Is now the time to buy ThredUp? Find out by accessing our full research report, it’s free.
ThredUp (TDUP) Q2 CY2025 Highlights:
- Revenue: $77.66 million vs analyst estimates of $73.85 million (16.4% year-on-year growth, 5.2% beat)
- EPS (GAAP): -$0.04 vs analyst estimates of -$0.05 ($0.01 beat)
- Adjusted EBITDA: $3.02 million vs analyst estimates of $2.4 million (3.9% margin, relatively in line)
- The company lifted its revenue guidance for the full year to $300 million at the midpoint from $286 million, a 4.9% increase
- Operating Margin: -6.8%, up from -14.4% in the same quarter last year
- Free Cash Flow was -$2.94 million compared to -$3.88 million in the same quarter last year
- Orders: 1.47 million, up 199,000 year on year
- Market Capitalization: $1.00 billion
“Driven by strong customer and order growth, we are extremely pleased with our second quarter performance,” said ThredUp CEO and co-founder James Reinhart.
Company Overview
Founded to revolutionize thrifting, ThredUp (NASDAQ: TDUP) is a leading online fashion resale marketplace offering a wide selection of gently-used clothing and accessories.
Revenue Growth
A company’s long-term performance is an indicator of its overall quality. Any business can have short-term success, but a top-tier one grows for years. Over the last five years, ThredUp grew its sales at a sluggish 8.3% compounded annual growth rate. This was below our standard for the consumer discretionary sector and is a poor baseline for our analysis.
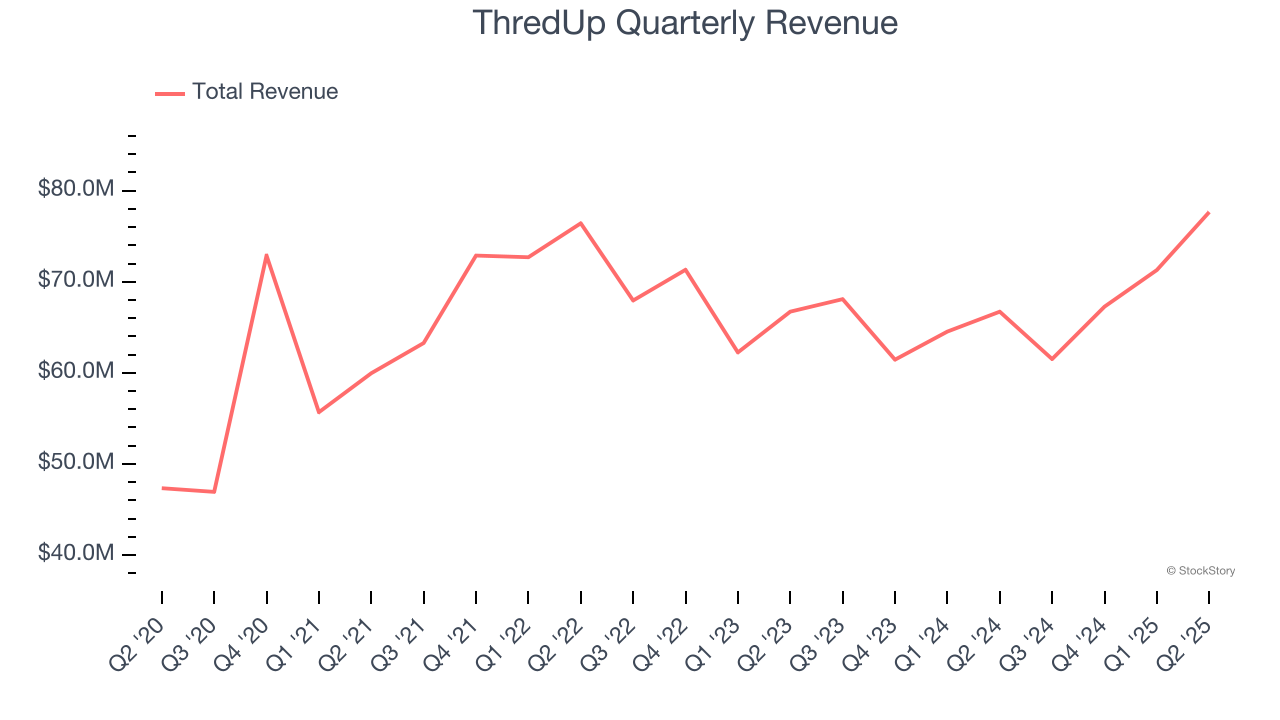
Long-term growth is the most important, but within consumer discretionary, product cycles are short and revenue can be hit-driven due to rapidly changing trends and consumer preferences. ThredUp’s recent performance shows its demand has slowed as its annualized revenue growth of 1.8% over the last two years was below its five-year trend. 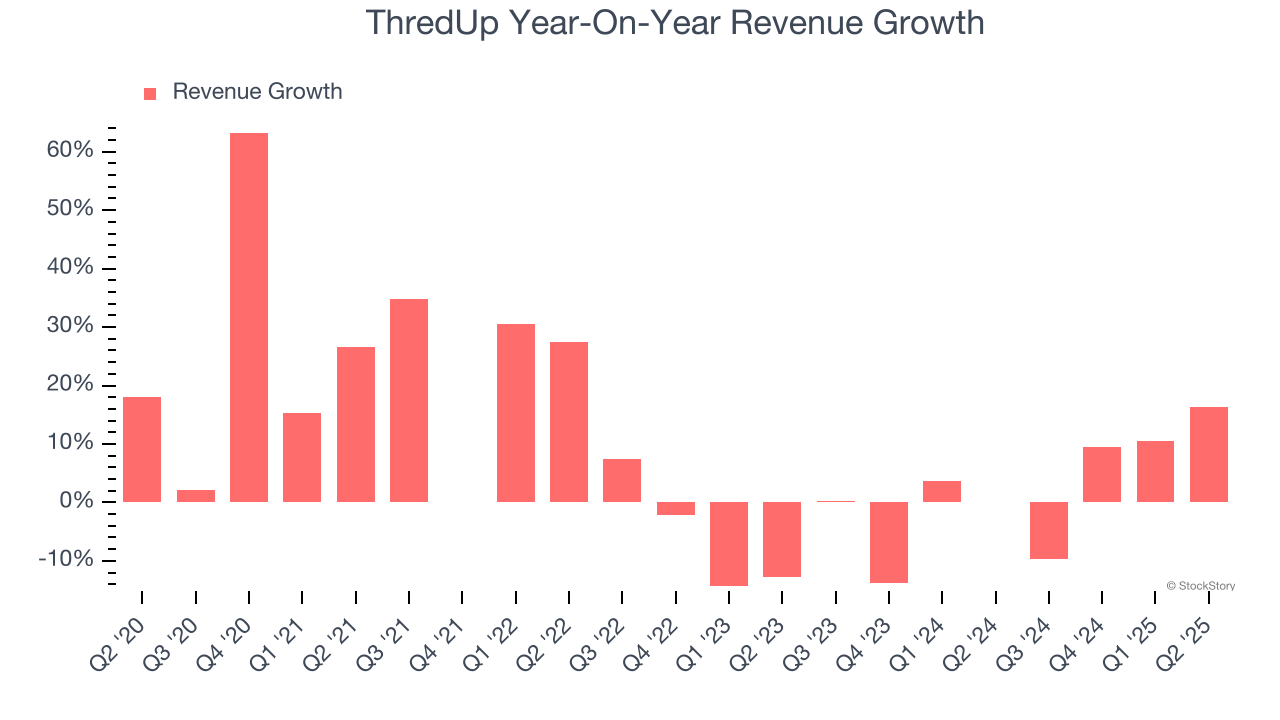
We can better understand the company’s revenue dynamics by analyzing its number of orders, which reached 1.47 million in the latest quarter. Over the last two years, ThredUp’s orders averaged 1.3% year-on-year declines. Because this number is lower than its revenue growth during the same period, we can see the company’s monetization has risen. 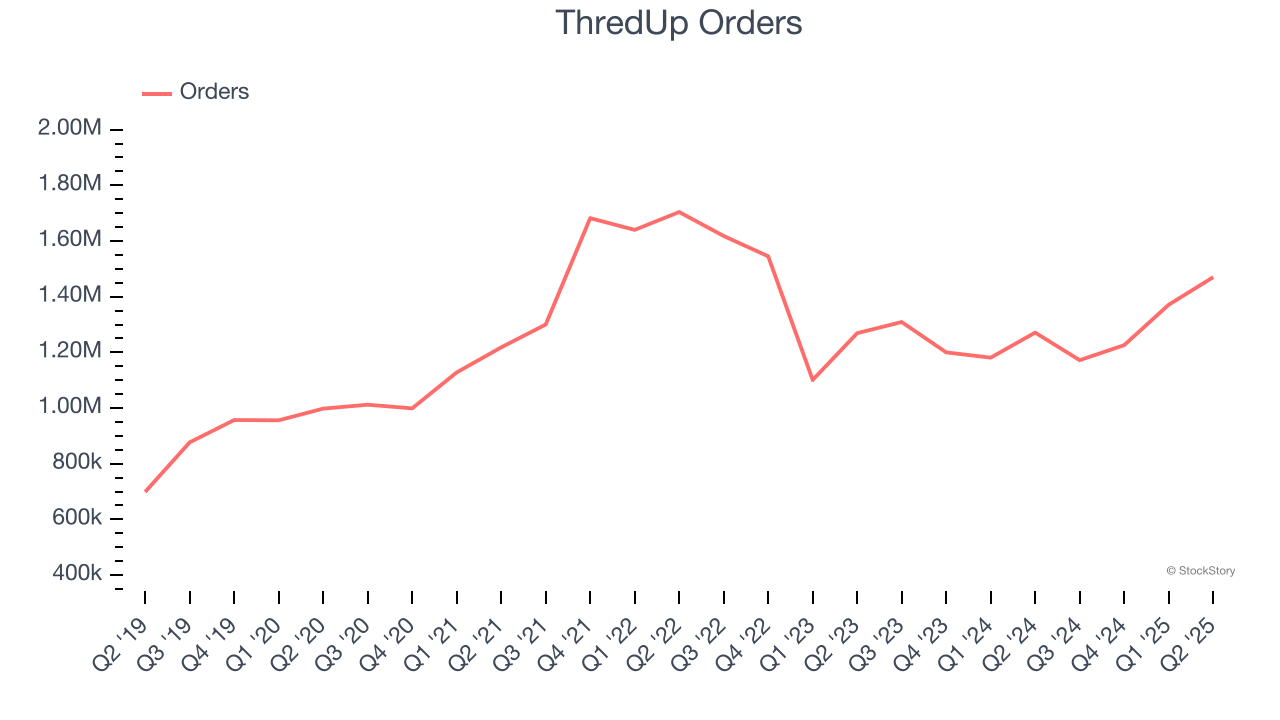
This quarter, ThredUp reported year-on-year revenue growth of 16.4%, and its $77.66 million of revenue exceeded Wall Street’s estimates by 5.2%. Company management is currently guiding for a 20.3% year-on-year increase in sales next quarter.
Looking further ahead, sell-side analysts expect revenue to grow 8.3% over the next 12 months. While this projection suggests its newer products and services will catalyze better top-line performance, it is still below the sector average.
Unless you’ve been living under a rock, it should be obvious by now that generative AI is going to have a huge impact on how large corporations do business. While Nvidia and AMD are trading close to all-time highs, we prefer a lesser-known (but still profitable) stock benefiting from the rise of AI. Click here to access our free report one of our favorites growth stories.
Operating Margin
ThredUp’s operating margin has been trending up over the last 12 months, but it still averaged negative 13.5% over the last two years. This is due to its large expense base and inefficient cost structure.
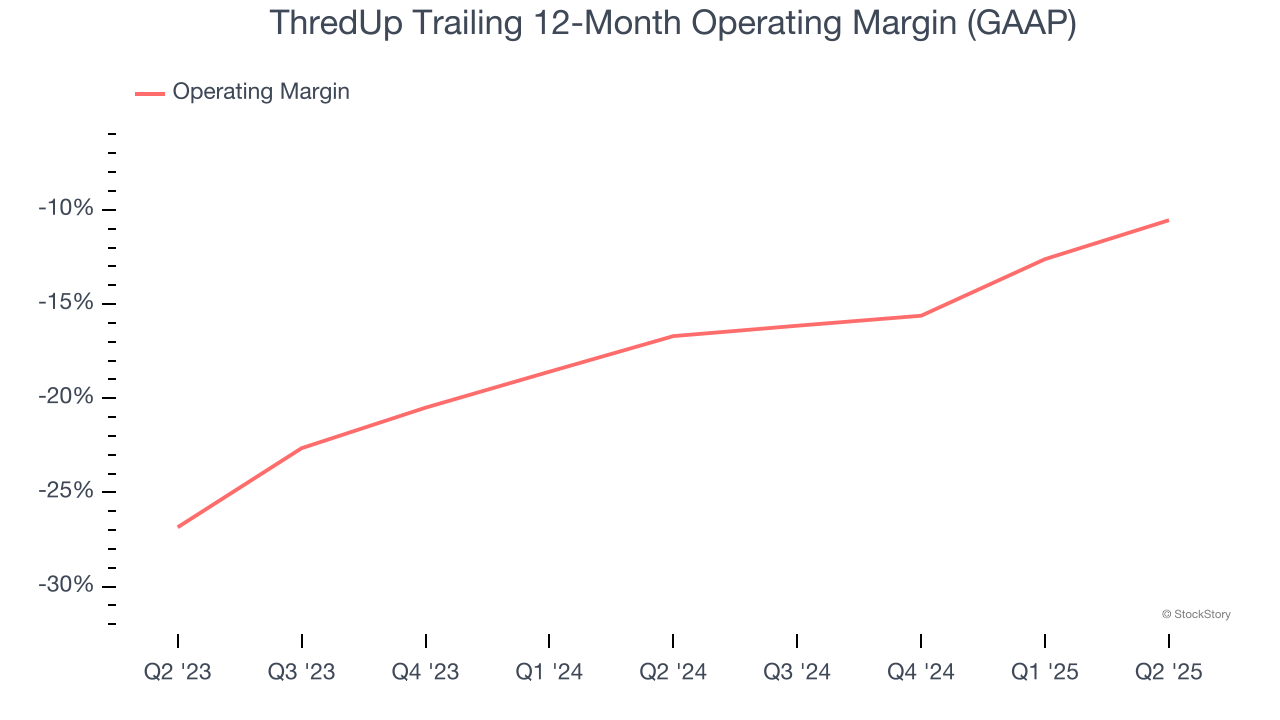
In Q2, ThredUp generated a negative 6.8% operating margin. The company's consistent lack of profits raise a flag.
Earnings Per Share
Revenue trends explain a company’s historical growth, but the long-term change in earnings per share (EPS) points to the profitability of that growth – for example, a company could inflate its sales through excessive spending on advertising and promotions.
Although ThredUp’s full-year earnings are still negative, it reduced its losses and improved its EPS by 34.3% annually over the last five years. The next few quarters will be critical for assessing its long-term profitability.
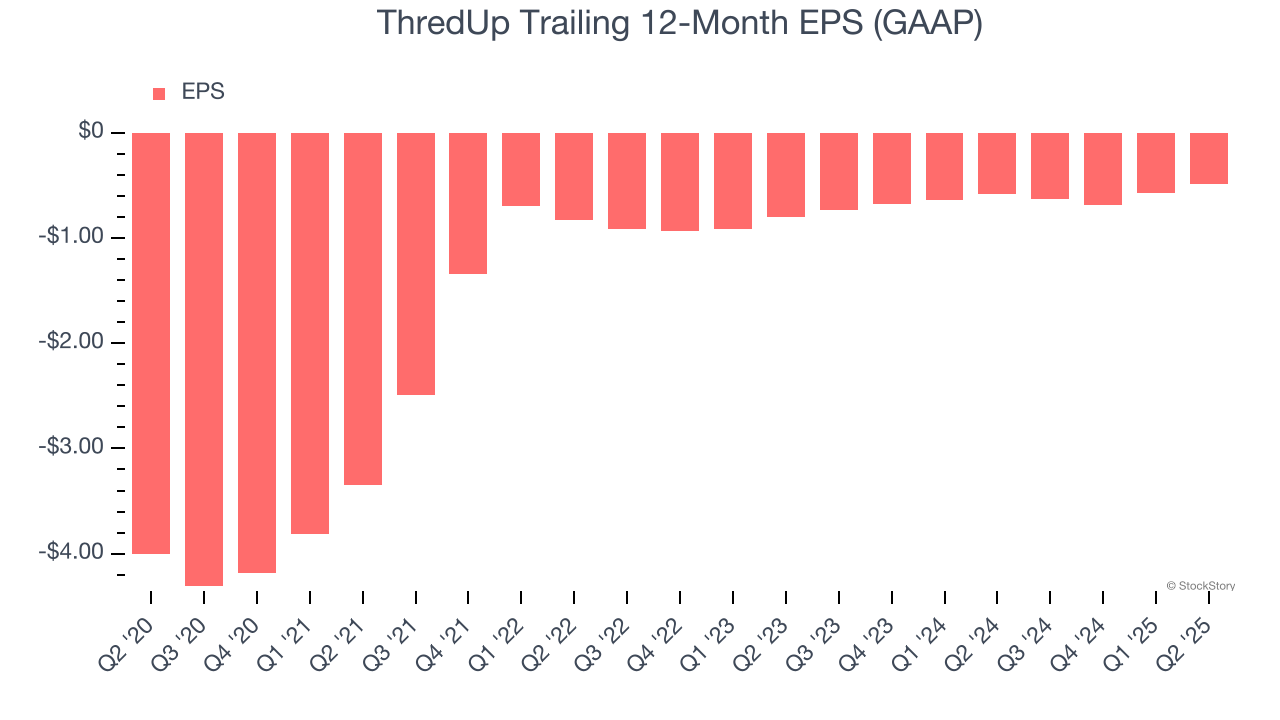
In Q2, ThredUp reported EPS at negative $0.04, up from negative $0.13 in the same quarter last year. This print easily cleared analysts’ estimates, and shareholders should be content with the results. Over the next 12 months, Wall Street is optimistic. Analysts forecast ThredUp’s full-year EPS of negative $0.49 will reach break even.
Key Takeaways from ThredUp’s Q2 Results
We were impressed by how significantly ThredUp blew past analysts’ EBITDA expectations this quarter. We were also glad its full-year revenue guidance trumped Wall Street’s estimates. Zooming out, we think this was a good print with some key areas of upside. The stock traded up 7.8% to $10.47 immediately after reporting.
Indeed, ThredUp had a rock-solid quarterly earnings result, but is this stock a good investment here? When making that decision, it’s important to consider its valuation, business qualities, as well as what has happened in the latest quarter. We cover that in our actionable full research report which you can read here, it’s free.