Aerospace and defense company Textron (NYSE: TXT) reported Q1 CY2026 results topping the market’s revenue expectations, with sales up 11.8% year on year to $3.70 billion. Its non-GAAP profit of $1.45 per share was 11.2% above analysts’ consensus estimates.
Is now the time to buy Textron? Find out by accessing our full research report, it’s free.
Textron (TXT) Q1 CY2026 Highlights:
- Revenue: $3.70 billion vs analyst estimates of $3.48 billion (11.8% year-on-year growth, 6.1% beat)
- Adjusted EPS: $1.45 vs analyst estimates of $1.30 (11.2% beat)
- Adjusted EBITDA: $416 million vs analyst estimates of $393.6 million (11.3% margin, 5.7% beat)
- Management reiterated its full-year Adjusted EPS guidance of $6.50 at the midpoint
- Operating Margin: 8.7%, up from 7.2% in the same quarter last year
- Free Cash Flow was -$250 million compared to -$180 million in the same quarter last year
- Market Capitalization: $15.63 billion
"Textron delivered double-digit revenue and EPS growth in the quarter,” said Textron CEO Lisa M. Atherton.
Company Overview
Listed on the NYSE in 1947, Textron (NYSE: TXT) provides products and services in the aerospace, defense, industrial, and finance sectors.
Revenue Growth
A company’s long-term performance is an indicator of its overall quality. Any business can experience short-term success, but top-performing ones enjoy sustained growth for years. Over the last five years, Textron grew its sales at a tepid 5.3% compounded annual growth rate. This was below our standard for the industrials sector and is a poor baseline for our analysis.
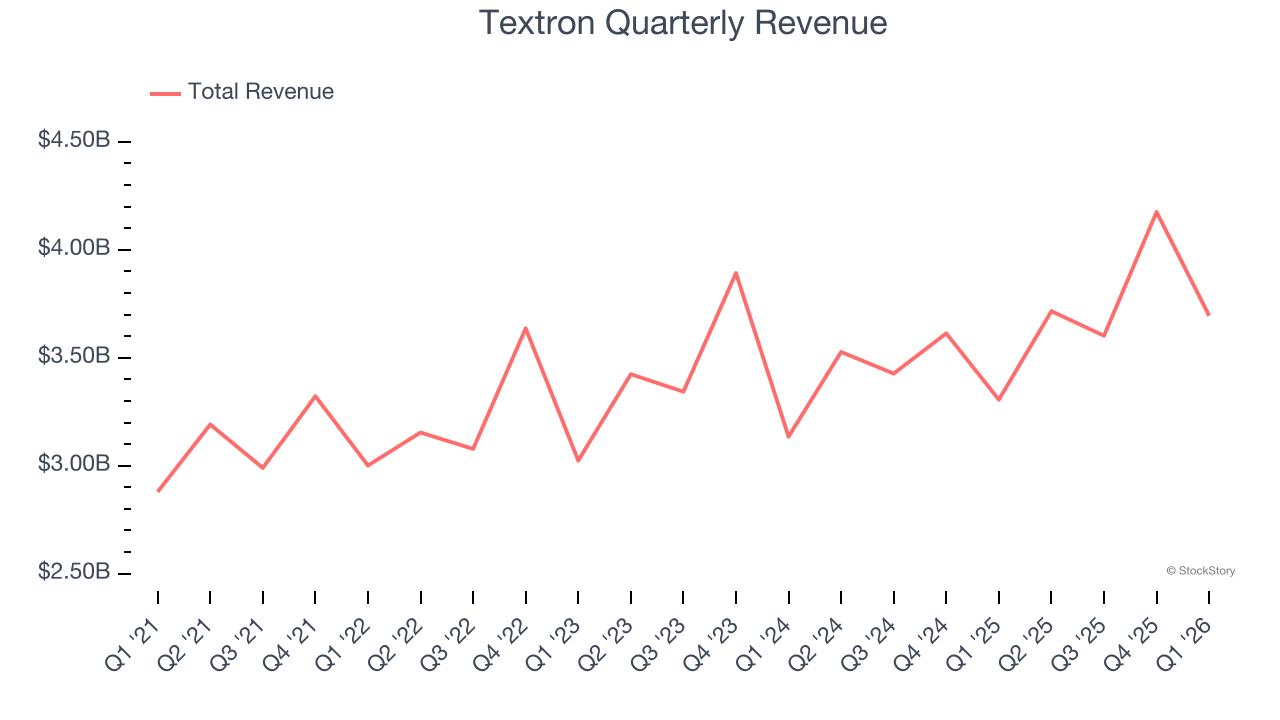
Long-term growth is the most important, but within industrials, a half-decade historical view may miss new industry trends or demand cycles. Textron’s annualized revenue growth of 4.9% over the last two years aligns with its five-year trend, suggesting its demand was consistently weak. 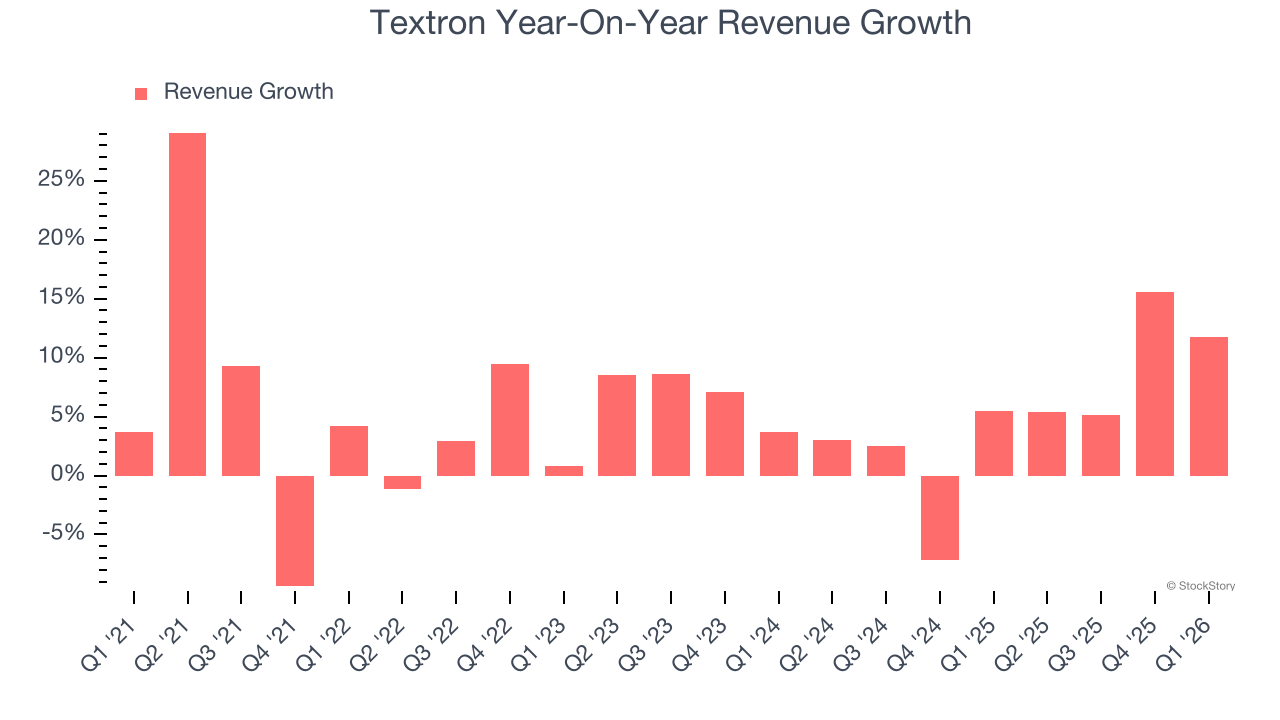
This quarter, Textron reported year-on-year revenue growth of 11.8%, and its $3.70 billion of revenue exceeded Wall Street’s estimates by 6.1%.
Looking ahead, sell-side analysts expect revenue to grow 3.3% over the next 12 months, a slight deceleration versus the last two years. This projection doesn't excite us and indicates its products and services will face some demand challenges.
ALSO WORTH WATCHING: Nvidia’s Quiet Partner. Nvidia’s chips cost a hundred grand. The connectors that make them work cost even more. One company makes them all.
Every AI server needs specialized infrastructure the chip companies don’t make. High-speed cables. Power connectors. Thermal sensors. This 90-year-old company built a monopoly on it. The AI boom just started. This stock is still flying under the radar. Claim The Stock Ticker Here for FREE.
Operating Margin
Operating margin is one of the best measures of profitability because it tells us how much money a company takes home after procuring and manufacturing its products, marketing and selling those products, and most importantly, keeping them relevant through research and development.
Textron’s operating margin has more or less stayed the same over the last 12 months , averaging 8.5% over the last five years. This profitability was higher than the broader industrials sector, showing it did a decent job managing its expenses.
Analyzing the trend in its profitability, Textron’s operating margin might fluctuated slightly but has generally stayed the same over the last five years. This raises questions about the company’s expense base because its revenue growth should have given it leverage on its fixed costs, resulting in better economies of scale and profitability.
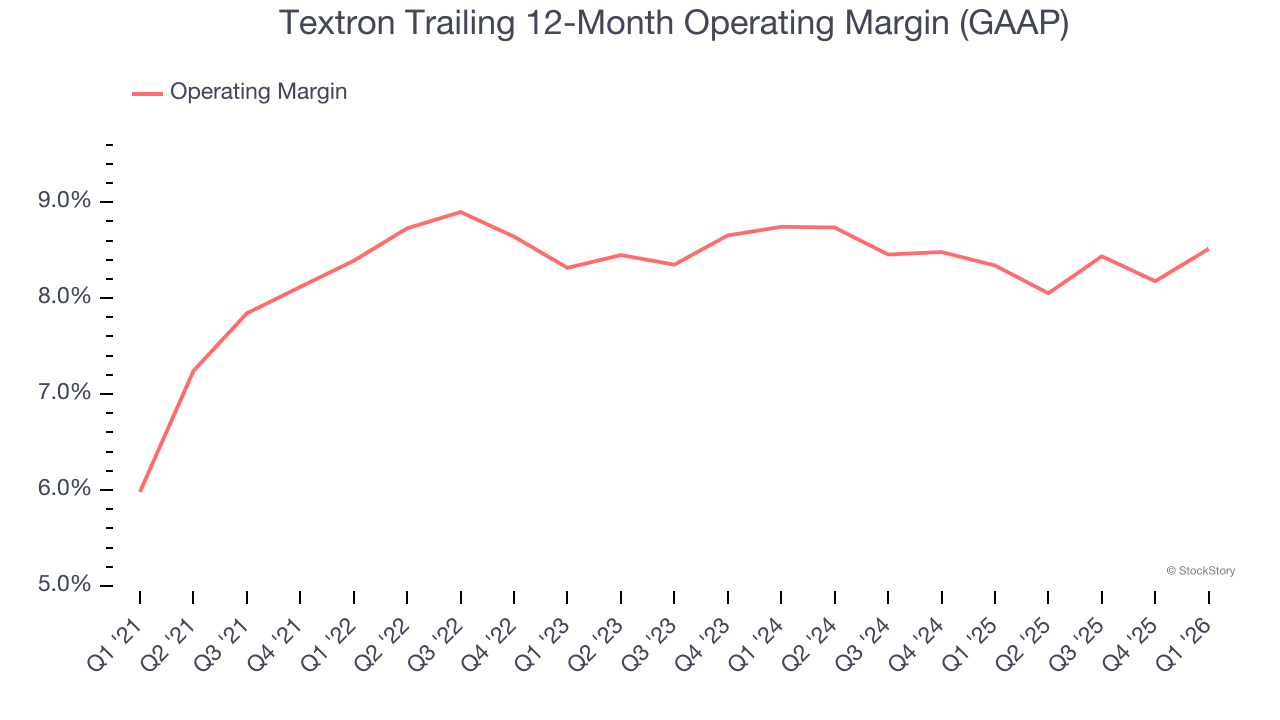
In Q1, Textron generated an operating margin profit margin of 8.7%, up 1.5 percentage points year on year. This increase was a welcome development and shows it was more efficient.
Earnings Per Share
Revenue trends explain a company’s historical growth, but the long-term change in earnings per share (EPS) points to the profitability of that growth – for example, a company could inflate its sales through excessive spending on advertising and promotions.
Textron’s EPS grew at 21% compounded annual growth rate over the last five years, higher than its 5.3% annualized revenue growth. This tells us the company became more profitable on a per-share basis as it expanded.
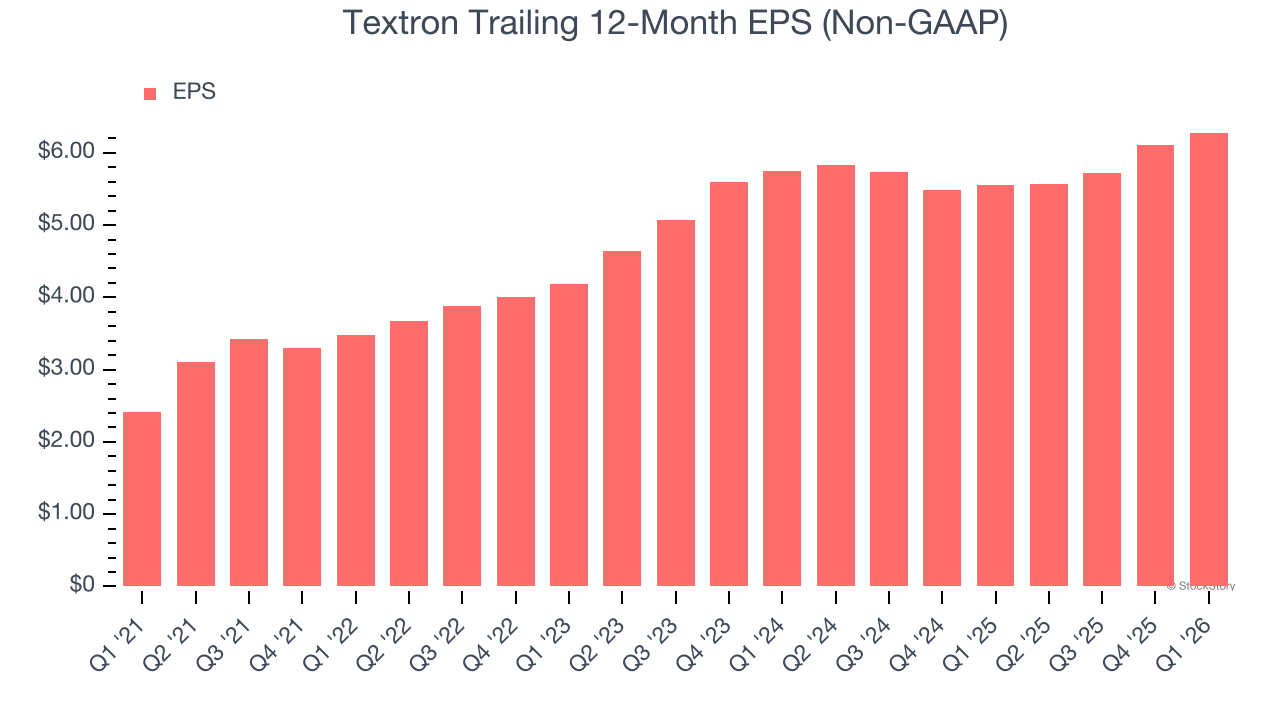
We can take a deeper look into Textron’s earnings to better understand the drivers of its performance. A five-year view shows that Textron has repurchased its stock, shrinking its share count by 22.8%. This tells us its EPS outperformed its revenue not because of increased operational efficiency but financial engineering, as buybacks boost per share earnings. 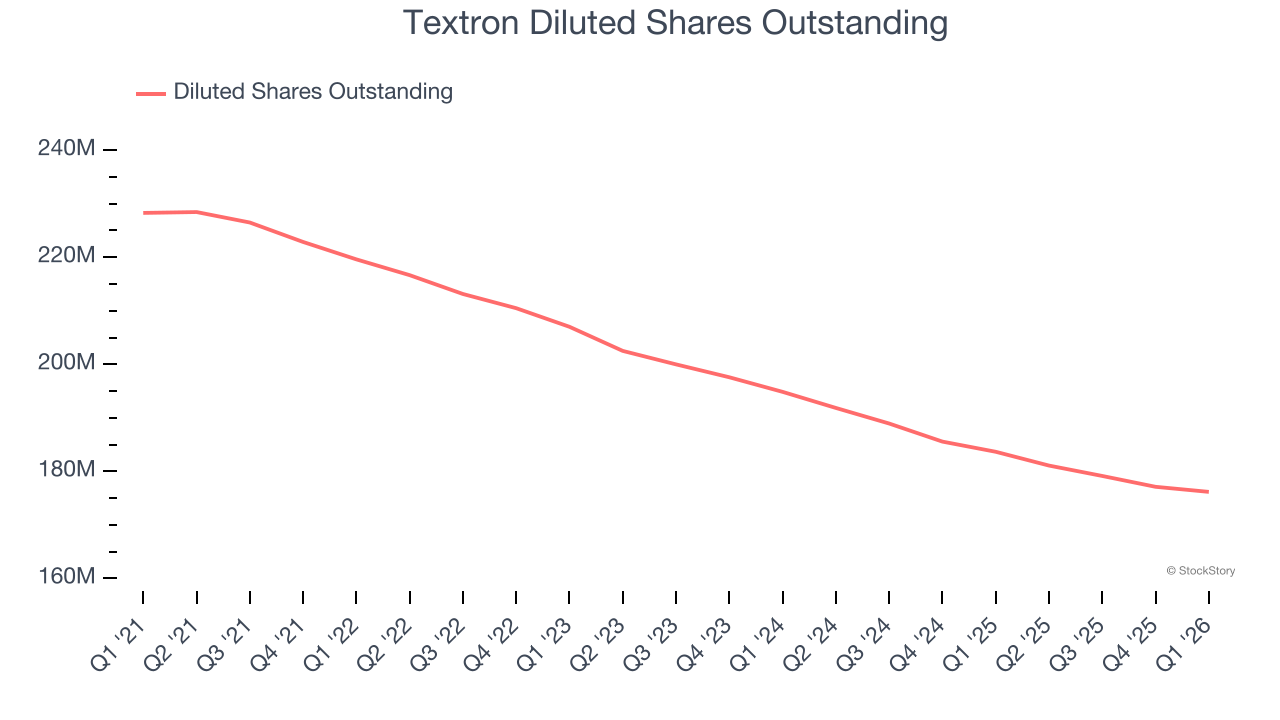
Like with revenue, we analyze EPS over a shorter period to see if we are missing a change in the business.
For Textron, its two-year annual EPS growth of 4.5% was lower than its five-year trend. We hope its growth can accelerate in the future.
In Q1, Textron reported adjusted EPS of $1.45, up from $1.28 in the same quarter last year. This print easily cleared analysts’ estimates, and shareholders should be content with the results. Over the next 12 months, Wall Street expects Textron’s full-year EPS of $6.28 to grow 6.7%.
Key Takeaways from Textron’s Q1 Results
We were impressed by how significantly Textron blew past analysts’ adjusted operating income expectations this quarter. We were also excited its revenue outperformed Wall Street’s estimates by a wide margin. Zooming out, we think this quarter featured some important positives. The stock traded up 3.4% to $92.86 immediately after reporting.
Textron may have had a good quarter, but does that mean you should invest right now? What happened in the latest quarter matters, but not as much as longer-term business quality and valuation, when deciding whether to invest in this stock. We cover that in our actionable full research report which you can read here (it’s free).