
Server solutions provider Super Micro (NASDAQ: SMCI) fell short of the market’s revenue expectations in Q1 CY2026, but sales rose 123% year on year to $10.24 billion. On the other hand, next quarter’s outlook exceeded expectations with revenue guided to $11.75 billion at the midpoint, or 7.6% above analysts’ estimates. Its non-GAAP profit of $0.84 per share was 34.5% above analysts’ consensus estimates.
Is now the time to buy Super Micro? Find out by accessing our full research report, it’s free.
Super Micro (SMCI) Q1 CY2026 Highlights:
- Revenue: $10.24 billion vs analyst estimates of $12.38 billion (123% year-on-year growth, 17.3% miss)
- Adjusted EPS: $0.84 vs analyst estimates of $0.62 (34.5% beat)
- Adjusted EBITDA: $814.3 million vs analyst estimates of $571.9 million (7.9% margin, 42.4% beat)
- Revenue Guidance for Q2 CY2026 is $11.75 billion at the midpoint, above analyst estimates of $10.92 billion
- Adjusted EPS guidance for Q2 CY2026 is $0.72 at the midpoint, above analyst estimates of $0.56
- Operating Margin: 6.1%, up from 3.2% in the same quarter last year
- Free Cash Flow was -$6.70 billion, down from $594.1 million in the same quarter last year
- Market Capitalization: $16.77 billion
Company Overview
Founded in Silicon Valley in 1993 and known for its modular "building block" approach to server design, Super Micro Computer (NASDAQ: SMCI) designs and manufactures high-performance, energy-efficient server and storage systems for data centers, cloud computing, AI, and edge computing applications.
Revenue Growth
A company’s long-term sales performance can indicate its overall quality. Even a bad business can shine for one or two quarters, but a top-tier one grows for years.
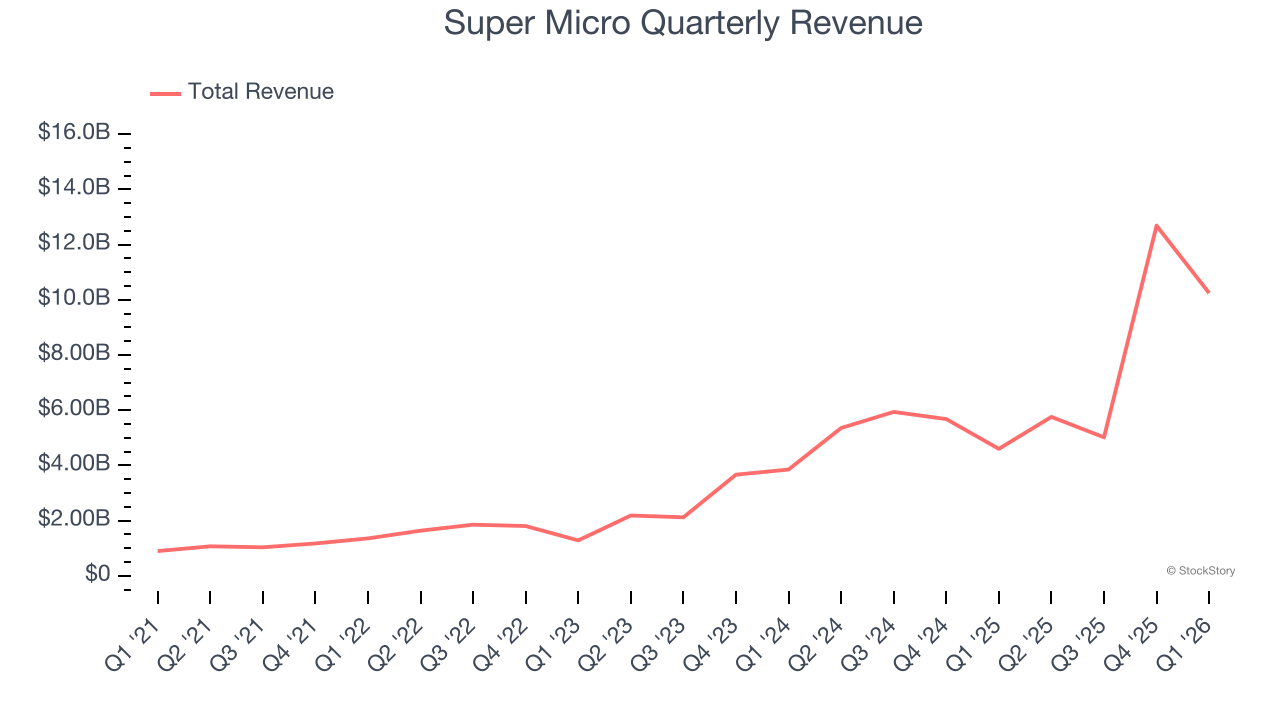
With $33.7 billion in revenue over the past 12 months, Super Micro is a behemoth in the business services sector and benefits from economies of scale, giving it an edge in distribution. This also enables it to gain more leverage on its fixed costs than smaller competitors and the flexibility to offer lower prices.
As you can see below, Super Micro’s 58.4% annualized revenue growth over the last five years was incredible. This is a great starting point for our analysis because it shows Super Micro’s demand was higher than many business services companies.
We at StockStory place the most emphasis on long-term growth, but within business services, a half-decade historical view may miss recent innovations or disruptive industry trends. Super Micro’s annualized revenue growth of 68.9% over the last two years is above its five-year trend, suggesting its demand was strong and recently accelerated. 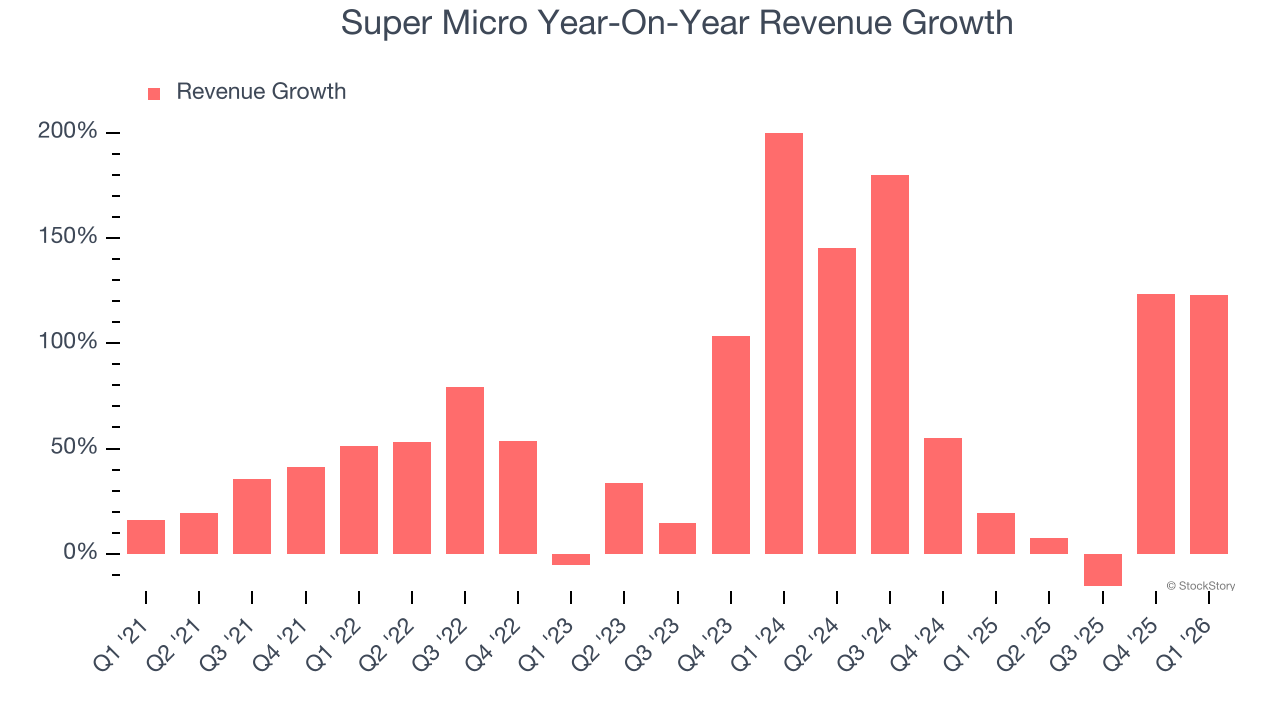
This quarter, Super Micro achieved a magnificent 123% year-on-year revenue growth rate, but its $10.24 billion of revenue fell short of Wall Street’s lofty estimates. Company management is currently guiding for a 104% year-on-year increase in sales next quarter.
Looking further ahead, sell-side analysts expect revenue to grow 37.5% over the next 12 months, a deceleration versus the last two years. Still, this projection is eye-popping given its scale and indicates the market is forecasting success for its products and services.
ONE MORE THING: 3 Hidden Platforms Growing 3X Faster than Amazon, Google, and PayPal. Amazon, Google, and Meta all followed the same playbook: Dominate an ignored market. Build an unbeatable moat. Scale until you’re unstoppable.
These three platforms are running that exact playbook right now. The early investors in Amazon made fortunes. The early investors in these could do the same. Get All 3 Stocks Here for FREE.
Adjusted Operating Margin
Super Micro’s adjusted operating margin has generally stayed the same over the last 12 months, averaging 7.4% over the last five years. This profitability was paltry for a business services business and caused by its suboptimal cost structure.
Looking at the trend in its profitability, Super Micro’s adjusted operating margin might fluctuated slightly but has generally stayed the same over the last five years. This raises questions about the company’s expense base because its revenue growth should have given it leverage on its fixed costs, resulting in better economies of scale and profitability.
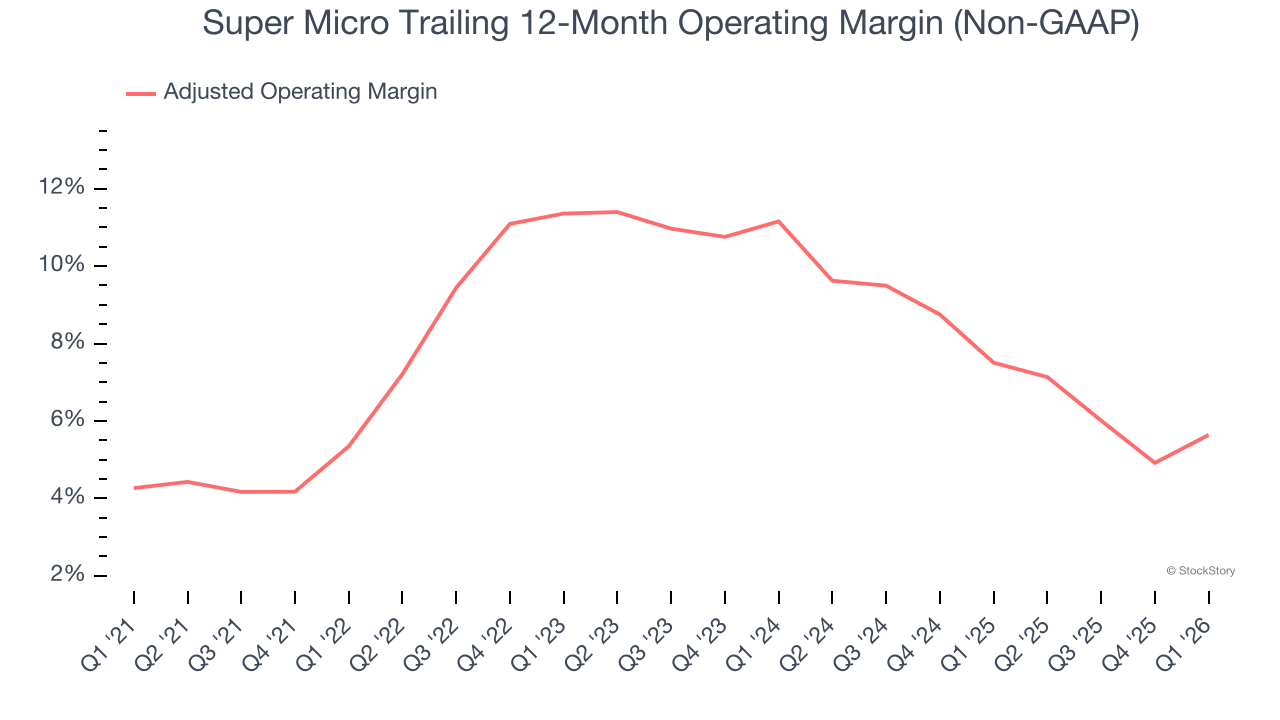
In Q1, Super Micro generated an adjusted operating margin profit margin of 7.3%, up 2.3 percentage points year on year. This increase was a welcome development and shows it was more efficient.
Earnings Per Share
Revenue trends explain a company’s historical growth, but the long-term change in earnings per share (EPS) points to the profitability of that growth – for example, a company could inflate its sales through excessive spending on advertising and promotions.
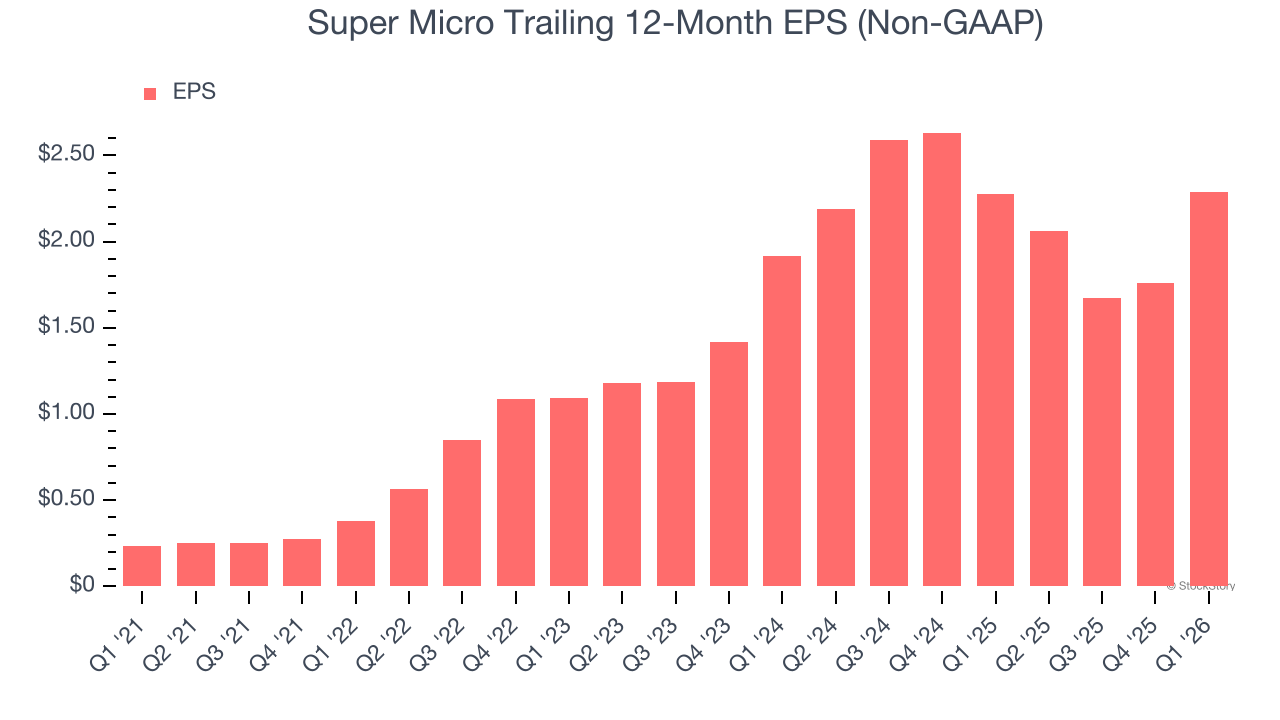
Super Micro’s astounding 57.5% annual EPS growth over the last five years aligns with its revenue performance. This tells us its incremental sales were profitable.
Like with revenue, we analyze EPS over a shorter period to see if we are missing a change in the business.
Super Micro’s two-year annual EPS growth of 9.3% was mediocre and lower than its 68.9% two-year revenue growth.
We can take a deeper look into Super Micro’s earnings to better understand the drivers of its performance. We mentioned earlier that Super Micro’s adjusted operating margin expanded this quarter, but a two-year view shows its margin has declinedwhile its share count has grown 12.7%. This means the company not only became less efficient with its operating expenses but also diluted its shareholders. 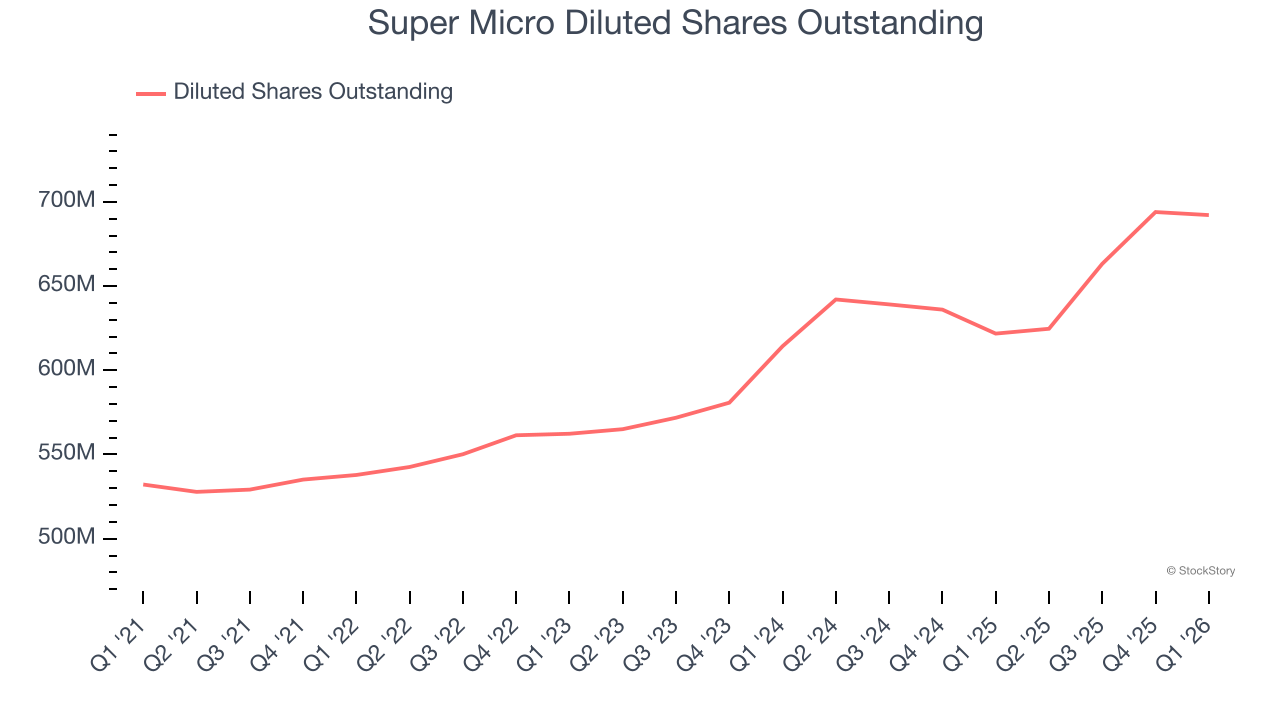
In Q1, Super Micro reported adjusted EPS of $0.84, up from $0.31 in the same quarter last year. This print easily cleared analysts’ estimates, and shareholders should be content with the results. Over the next 12 months, Wall Street expects Super Micro’s full-year EPS of $2.29 to grow 17.1%.
Key Takeaways from Super Micro’s Q1 Results
It was good to see Super Micro beat analysts’ EPS expectations this quarter. We were also excited its EPS guidance for next quarter outperformed Wall Street’s estimates by a wide margin. On the other hand, its full-year revenue guidance missed and its revenue fell short of Wall Street’s estimates. Overall, we think this was still a decent quarter with some key metrics above expectations. The stock traded up 11.6% to $31.12 immediately following the results.
Super Micro had an encouraging quarter, but one earnings result doesn’t necessarily make the stock a buy. Let’s see if this is a good investment. When making that decision, it’s important to consider its valuation, business qualities, as well as what has happened in the latest quarter. We cover that in our actionable full research report which you can read here (it’s free).


