

Let’s dig into the relative performance of MSCI (NYSE: MSCI) and its peers as we unravel the now-completed Q1 financial exchanges & data earnings season.
Financial exchanges and data providers operate trading platforms and sell market information. They enjoy relatively stable revenue from trading fees and subscriptions, increasing demand for data analytics, and expansion opportunities in emerging markets. Challenges include regulatory oversight of market structure, competition from alternative trading venues, and substantial technology investments needed to maintain low-latency trading infrastructure and data security.
The 10 financial exchanges & data stocks we track reported a satisfactory Q1. As a group, revenues beat analysts’ consensus estimates by 1.2%.
While some financial exchanges & data stocks have fared somewhat better than others, they have collectively declined. On average, share prices are down 1.9% since the latest earnings results.
MSCI (NYSE: MSCI)
Originally known as Morgan Stanley Capital International before becoming independent in 2007, MSCI (NYSE: MSCI) provides critical decision support tools, indexes, and analytics that help global investors understand risk and return factors and build more effective investment portfolios.
MSCI reported revenues of $850.8 million, up 14.1% year on year. This print exceeded analysts’ expectations by 1.4%. Overall, it was a satisfactory quarter for the company with a narrow beat of analysts’ revenue estimates.
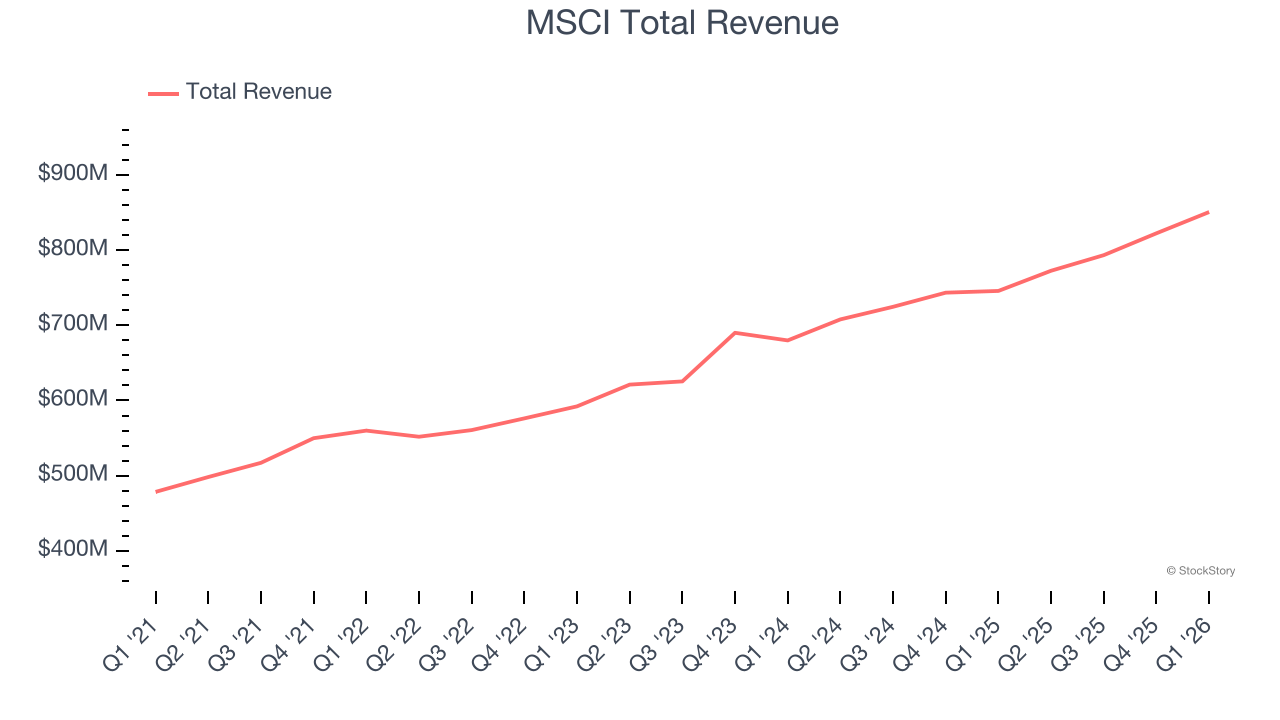
Interestingly, the stock is up 8.6% since reporting and currently trades at $615.51.
Is now the time to buy MSCI? Access our full analysis of the earnings results here, it’s free.
Best Q1: Morningstar (NASDAQ: MORN)
Founded in 1984 by Joe Mansueto with just $80,000 in personal savings, Morningstar (NASDAQ: MORN) provides independent investment data, research, and analysis tools that help investors, advisors, and institutions make informed financial decisions.
Morningstar reported revenues of $644.8 million, up 10.8% year on year, outperforming analysts’ expectations by 2.9%. The business had a very strong quarter with an impressive beat of analysts’ EBITDA and EPS estimates.
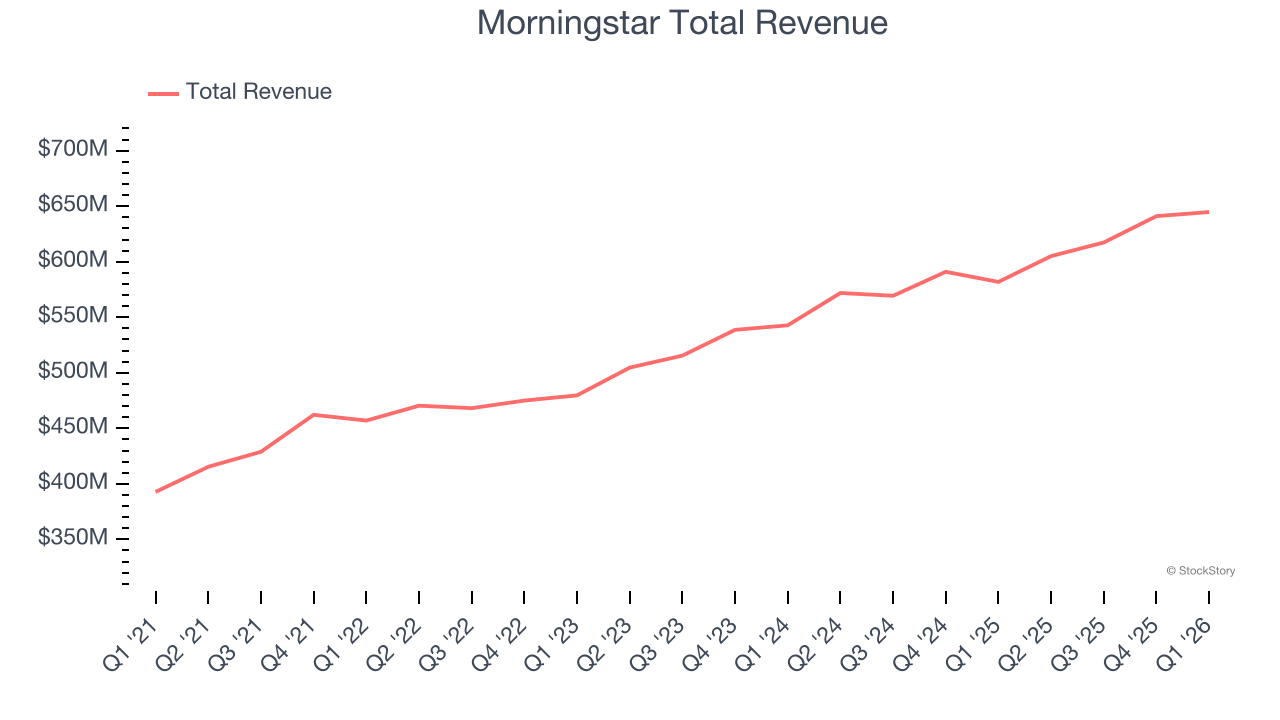
Morningstar pulled off the biggest analyst estimate beat among its peers. However, the results were likely priced into the stock as it’s traded sideways since reporting. Shares currently sit at $185.85.
Is now the time to buy Morningstar? Access our full analysis of the earnings results here, it’s free.
Weakest Q1: CME Group (NASDAQ: CME)
Born from the Chicago Mercantile Exchange founded in 1898 as a butter and egg trading venue, CME Group (NASDAQ: CME) operates the world's largest derivatives marketplace where traders can buy and sell futures and options contracts across interest rates, equities, currencies, commodities, and more.
CME Group reported revenues of $1.88 billion, up 14.5% year on year, falling short of analysts’ expectations by 1.3%. It was a slower quarter as it posted a miss of analysts’ EBITDA and revenue estimates.
CME Group delivered the weakest performance against analyst estimates in the group. As expected, the stock is down 9.6% since the results and currently trades at $257.08.
Read our full analysis of CME Group’s results here.
Nasdaq (NASDAQ: NDAQ)
Originally founded in 1971 as the world's first electronic stock market, Nasdaq (NASDAQ: NDAQ) operates global exchanges and provides technology, data, and corporate services that help companies, investors, and financial institutions navigate capital markets.
Nasdaq reported revenues of $1.41 billion, up 13.7% year on year. This number beat analysts’ expectations by 2.2%. It was a strong quarter as it also recorded an impressive beat of analysts’ EBITDA estimates and a decent beat of analysts’ revenue estimates.
The stock is flat since reporting and currently trades at $86.99.
Read our full, actionable report on Nasdaq here, it’s free.
S&P Global (NYSE: SPGI)
Tracing its roots back to 1860 when it published the first railroad industry manual, S&P Global (NYSE: SPGI) provides credit ratings, market intelligence, commodity data, automotive analytics, and financial indices that help investors and businesses make decisions.
S&P Global reported revenues of $4.17 billion, up 10.4% year on year. This result surpassed analysts’ expectations by 2.4%. Zooming out, it was a satisfactory quarter as it also logged a solid beat of analysts’ EBITDA estimates but full-year EPS guidance slightly missing analysts’ expectations.
The stock is down 3% since reporting and currently trades at $423.95.
Read our full, actionable report on S&P Global here, it’s free.
Market Update
Late in 2025 into early 2026, there was hand-wringing around artificial intelligence. For software companies, the fear was that AI would erode pricing power and compress margins as new tools made it easier to replicate what once required expensive enterprise platforms. Crypto investors had their own version of the same anxiety: if AI agents could trade, allocate capital, and manage wallets autonomously, what exactly was the long-term value of today’s crypto infrastructure?
These concerns triggered a noticeable rotation away from these sectors and into safer havens. But markets rarely dwell on one narrative for long. Spring 2026 came, and the focus shifted abruptly from technological disruption to geopolitical risk. The US’ conflict with Iran became the dominant driver of market psychology, and when geopolitics takes center stage, the script changes quickly. Investors stop debating growth rates and start worrying about oil supply, inflation, and global stability.
Want to invest in winners with rock-solid fundamentals? Check out our Hidden Gem Stocks and add them to your watchlist. These companies are poised for growth regardless of the political or macroeconomic climate.
StockStory’s analyst team — all seasoned professional investors — uses quantitative analysis and automation to deliver market-beating insights faster and with higher quality.


