
I am no fan of small-cap investing. And I haven’t been for at least the past decade or so. That’s partly a market structure issue, and partly due to how the original small-cap ETF, the $64 billion iShares Russell 2000 ETF (IWM), has turned into a psedo-junkyard for highly indebted public companies.
It is estimated that 2 out of 5 stocks in that heavily populated index are vulnerable to sustained higher interest rates. That is, they need to roll over existing debt in the next few years, and much of that debt is currently at lower borrowing rates than they are likely to get this time around. For some of those 2,000 stocks, there’s a “going concern” issue.
But even putting that aside, when I look at two of the biggies in small-cap ETF land, and a smaller one, with “only” $3.7 billion in assets, I don’t get a warm and fuzzy feeling. I get more of a sense that smaller stock prices are bound to get smaller.
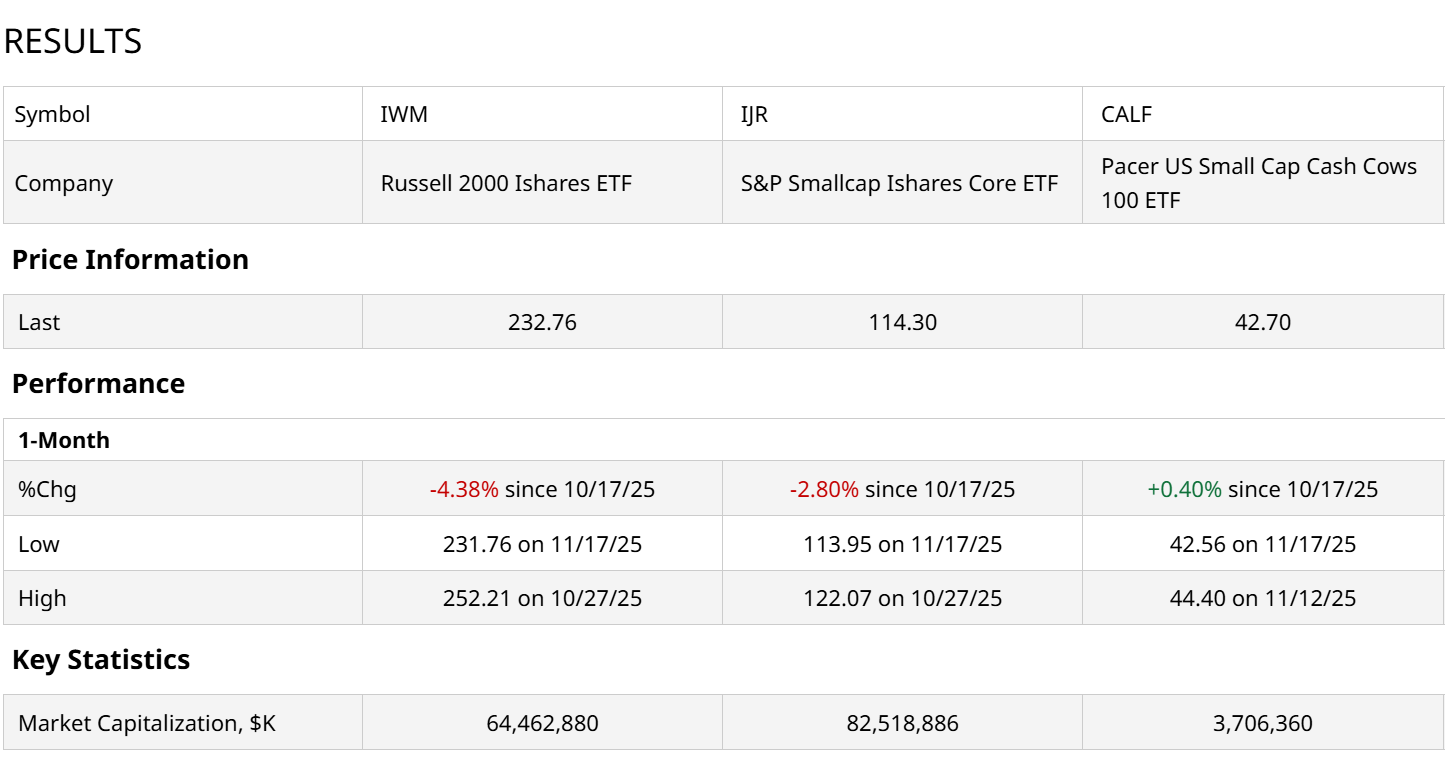
You can see from that table above that small-caps have lagged behind large-cap stocks this year. That’s been par for the course for a while. The growth of giant tech businesses has eroded the former “small-cap effect” that drew investors into lower market-cap stocks, since they had some advantages. One of those was faster growth rates in revenue and earnings.
But the giants of the stock market are also where the growth is. That breaks a lot of long-held traditions. Including, for now, the small-cap effect.
How Do Small-Cap ETF Charts Look Right Now?
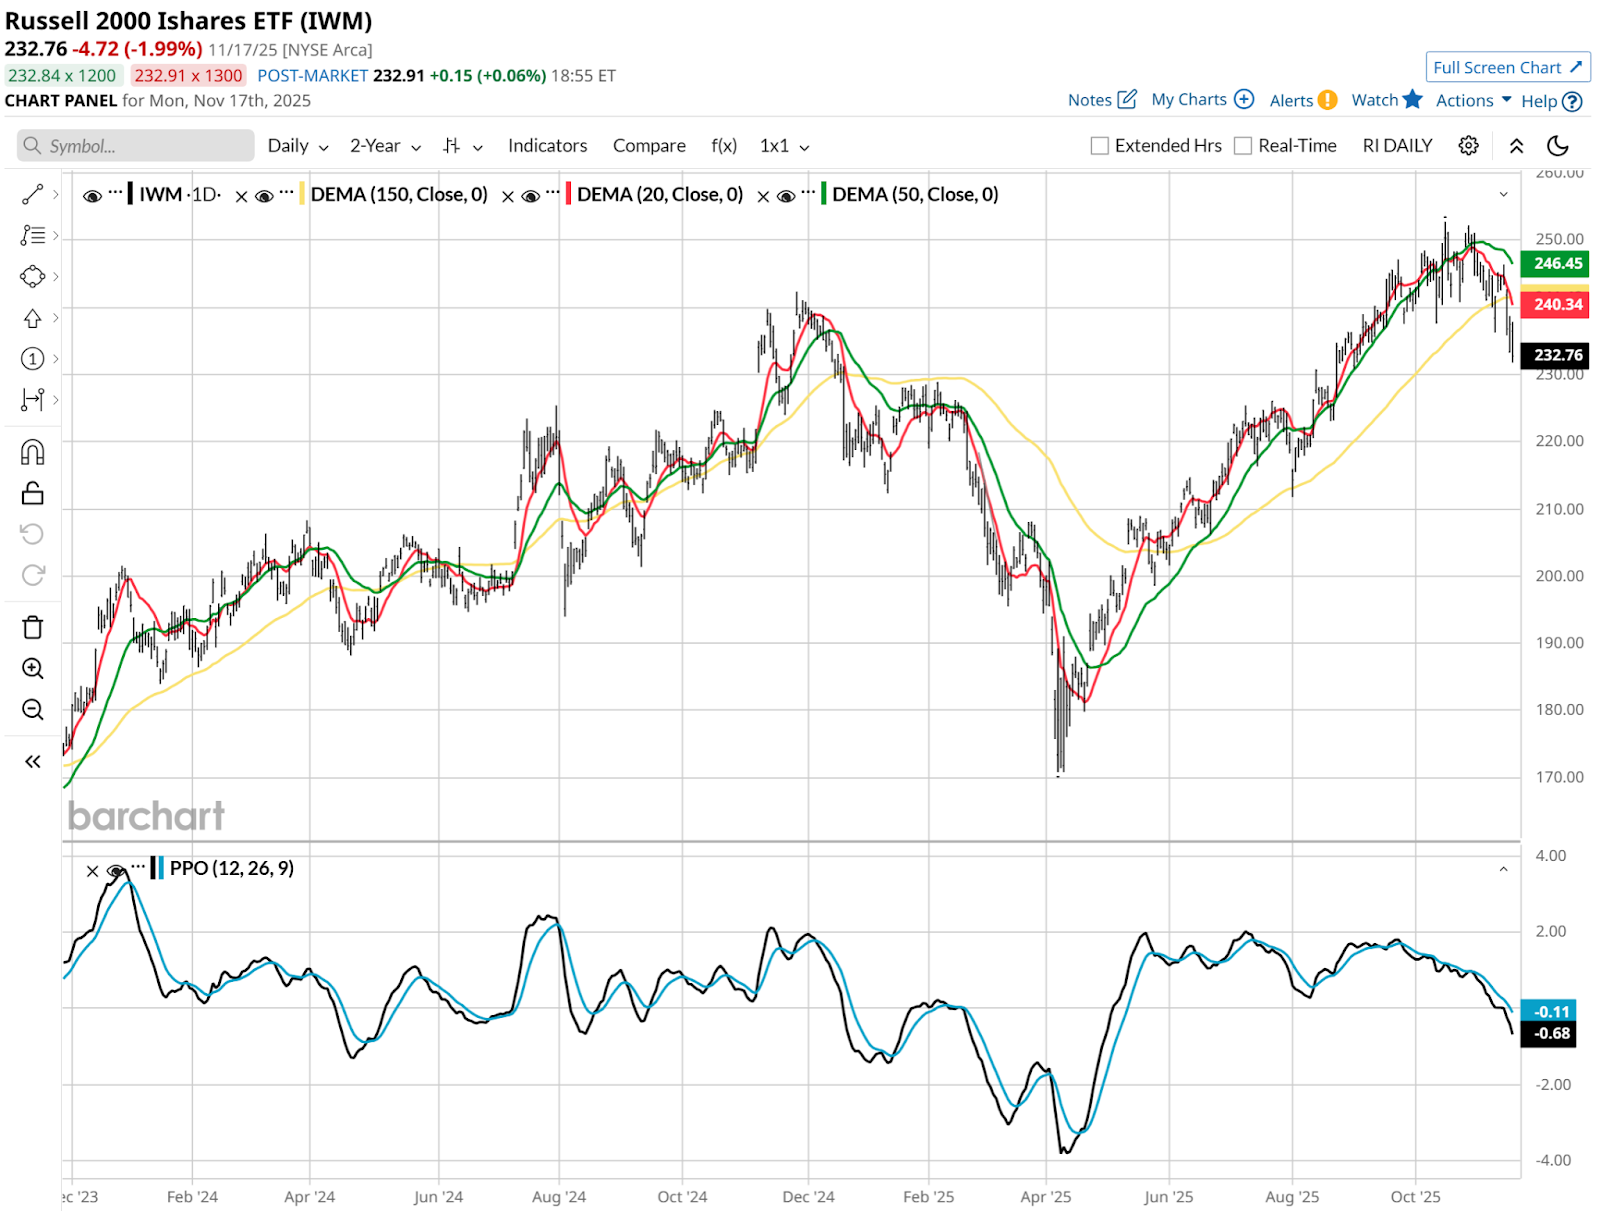
In a word: awful. Here’s IWM on a daily basis. What do I see? Nothing good. My approach to investing is acknowledging that anything can go up in price at any time. But risk of major loss is what separates one security from another. And that is what I focus on.
IWM is a high-risk bet, and I don’t make those. This is about as classic a high-risk chart picture as you’ll see. The 20-day moving average (in red) has rolled over, and now the 50-day (in green) has joined it. And the Percentage Price Oscillator (PPO) indicator at the bottom of the chart just went below zero, for the first time since last spring. There’s no spring in this chart.
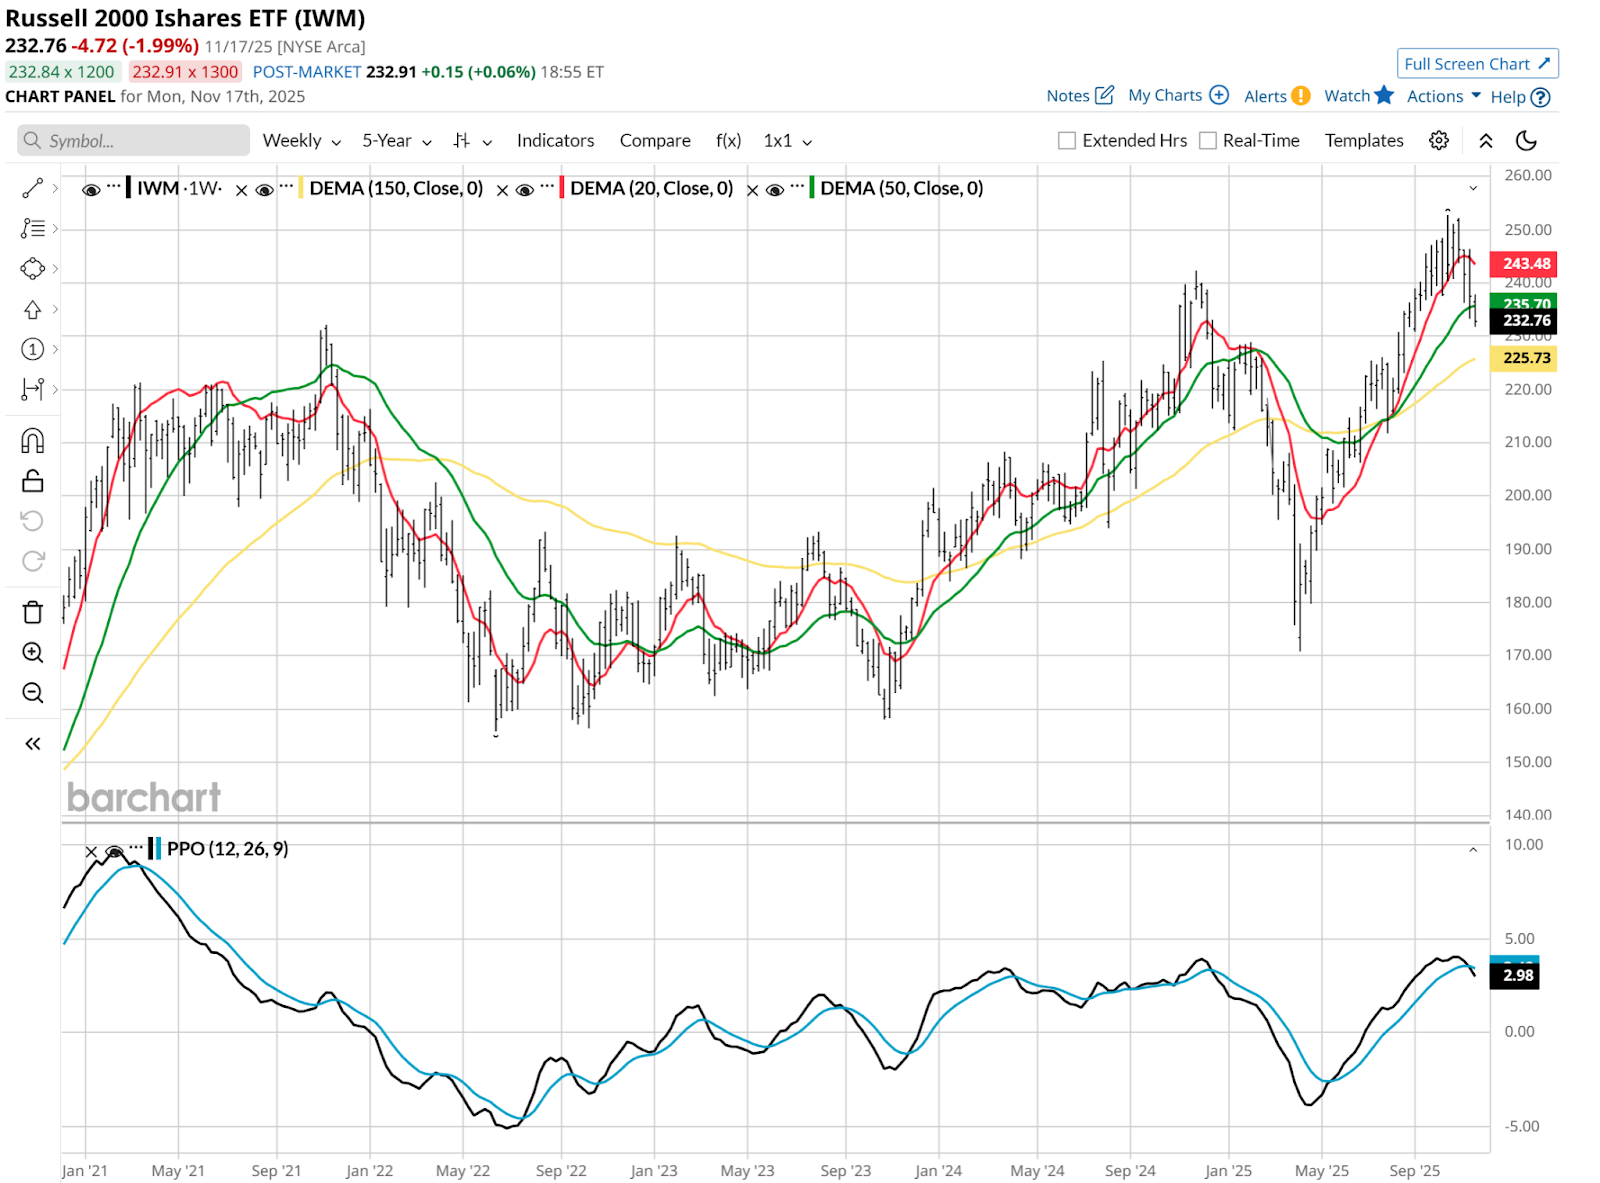
The weekly looks equally as vulnerable. The same situation exists with the 20- and 50-week moving averages as with the dailies above. And the PPO below looks more likely than not to do a repeat of what happened last December, in direction, if not magnitude. Last time around, a nearly 30% drop from top to bottom occurred.
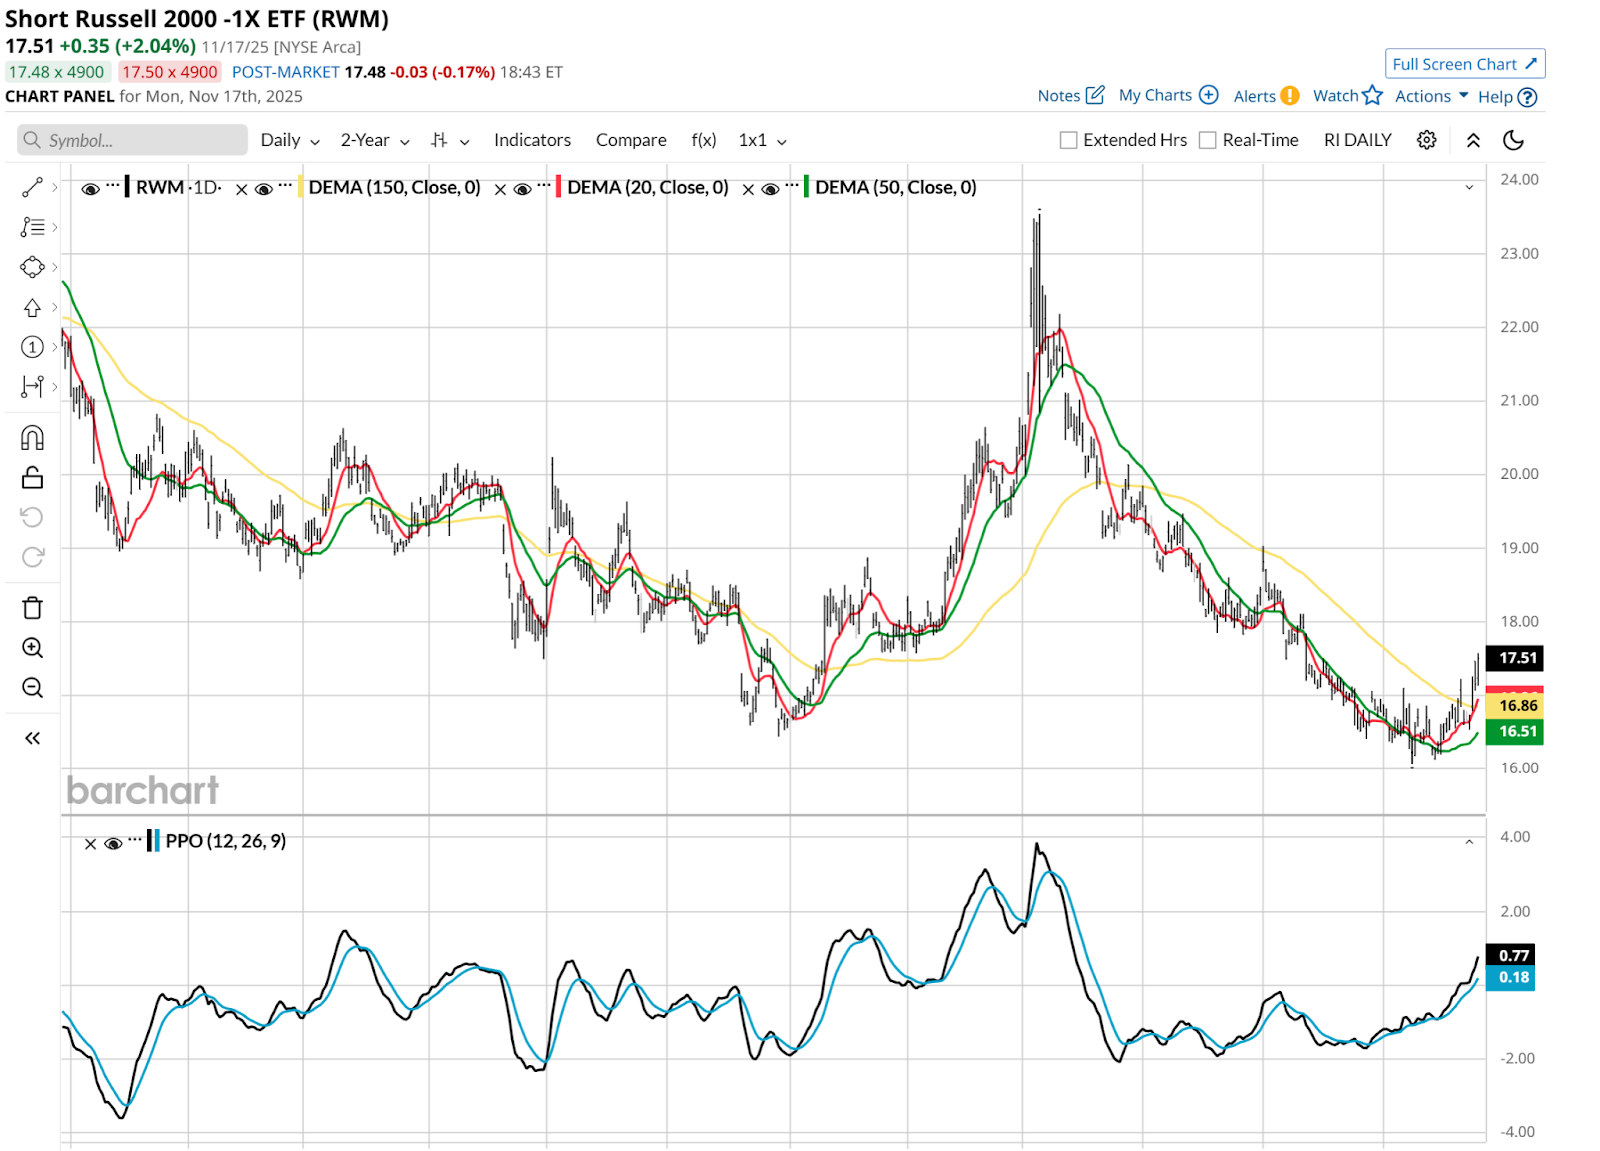
So, what does look good in small-cap land? An ETF that is essentially designed to be the opposite of IWM on a daily basis. That’s the iShares Short Russell 2000 -1X ETF (RWM). Its chart is more of what I’m looking for to take lower risk in trying to profit. All of the coordinates from the above pictures are upside down in RWM’s chart below. That’s a good sign for those who own it.
Oh, but perhaps there are other areas of the small-cap arena that might be more encouraging.
That’s a nice thought, Rob, but it is not the case.
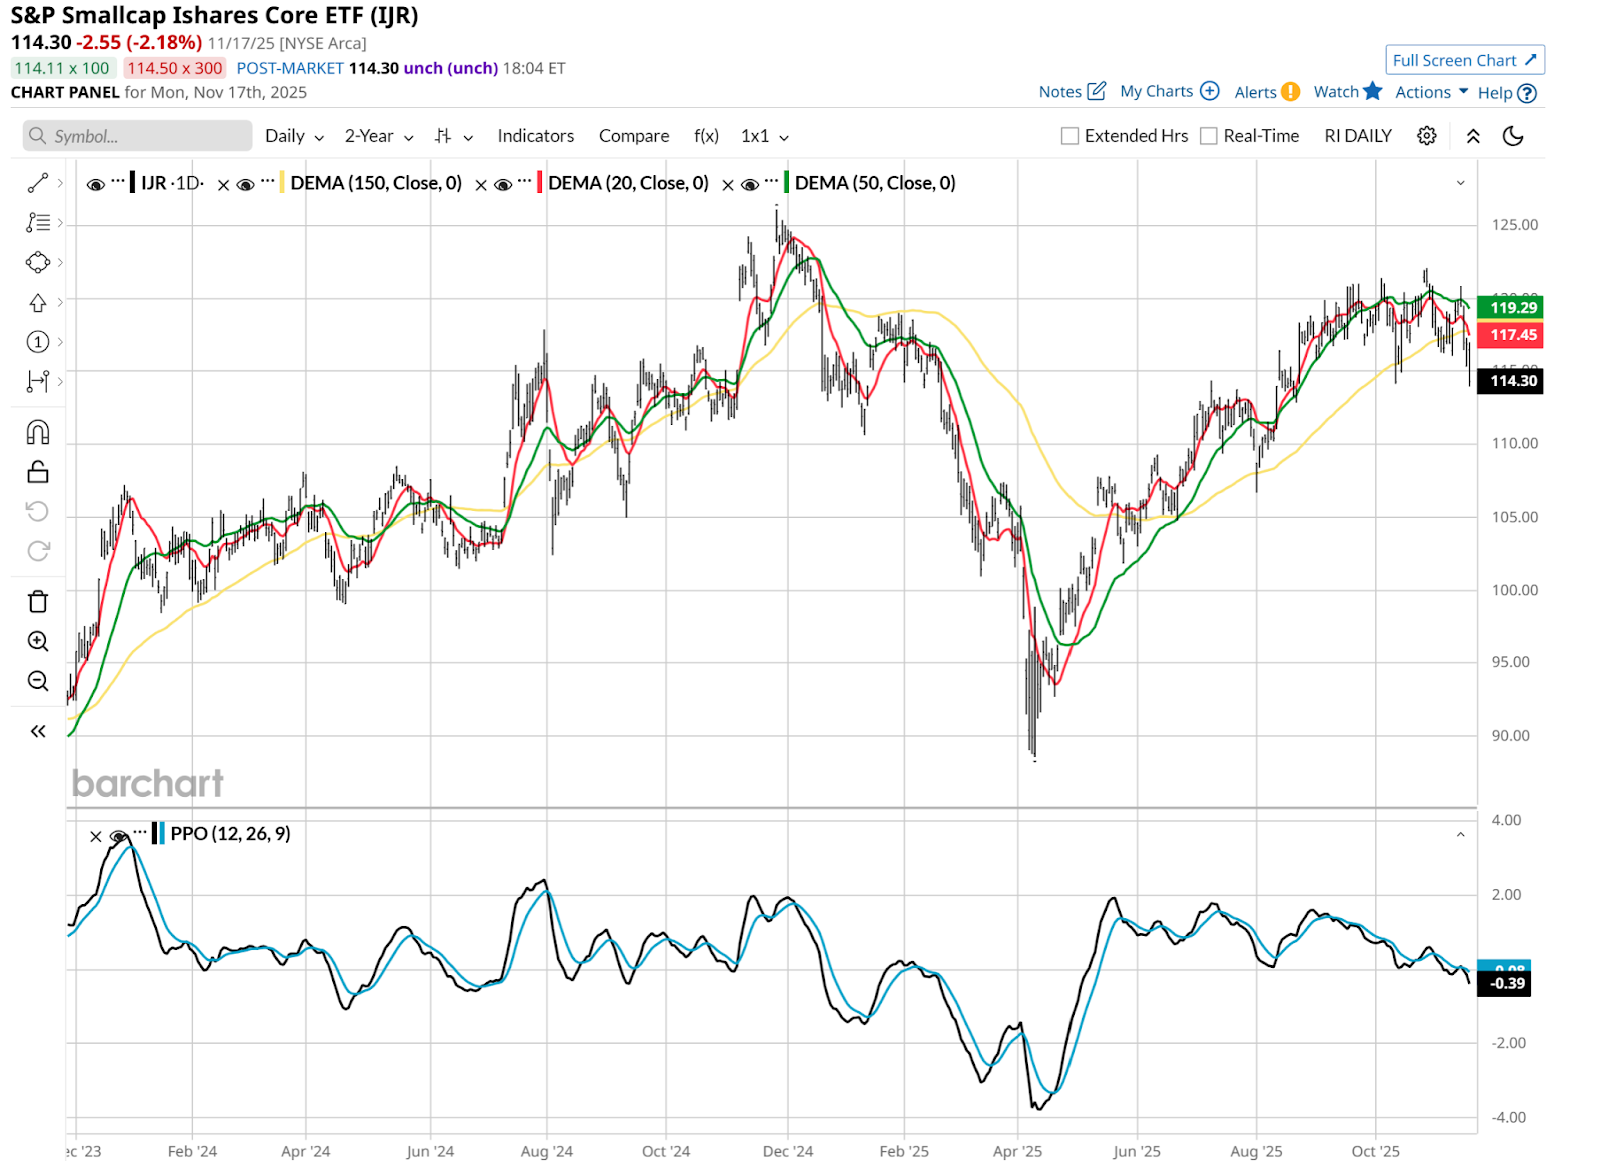
Is IJR Better Than IWM for Small-Cap ETF Investing?
First let’s view the iShares S&P 600 Small Cap ETF (IJR), which is bigger in asset size than IWM, and based on an index that has a tighter quality screen. IJR’s index, and thus the ETF, requires companies to have positive earnings. Otherwise, they don’t make the cut.
But all that has done for the chart is make it look to me like its decline will be slower, and perhaps less volatile. But it doesn’t look positive to me. That steadily lower PPO is what a downtrend looks like.
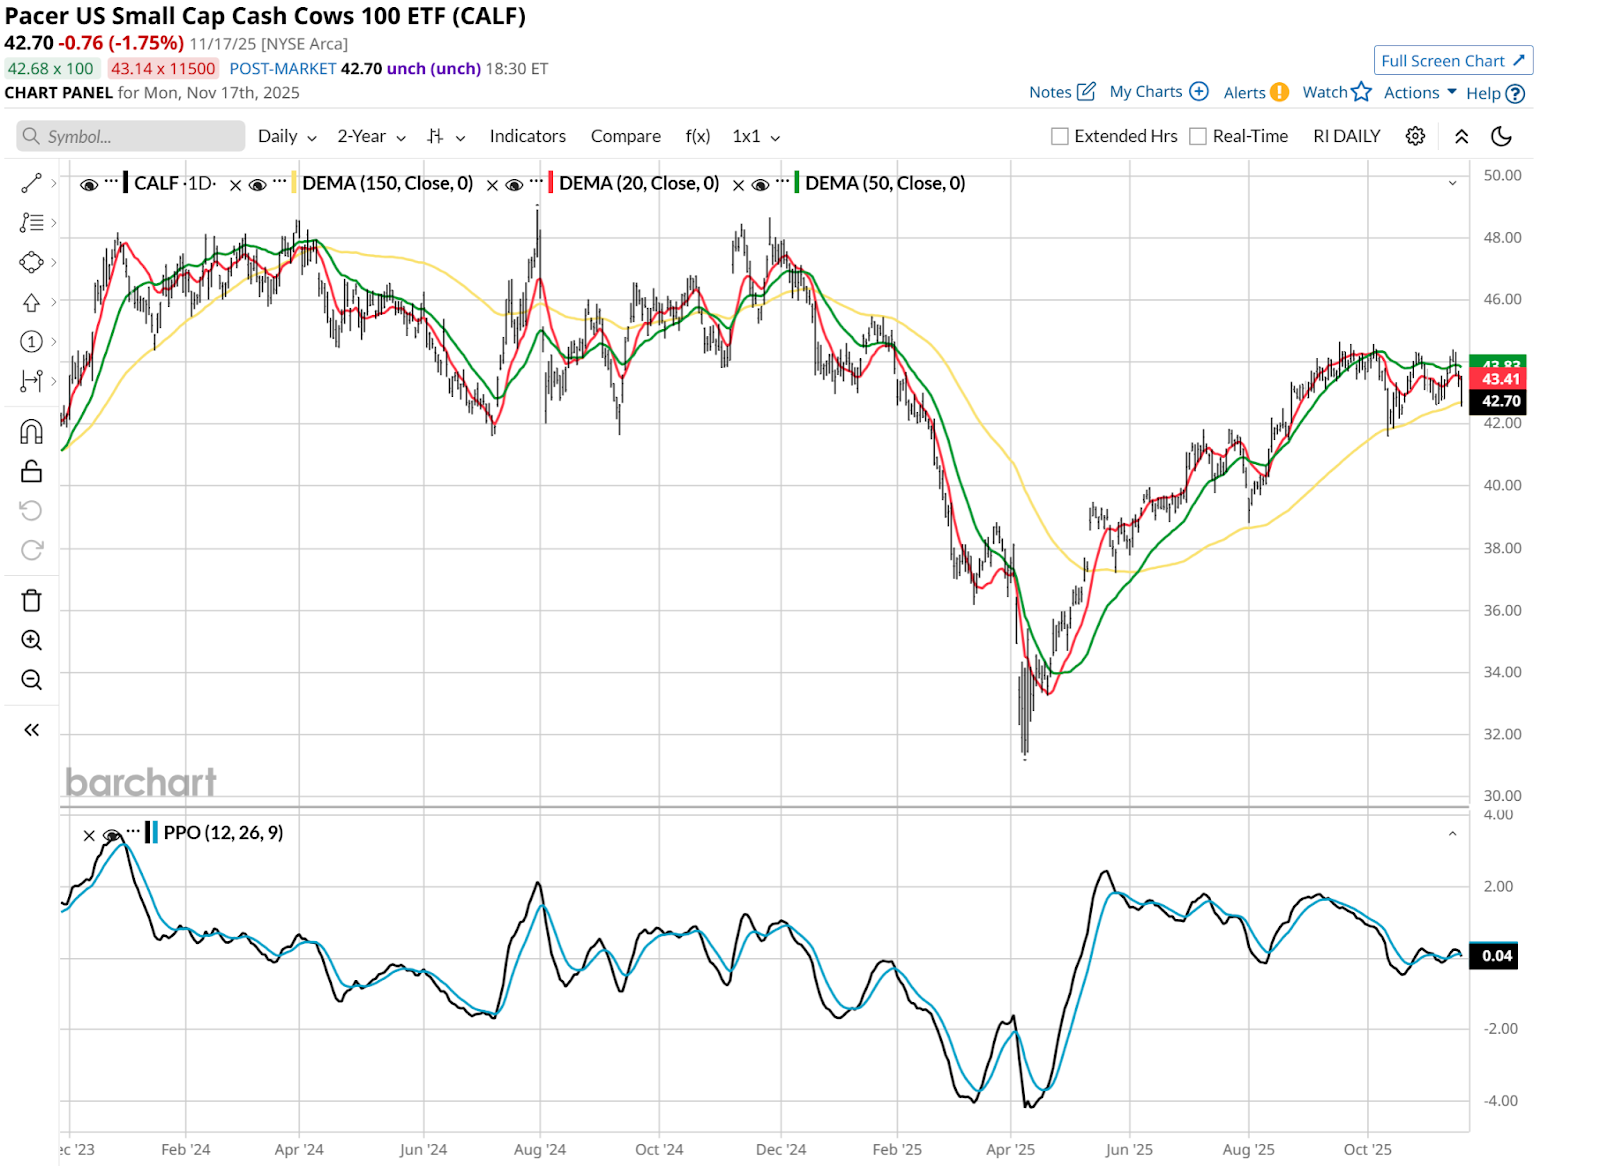
Finally, one in this space with an even higher quality screen is the smallest small-cap ETF of the three, the Pacer US Small Cap Cash Cows 100 ETF (CALF).
This might make for a decent small-cap arbitrage trade, since CALF looks likely to outperform IWM. Specifically, owning CALF and RWM (the IWM inverse ETF) would exploit that difference, assuming it played out as I suspect it will. However, most traders are less concerned at times like this with pairing similar ETFs than they are finding ways to earn outright profit.
And on that count, unless it is the inverse side of the small-cap realm, I come up empty.
That’s why, as I’ve emphasized in many articles here recently, the best thing investors and traders can do is get out of their binary world of “own stocks” or “go to cash.” Because this is a time when inverse ETFs, those which go up when stocks go down, can be a very valuable complement to portfolio strategy.
Rob Isbitts, founder of Sungarden Investment Publishing, is a semi-retired chief investment officer, whose current research is found here at Barchart, as well as at his ETF Yourself subscription service on Substack.
On the date of publication, Rob Isbitts did not have (either directly or indirectly) positions in any of the securities mentioned in this article. All information and data in this article is solely for informational purposes. For more information please view the Barchart Disclosure Policy here.
More news from Barchart
- Small-Cap Stocks Are Sounding a Very Scary Alarm. Here’s How to Protect Yourself… and Even Profit.
- Think AI Stocks Are Overvalued? Invest in These Data Center Power Trades for the Next Growth Phase.
- Where Will the Bleeding End for Bitcoin Bulls? Our Top Chart Strategist Maps Out BTC’s Next Move.
- Stop Panicking and Look at the Charts: What Barchart’s Technical Indicators Are Telling Us Now


