

Prestigious investment banking firm The Goldman Sachs Group (NYSE: GS) stock is at a critical juncture between breaking down under the weekly rising price channel or triggering a seed wave breakout. The Company has a history of blowing out earnings expectations.
The bear market of 2022 was the hangover for investment banking after the SPAC and reopening craze of 2021. Like competitors JPMorgan Chase & Co. (NYSE: JPM) and Morgan Stanley (NYSE: MS), Goldman had expanded services to consumers through its Marcus digital banking platform. However, they are planning to cease personal loans and focus more on its core business and not so much on retail consumers.
Goldman doesn’t collect much from net interest gains like The Charles Schwab Corporation (NYSE: SCHW) which collects nearly half its revenues from interest on customer accounts. While investment banking took the largest YoY drop, it’s Consumer & Wealth Management saw an 18% bounce.
The extreme volatility in the fixed income, commodities, and currencies (FICC) helped offset the big declines with its investment banking business. Their client base is not the Robin Hood Markets, Inc. (NASDAQ: HOOD) crowd as minimum assets required to have an account start in the six figures.
Normalization Continues
The Company is seeing continued normalization of several of its businesses while other areas offset the effect due to extreme volatility. On October 18, 2022, Goldman Sachs released its fiscal third-quarter 2023 results for September 2022. The Company reported non-GAAP earnings-per-share (EPS) of $8.25, excluding non-recurring items, versus consensus analyst estimates for a profit of $7.51, a $0.74 per share beat.
Revenues fell (-12%) year-over-year (YoY) to $11.98 billion, beating consensus analyst estimates for $11.53 billion. The provision of Q3 2022 credit losses was $515 million. The YoY comps were significantly less due to the abnormally strong Q3 2021 as normalization kicked in. Equity and debt underwriting net revenues saw a significant volume decline in line with the rest of the industry.
Corporate lending net revenues reflected net markdowns on acquisition financing activities and net losses on hedges. Fixed income, commodities, and currencies (FICC) had significantly higher net revenues in financing and intermediation. Equities had lower net revenues. U.S. IPO activity was down (-83%) YoY in Q3 2022.
Goldman experienced a (-57%) decline in its Investment Banking business, followed by (-20%) in Asset Management. However, they experienced an 11% YoY rise in Global Markets business and 18% in Consumer & Wealth Management.
January 2023 Layoffs
The many headwinds in the market, including a potential recession, Fed’s tightening monetary policy, and general economic slowdown, led to Goldman announcing it would be undergoing a headcount reduction starting in January 2023.
The Marketbeat MarketRank™ Forecast gives Goldman Sachs a grade of 3 out of 5 stars with 12.45% projected earnings growth and a 16.7% upside price target. It does note there was $117.41 million of insider selling in the last quarter.
Weekly Seed Wave
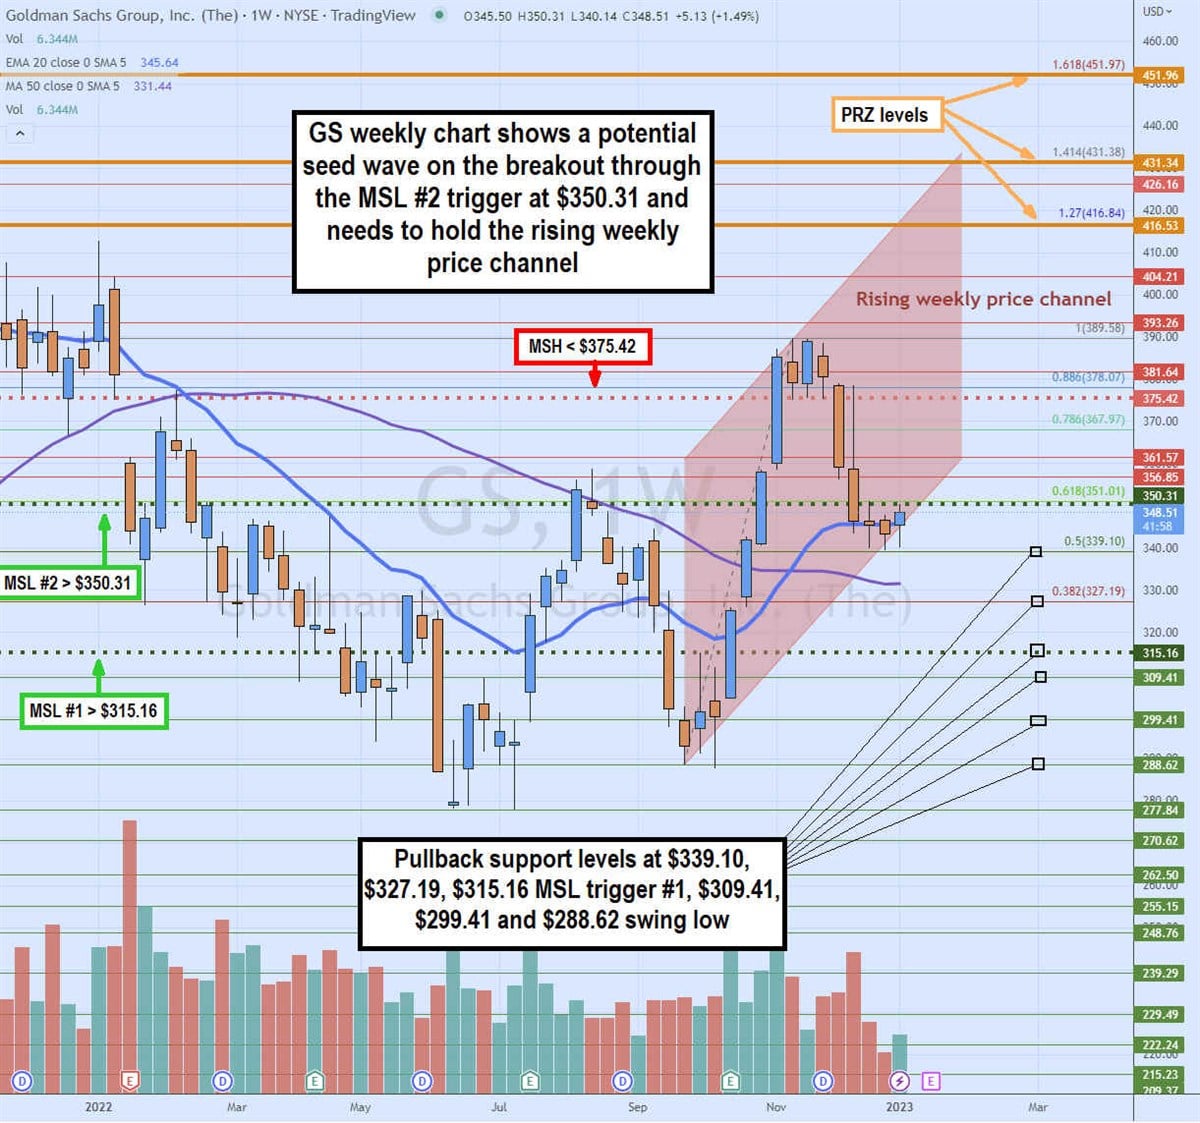
GS stock bottomed in July 2022 near $277.84 before bouncing up to $358.62 in August 2022 and coming back down to form a higher swing low bottom around $288.62 in September. Shares put in a weekly market structure low (MSL) trigger on the breakout above $315.16, which was triggered in October.
Share rocketed highs to peak at $389.58 before forming a market structure high (MSH) sell trigger on the breakdown below $375.62. Shares bottomed at $339.80 and formed a higher MSL trigger on a breakout of $350.31. A market structure low forms after a series of 4 or more consecutive lows followed by a higher lower. The trigger is the high of the higher-low candle.
When two consecutive MSLs form sequentially higher, that sets up a seed wave formation with three upside targets also known as potential reversal zones (PRZ).
These PRZs are projections using the Fibonacci extensions of 1.27, 1.414, and 1.618 measured from the low of the first market structure candle and the high of the market structure high candle. This sets up targets at $416.53 (1.27), $431.34 (1.414), and $451.97 (1.618).
The weekly 20-period exponential moving average (EMA) is starting to rise at $345.60, followed by the 50-period MA at $321.43. The weekly rising channel has formed due to the high highs and higher lows. GS will trigger MSL #2 on a breakout above $350.31 or fall out of the rising channel under $345. Pullback support levels sit at $33.10, $327.19, $315.15 weekly MSL trigger #1, 309.41, $299.41, and the $288.62 swing low.


