Transportation company Schneider (NYSE: SNDR) reported Q3 2026 results beating Wall Street’s revenue expectations, with revenue up 9.2% year on year to $1.59 billion. Its non-GAAP profit of $0.29 per share was in line with analysts’ consensus estimates.
For more on Schneider, read our free full research report.
Schneider (SNDR) Q3 2026 highlights:
- Revenue $1.59 billion vs S&P analysts’ consensus estimates of $1.57 billion (9.2% year-on-year growth, 0.8% beat)
- Adjusted EPS $0.29 vs S&P analysts’ consensus estimates of $0.30 (in line)
- Adjusted EBITDA $168.8 million vs analysts’ consensus estimates of $184.6 million (10.6% margin, 8.6% miss)
- Adjusted EPS guidance Management raised its full-year adjusted EPS guidance to $1.05 at the midpoint, a 5% increase
- Operating margin 3.9%, up from 2.4% in the same quarter last year
- Free cash flow margin 3.7%, down from 5.2% in the same quarter last year
- Market capitalization $5.21 billion
“Our third-quarter performance demonstrates how our strategy has positioned the enterprise to convert improving market conditions into stronger earnings and margins,” said Jim Filter, President and Chief Executive Officer of Schneider. “Disciplined revenue management, productivity gains, and cost reductions are improving our operating leverage, while our diversified multimodal platform gives us the agility to respond as customer needs and freight flows evolve.”
Revenue growth
A company’s long-term performance is an indicator of its overall quality. Any business can have short-term success, but a top-tier one grows for years. Over the last five years, Schneider grew its revenue at a sluggish 2.4% compounded annual growth rate, falling short of our benchmarks.
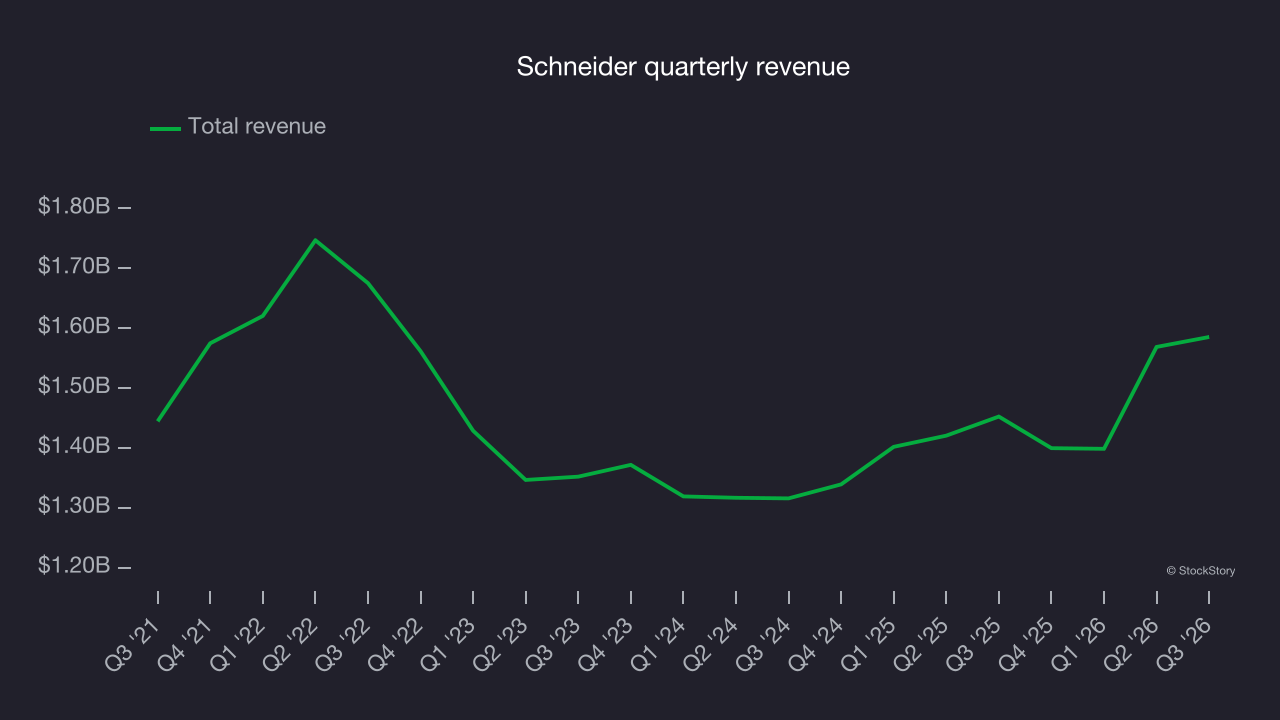
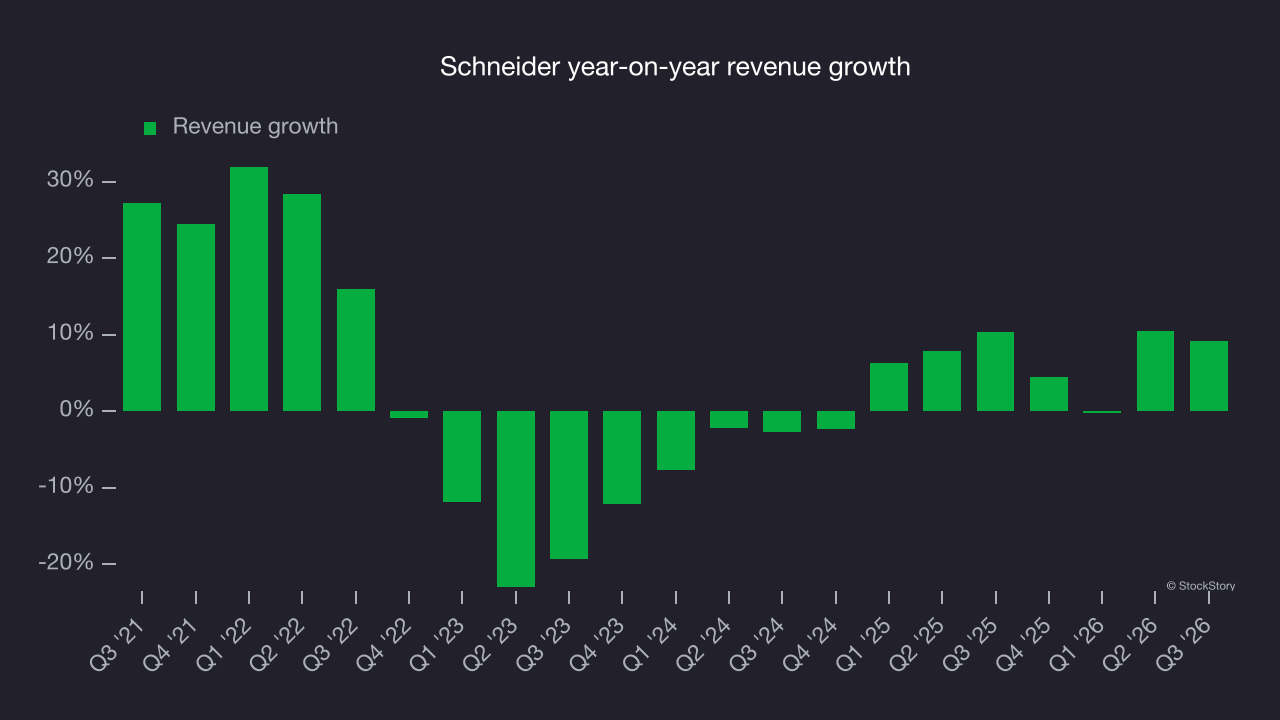
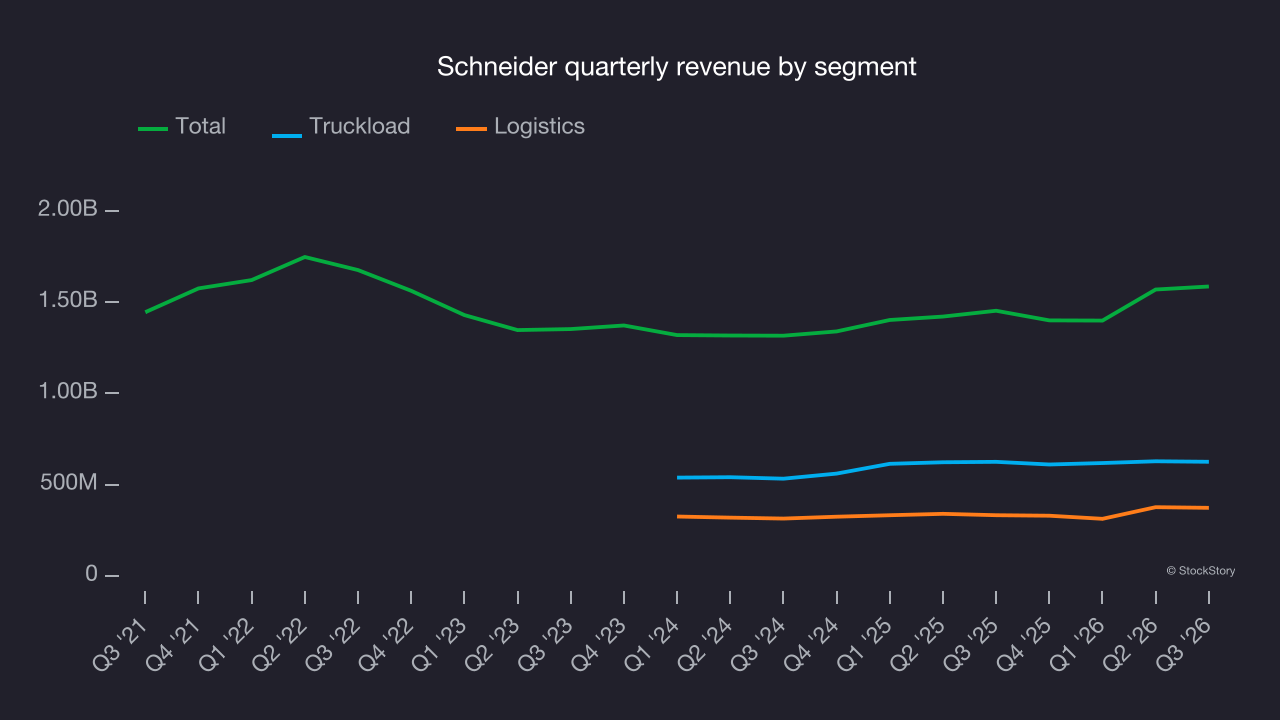
This quarter, Schneider reported year-on-year revenue growth of 9.2%, and its $1.59 billion of revenue exceeded Wall Street’s consensus estimates by 0.8%.
Looking ahead, sell-side analysts expect revenue to grow 7.8% over the next 12 months, according to S&P, an improvement versus the last two years. This projection is above the sector average and implies its newer products and services will spur better top-line performance.
Operating margin
Schneider was profitable over the last five years but held back by its large cost base. Its average operating margin of 5.4% was weak for an industrials business. That outcome is unsurprising given its low gross margin baseline.
Schneider’s operating margin decreased by 6.2 percentage points over the last five years. This raises questions about the company’s expense base because its revenue growth should have given it leverage on its fixed costs, resulting in better economies of scale and profitability. Schneider’s poor performance shows that costs were rising and it couldn’t pass them on to its customers.
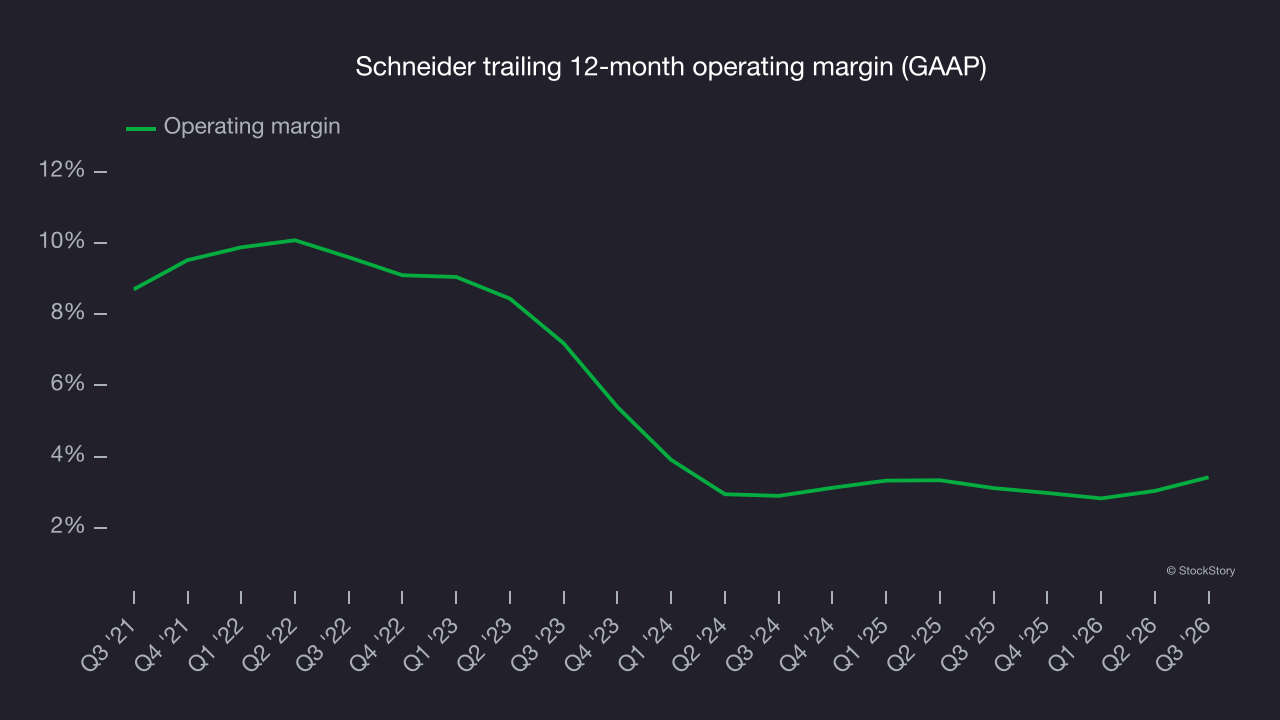
In Q3, Schneider generated an operating margin of 3.9%, up 1.5 percentage points year on year. Its gross margin expanded more than its operating margin, indicating that leverage on its cost of sales was the primary driver of the recent improvement in efficiency.
Earnings per share
We track the long-term change in earnings per share (EPS) for the same reason as long-term revenue growth. Compared to revenue, however, EPS highlights whether a company’s growth is profitable.
Schneider’s EPS declined by 15.7% annually over the last five years while its revenue grew by 2.4%. This tells us the company became less profitable on a per-share basis as it expanded.
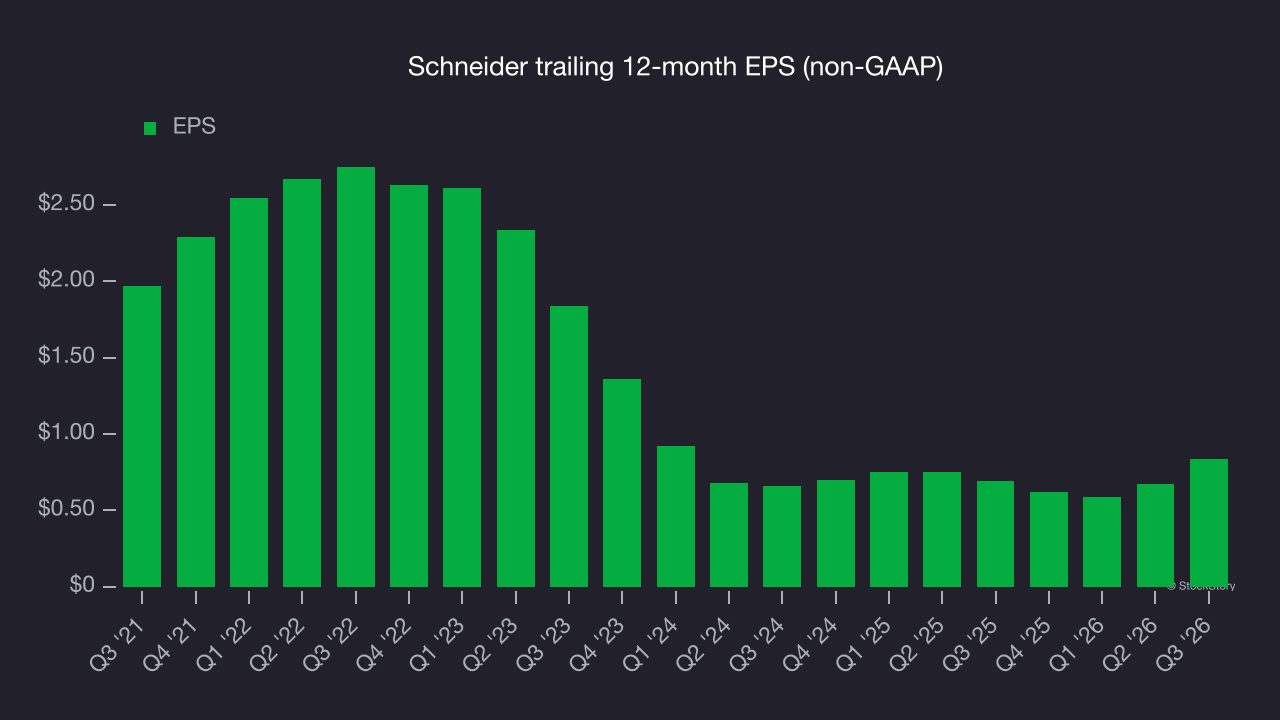
We can take a deeper look into Schneider’s earnings to better understand the drivers of its performance. As we mentioned earlier, Schneider’s operating margin expanded this quarter but declined by 6.2 percentage points over the last five years. This was the most relevant factor (aside from the revenue impact) behind its lower earnings; interest expenses and taxes can also affect EPS but don’t tell us as much about a company’s fundamentals.
As with revenue, we analyze EPS over a shorter period to see if we are missing a change in the business.
For Schneider, its two-year annual EPS growth of 12.8% was higher than its five-year trend. This acceleration made it one of the faster-growing industrials companies in recent history.
In Q3, Schneider reported adjusted EPS of $0.29, up from $0.12 in the same quarter last year. Despite the year-on-year increase, EPS missed analysts’ consensus estimates. Over the next 12 months, Wall Street expects Schneider’s full-year EPS to grow 81.4% from $0.84 to $1.52, according to S&P.
Key takeaways from Schneider’s Q3 results
It was good to see Schneider narrowly top analysts’ revenue expectations this quarter. On the other hand, its EBITDA missed and its EPS was in line with Wall Street’s estimates. Overall, this was a mixed quarter. The stock remained flat at $29.49 immediately after reporting.
Is Schneider an attractive investment at its current price? What happened in the latest quarter matters, but not as much as longer-term business quality and valuation when deciding whether to invest in this stock. Read the full research report here (it’s free).