Payment technology company Crane NXT (NYSE: CXT) reported Q3 2026 results topping the market’s revenue expectations, with revenue up 11.7% year on year to $497.1 million. Its non-GAAP profit of $1.28 per share was 6.1% above analysts’ consensus estimates.
For more on Crane NXT, read the full research report, available free.
Crane NXT (CXT) Q3 2026 highlights:
- Revenue $497.1 million vs S&P analysts’ consensus estimates of $494.1 million (11.7% year-on-year growth, 0.6% beat)
- Adjusted EPS $1.28 vs S&P analysts’ consensus estimates of $1.21 (6.1% beat)
- Adjusted EBITDA $127.2 million vs analysts’ consensus estimates of $125.4 million (25.6% margin, 1.5% beat)
- Adjusted EPS guidance Management raised its full-year adjusted EPS guidance to $4.37 at the midpoint, a 1.2% increase
- Operating margin 13.2%, down from 18.4% in the same quarter last year
- Free cash flow margin 18.1%, down from 19.2% in the same quarter last year
- Backlog $715.5 million at quarter end, up 28.5% year on year
- Market capitalization $3.46 billion
Revenue growth
A company’s long-term revenue performance is one signal of its overall quality. Even a poor business can perform well for one or two quarters, but a high-quality one grows for years.
With $1.85 billion in revenue over the past 12 months, Crane NXT is a mid-sized business services company, which sometimes brings disadvantages compared to larger competitors benefiting from better economies of scale. On the positive side, it can still achieve high growth rates because it’s working from a smaller revenue base.
Crane NXT’s 8.3% annualized revenue growth over the last four years was solid, showing its demand was higher than that of many business services companies.
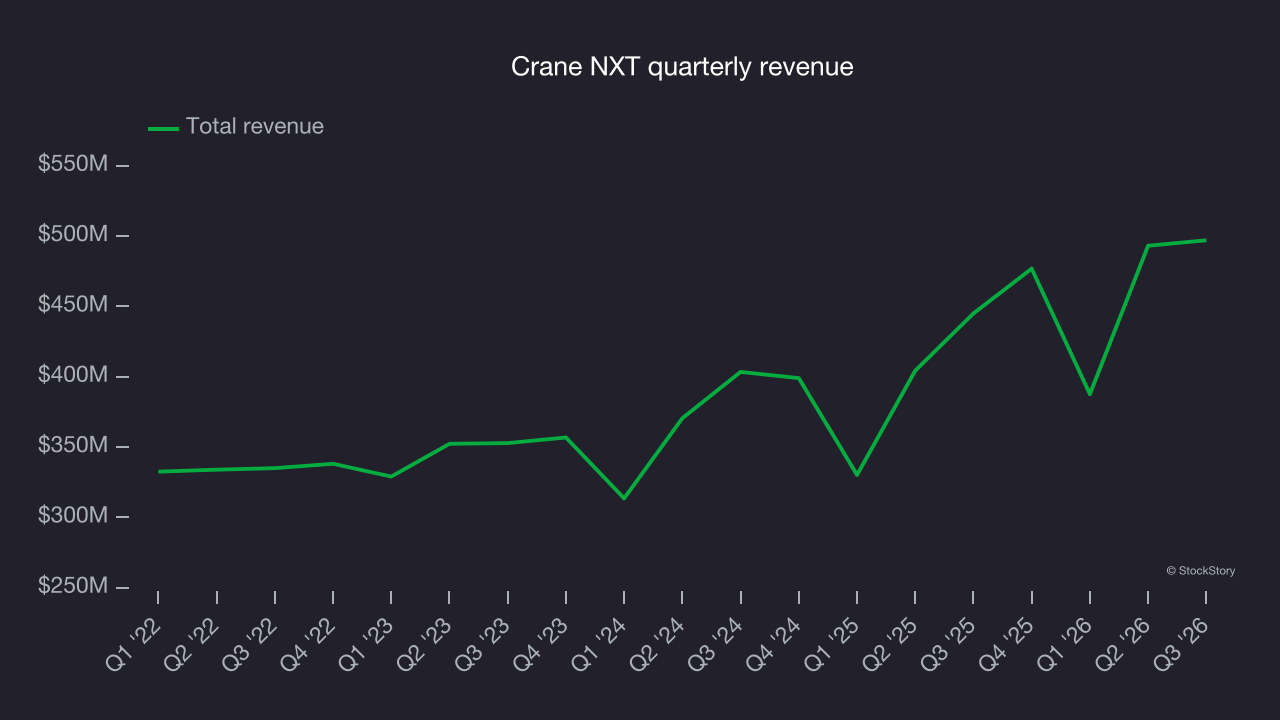
Long-term growth matters most, but within business services, a stretched historical view may miss recent innovations or disruptive industry trends. Crane NXT’s annualized revenue growth of 13.3% over the last two years is above its four-year trend, suggesting its demand was strong and recently accelerated. 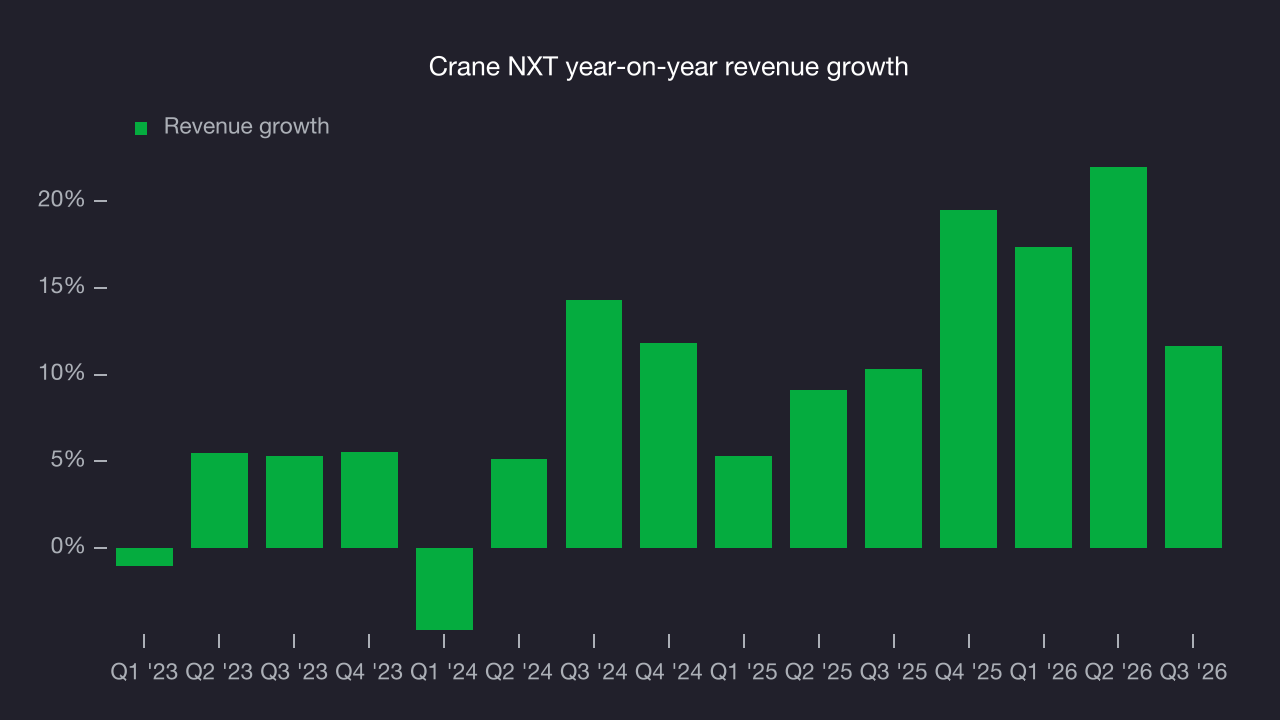
The company’s backlog, or the value of its outstanding orders that have not yet been executed or delivered, helps explain its revenue dynamics. Crane NXT’s backlog reached $715.5 million in the latest quarter and averaged 18.5% year-on-year growth over the last two years. Backlog growth outpaced revenue growth, indicating the company accumulated more orders than it could fulfill and deferred revenue to the future. This could imply elevated demand for Crane NXT’s products and services but raises concerns about capacity constraints. 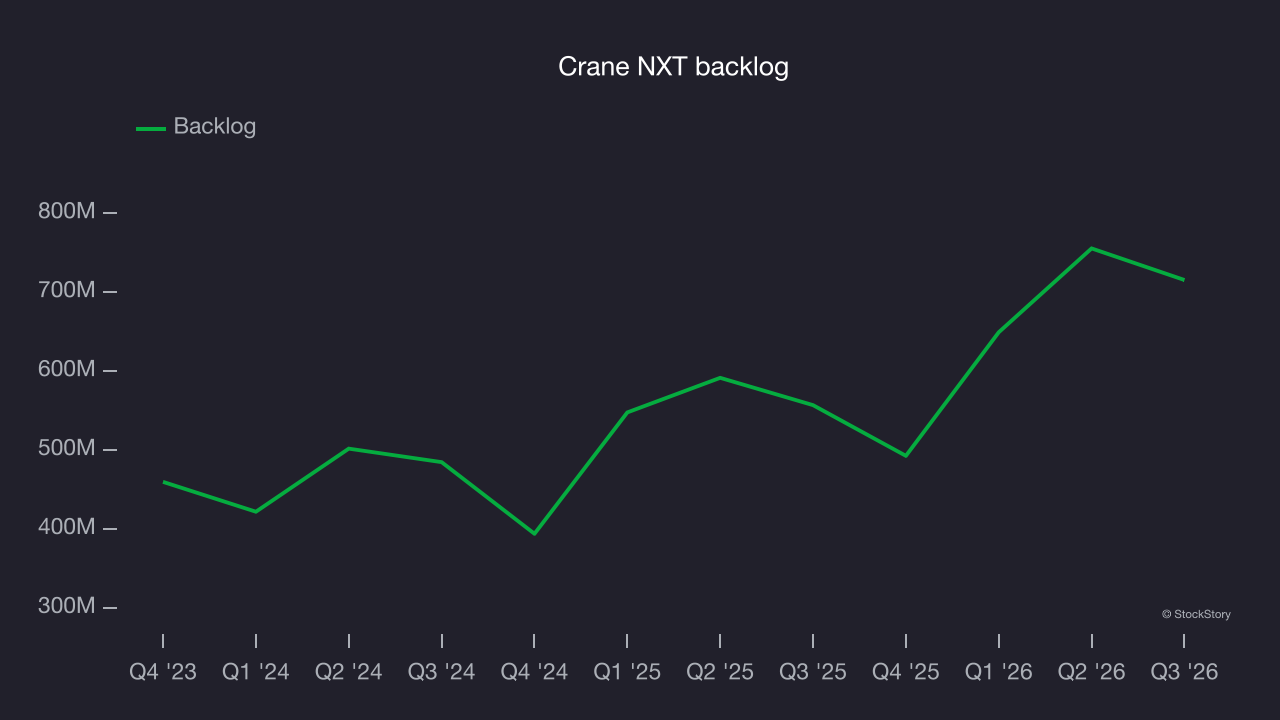
This quarter, Crane NXT reported year-on-year revenue growth of 11.7%, and its $497.1 million of revenue exceeded Wall Street’s consensus estimates by 0.6%.
Looking ahead, sell-side analysts expect revenue to grow 8.2% over the next 12 months, according to S&P, a deceleration versus the last two years. Despite the slowdown, the projected growth is solid and indicates the market sees success for its products and services.
Adjusted operating margin
Adjusted operating margin is one of the best measures of profitability because it shows how much a company earns after subtracting all core expenses, such as marketing and research and development. It also removes various one-time costs to provide a clearer picture of normalized profits.
Crane NXT has performed well over the last five years. It demonstrated strong profitability for a business services company, with an average adjusted operating margin of 22.5%.
Looking at the trend in its profitability, Crane NXT’s adjusted operating margin decreased by 8.4 percentage points over the last five years. This raises questions about the company’s expense base because its revenue growth should have given it leverage on its fixed costs, resulting in better economies of scale and profitability.
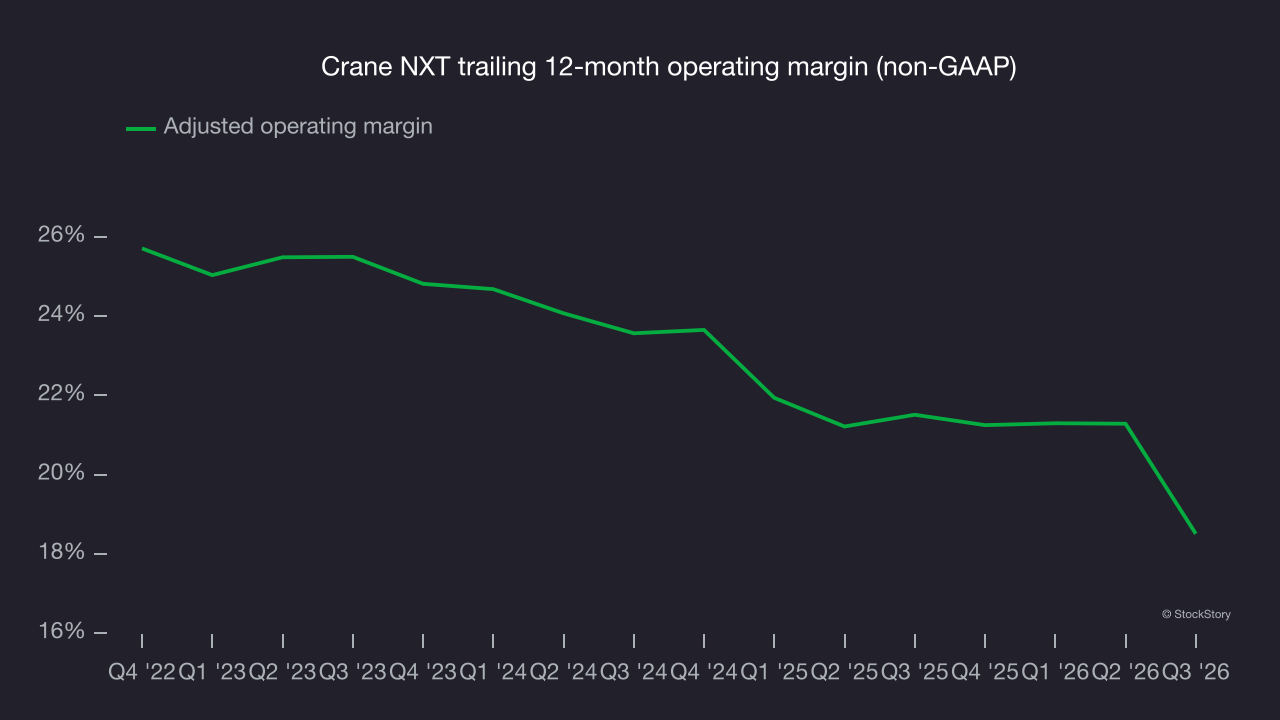
This quarter, Crane NXT generated an adjusted operating margin of 14%, down 10.7 percentage points year on year. This contraction shows it was less efficient because its expenses grew faster than its revenue.
Cash flow
Earnings are valuable for assessing company performance, but cash is essential because accounting profits alone cannot pay the bills.
Crane NXT has shown strong cash profitability, enabling it to reinvest, return capital to investors and stay ahead of the competition while maintaining an ample cushion. The company’s free cash flow margin was among the best in the business services sector, averaging 15.3% over the last five years.
Crane NXT’s margin dropped by 10.9 percentage points during that time. If its declines continue, it could signal increasing investment needs and capital intensity.
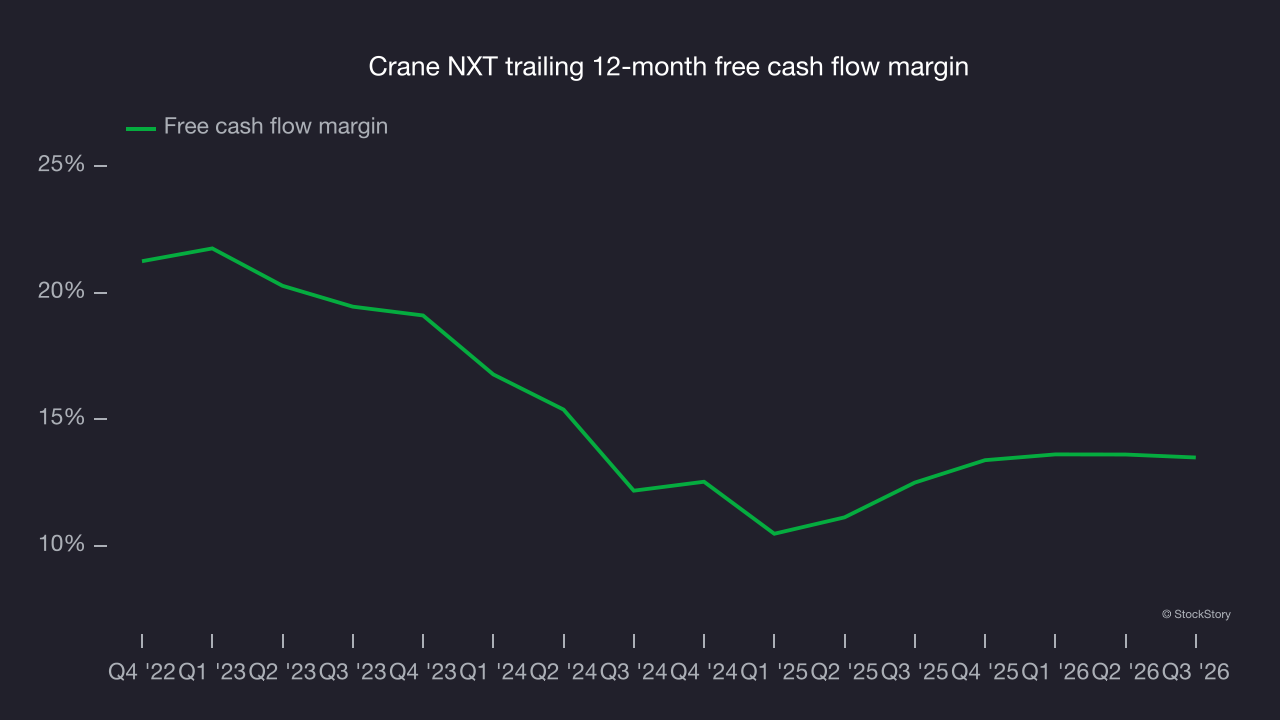
Crane NXT’s free cash flow totaled $90.2 million in Q3, equivalent to an 18.1% margin. The company’s cash profitability declined as its margin was 1 percentage point lower than in the same quarter last year, but it’s still above its five-year average. This quarter’s decline should not be overinterpreted because investment needs can be seasonal, causing short-term swings. Long-term trends carry greater meaning.
Key takeaways from Crane NXT’s Q3 results
Crane NXT’s quarter had some key positives: EPS beat analysts’ consensus estimates, and full-year EPS guidance came in narrowly ahead of Wall Street’s consensus. Shares rose 4.5% to $64.42 immediately after the results.
Crane NXT reported solid earnings, but one quarter doesn’t necessarily make the stock a buy. The latest quarter matters, but not nearly as much as longer-term fundamentals and valuation when deciding whether to buy the stock. For more on Crane NXT, read our full research report here (it’s free).