
Steel wire manufacturer Insteel (NYSE: IIIN) fell short of the market’s revenue expectations in Q1 CY2026, but sales rose 7.5% year on year to $172.7 million. Its GAAP profit of $0.27 per share was 57.8% below analysts’ consensus estimates.
Is now the time to buy Insteel? Find out by accessing our full research report, it’s free.
Insteel (IIIN) Q1 CY2026 Highlights:
- Revenue: $172.7 million vs analyst estimates of $178.2 million (7.5% year-on-year growth, 3.1% miss)
- EPS (GAAP): $0.27 vs analyst expectations of $0.64 (57.8% miss)
- Adjusted EBITDA: $12.51 million vs analyst estimates of $21 million (7.2% margin, 40.4% miss)
- Operating Margin: 3.9%, down from 8.5% in the same quarter last year
- Free Cash Flow was $437,000, up from -$5.54 million in the same quarter last year
- Market Capitalization: $709.9 million
Company Overview
Growing from a small wire manufacturer to one of the largest in the U.S., Insteel (NYSE: IIIN) provides steel wire reinforcing products for concrete.
Revenue Growth
Examining a company’s long-term performance can provide clues about its quality. Any business can put up a good quarter or two, but many enduring ones grow for years. Regrettably, Insteel’s sales grew at a tepid 5.9% compounded annual growth rate over the last five years. This fell short of our benchmark for the industrials sector and is a rough starting point for our analysis.
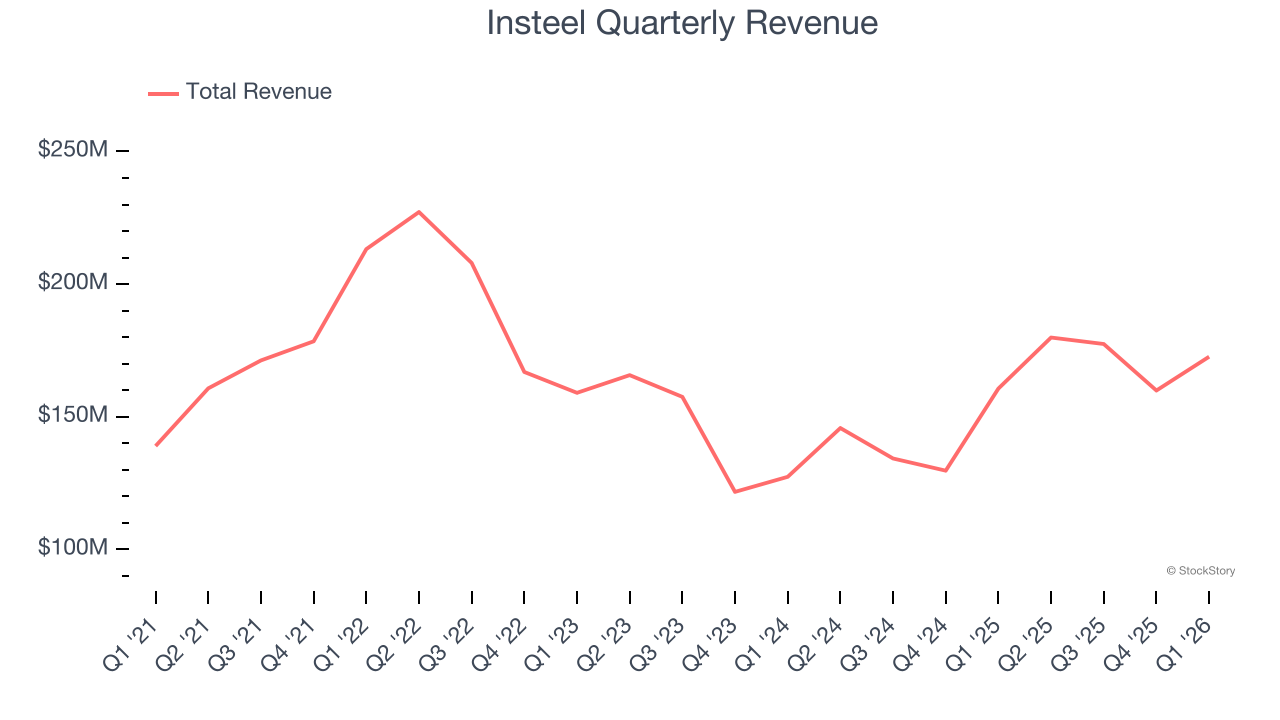
Long-term growth is the most important, but within industrials, a half-decade historical view may miss new industry trends or demand cycles. Insteel’s annualized revenue growth of 9.8% over the last two years is above its five-year trend, suggesting its demand recently accelerated. 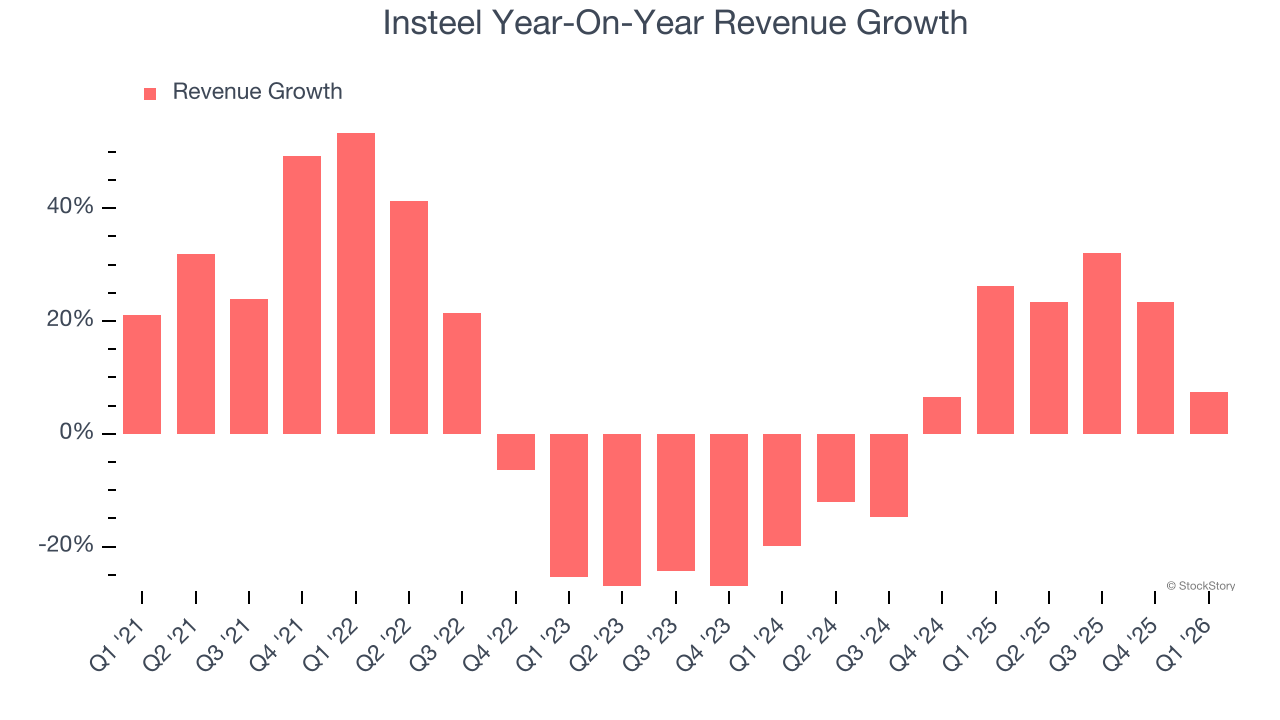
This quarter, Insteel’s revenue grew by 7.5% year on year to $172.7 million, missing Wall Street’s estimates.
Looking ahead, sell-side analysts expect revenue to grow 9.5% over the next 12 months, similar to its two-year rate. This projection is healthy and implies the market sees success for its products and services.
WHILE YOU’RE HERE: The Next Palantir? One satellite company captures images of every point on Earth. Every single day. The Pentagon wants it. Hedge funds are using it to beat earnings. You’ve probably never heard of it.
This is what the early days of Palantir looked like before it became a $437 billion giant. Same playbook. Different technology. If you missed Palantir, you need to see this. Claim The Stock Ticker for Free HERE.
Operating Margin
Insteel has managed its cost base well over the last five years. It demonstrated solid profitability for an industrials business, producing an average operating margin of 10.4%. This result was particularly impressive because of its low gross margin, which is mostly a factor of what it sells and takes huge shifts to move meaningfully. Companies have more control over their operating margins, and it’s a show of well-managed operations if they’re high when gross margins are low.
Analyzing the trend in its profitability, Insteel’s operating margin decreased by 11.1 percentage points over the last five years. This raises questions about the company’s expense base because its revenue growth should have given it leverage on its fixed costs, resulting in better economies of scale and profitability.
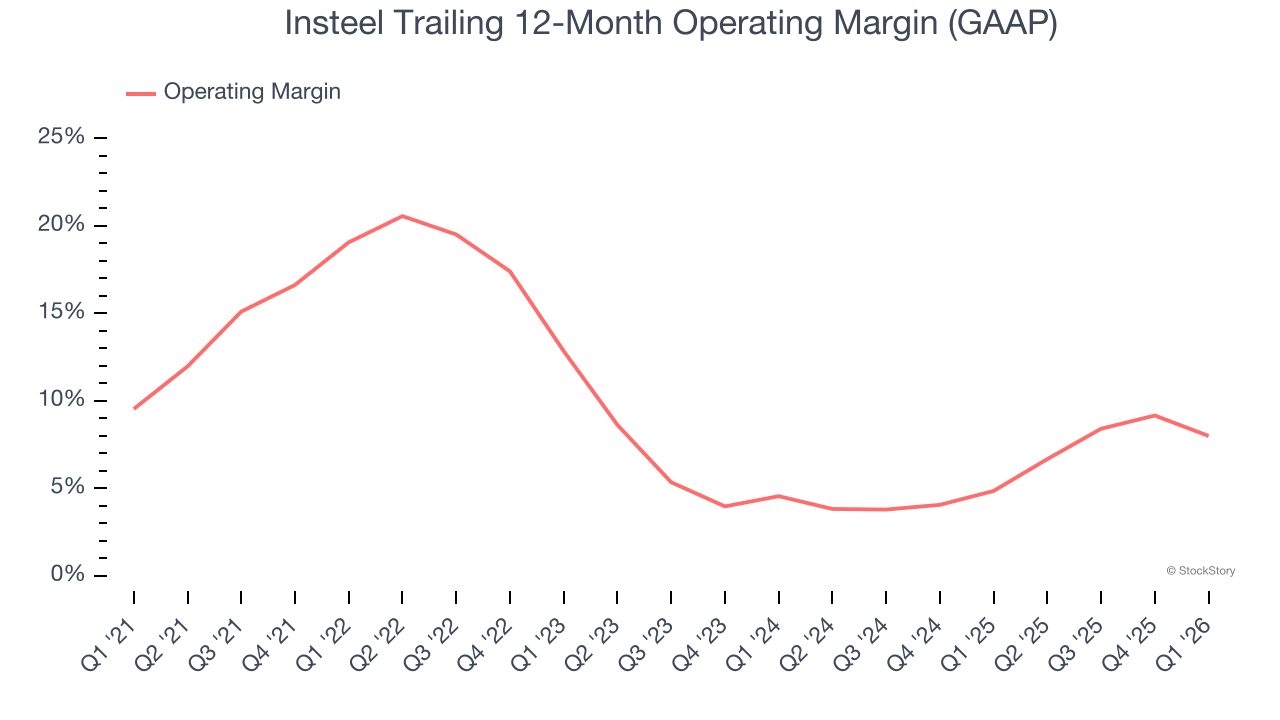
This quarter, Insteel generated an operating margin profit margin of 3.9%, down 4.6 percentage points year on year. Since Insteel’s gross margin decreased more than its operating margin, we can assume its recent inefficiencies were driven more by weaker leverage on its cost of sales rather than increased marketing, R&D, and administrative overhead expenses.
Earnings Per Share
Revenue trends explain a company’s historical growth, but the long-term change in earnings per share (EPS) points to the profitability of that growth – for example, a company could inflate its sales through excessive spending on advertising and promotions.
Insteel’s EPS grew at a weak 2.8% compounded annual growth rate over the last five years, lower than its 5.9% annualized revenue growth. This tells us the company became less profitable on a per-share basis as it expanded.
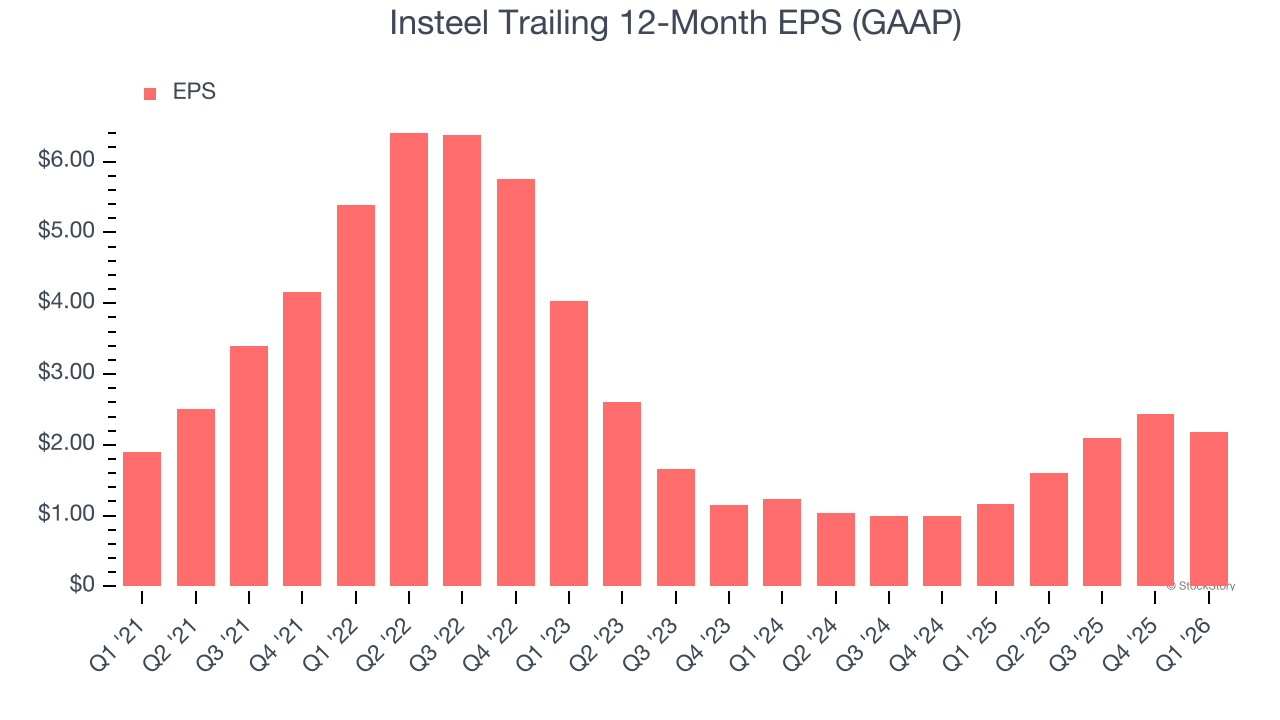
We can take a deeper look into Insteel’s earnings to better understand the drivers of its performance. As we mentioned earlier, Insteel’s operating margin declined by 11.1 percentage points over the last five years. This was the most relevant factor (aside from the revenue impact) behind its lower earnings; interest expenses and taxes can also affect EPS but don’t tell us as much about a company’s fundamentals.
Like with revenue, we analyze EPS over a more recent period because it can provide insight into an emerging theme or development for the business.
For Insteel, its two-year annual EPS growth of 32.6% was higher than its five-year trend. This acceleration made it one of the faster-growing industrials companies in recent history.
In Q1, Insteel reported EPS of $0.27, down from $0.52 in the same quarter last year. This print missed analysts’ estimates. Over the next 12 months, Wall Street expects Insteel’s full-year EPS of $2.18 to grow 33.5%.
Key Takeaways from Insteel’s Q1 Results
We struggled to find many positives in these results. Its revenue missed and its adjusted operating income fell short of Wall Street’s estimates. Overall, this was a softer quarter. The stock remained flat at $36.70 immediately after reporting.
Should you buy the stock or not? If you’re making that decision, you should consider the bigger picture of valuation, business qualities, as well as the latest earnings. We cover that in our actionable full research report which you can read here (it’s free).


