Shareholders of Fortune Brands would probably like to forget the past six months even happened. The stock dropped 26.4% and now trades at $38.10. This was partly due to its softer quarterly results and might have investors contemplating their next move.
Is now the time to buy Fortune Brands, or should you be careful about including it in your portfolio? Check out our in-depth research report to see what our analysts have to say, it’s free.
Why Do We Think Fortune Brands Will Underperform?
Even though the stock has become cheaper, we're cautious about Fortune Brands. Here are three reasons we avoid FBIN and a stock we'd rather own.
1. Core Business Falling Behind as Demand Plateaus
In addition to reported revenue, organic revenue is a useful data point for analyzing Home Construction Materials companies. This metric gives visibility into Fortune Brands’s core business because it excludes one-time events such as mergers, acquisitions, and divestitures along with foreign currency fluctuations - non-fundamental factors that can manipulate the income statement.
Over the last two years, Fortune Brands failed to grow its organic revenue. This performance was underwhelming and implies it may need to improve its products, pricing, or go-to-market strategy. It also suggests Fortune Brands might have to lean into acquisitions to accelerate growth, which isn’t ideal because M&A can be expensive and risky (integrations often disrupt focus). 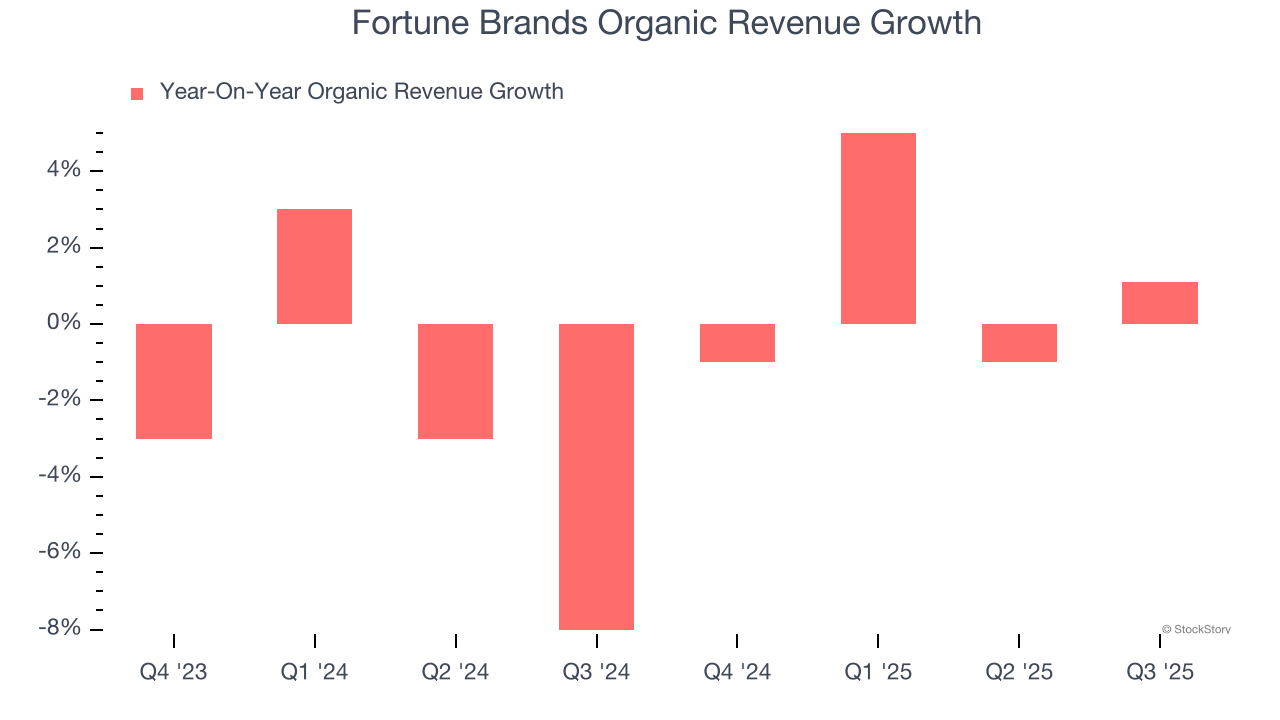
2. Shrinking Operating Margin
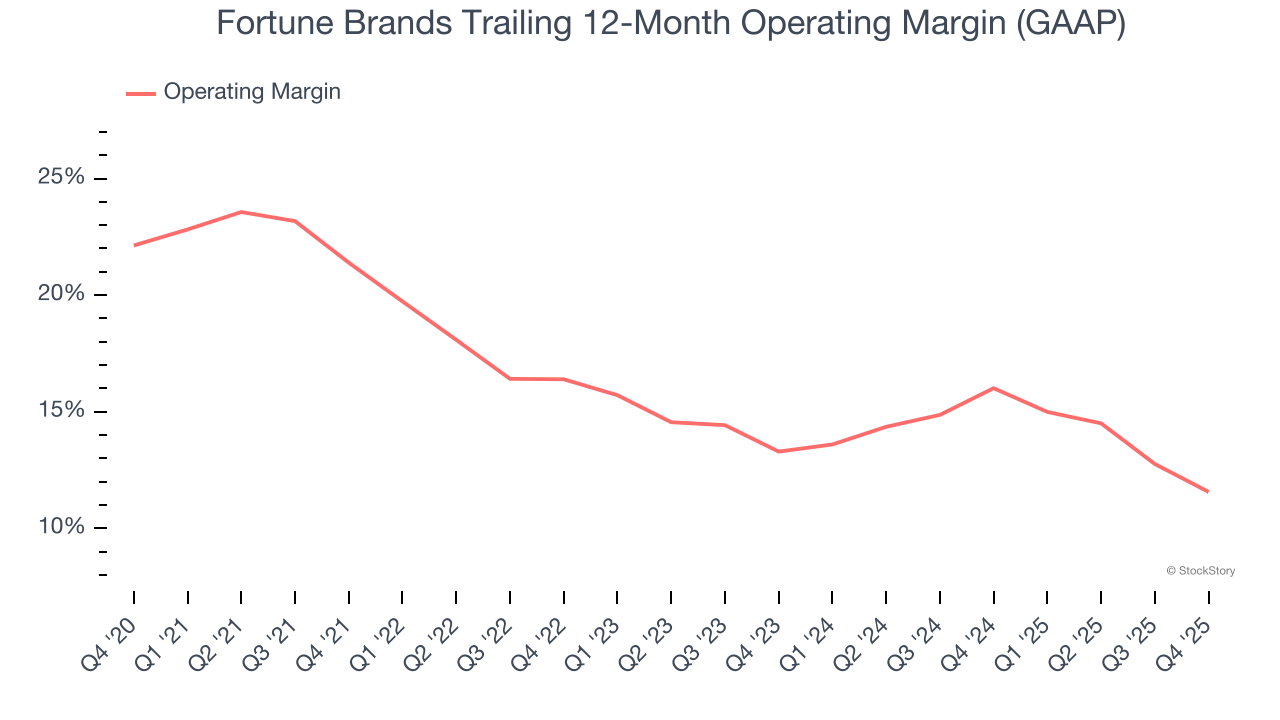
Operating margin is a key measure of profitability. Think of it as net income - the bottom line - excluding the impact of taxes and interest on debt, which are less connected to business fundamentals.
Looking at the trend in its profitability, Fortune Brands’s operating margin decreased by 9.8 percentage points over the last five years. This raises questions about the company’s expense base because its revenue growth should have given it leverage on its fixed costs, resulting in better economies of scale and profitability. Its operating margin for the trailing 12 months was 11.6%.
3. EPS Trending Down
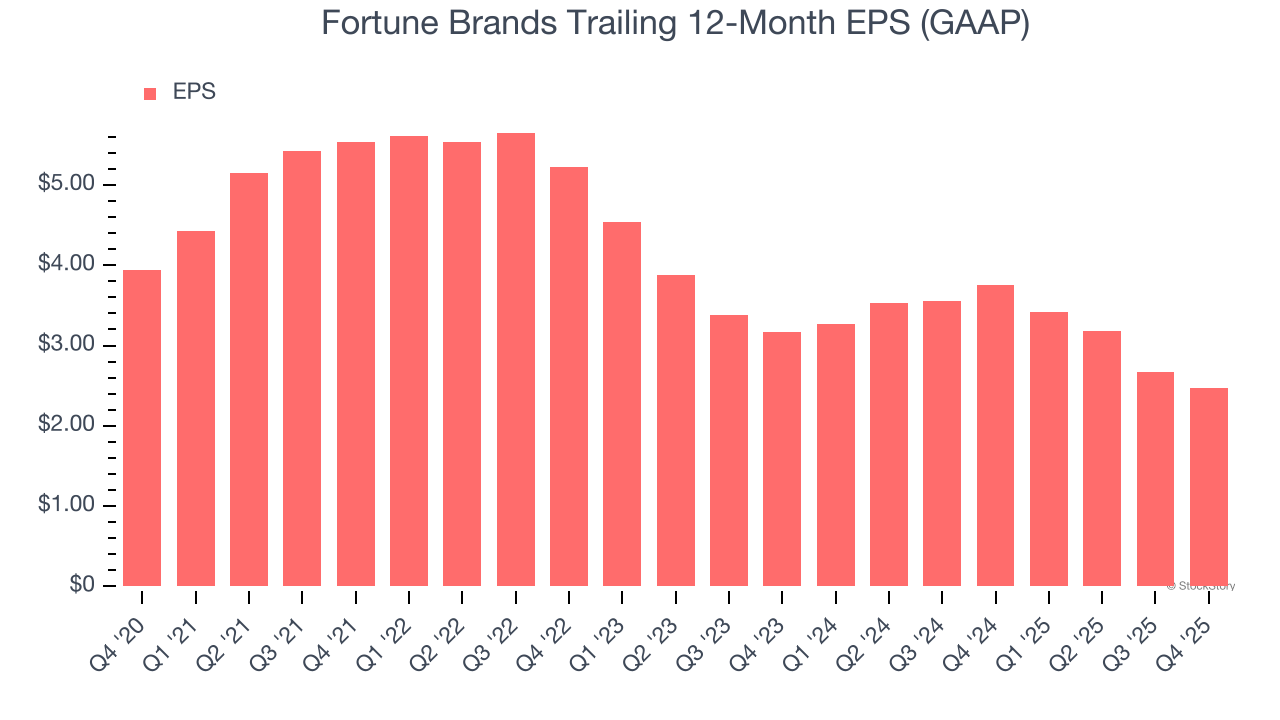
We track the long-term change in earnings per share (EPS) because it highlights whether a company’s growth is profitable.
Sadly for Fortune Brands, its EPS declined by 8.9% annually over the last five years while its revenue grew by 4.3%. This tells us the company became less profitable on a per-share basis as it expanded.
Final Judgment
We see the value of companies helping their customers, but in the case of Fortune Brands, we’re out. Following the recent decline, the stock trades at 10.6× forward P/E (or $38.10 per share). This valuation is reasonable, but the company’s shaky fundamentals present too much downside risk. There are better investments elsewhere. Let us point you toward the most dominant software business in the world.
High-Quality Stocks for All Market Conditions
WHILE YOU’RE HERE: Top 9 Market-Beating Stocks. The best stocks don't just beat the market once. They do it again. And again. Robust revenue growth, rising free cash flow, returns on capital that leave their competition in the dust. The market has already rewarded these businesses.
But our AI platform says the party isn't over. Find out which 9 stocks made the cut this week — FREE. Get Our Top 9 Market-Beating Stocks for Free HERE.
Stocks that have made our list include now familiar names such as Nvidia (+1,326% between June 2020 and June 2025) as well as under-the-radar businesses like the once-micro-cap company Tecnoglass (+1,754% five-year return). Find your next big winner with StockStory today.