Energy infrastructure company Kinder Morgan (NYSE: KMI) announced better-than-expected revenue in Q2 CY2026, with sales up 10.8% year on year to $4.48 billion. Its non-GAAP profit of $0.37 per share was 18.3% above analysts’ consensus estimates.
Is now the time to buy Kinder Morgan? Find out by accessing our full research report, it’s free.
Kinder Morgan (KMI) Q2 CY2026 Highlights:
- Revenue: $4.48 billion vs analyst estimates of $4.23 billion (10.8% year-on-year growth, 5.8% beat)
- Adjusted EPS: $0.37 vs analyst estimates of $0.31 (18.3% beat)
- Operating Margin: 30.1%, up from 28.5% in the same quarter last year
- Free Cash Flow Margin: 21.8%, down from 24.8% in the same quarter last year
- Market Capitalization: $72.04 billion
“Strong financial contributions from our business segments resulted in a record second quarter. The company delivered second quarter 2026 net income attributable to KMI of $867 million, 21% higher than the second quarter of 2025, while Adjusted EPS and Adjusted EBITDA were 32% and 12% higher, respectively, than the second quarter of 2025,” Chief Executive Officer Kim Dang said.
Company Overview
Operating what amounts to the toll roads of the energy industry, Kinder Morgan (NYSE: KMI) transports natural gas, refined petroleum products, and crude oil through its pipeline network across North America.
Revenue Growth
Cyclical sectors like Energy often flatter weaker operators during favorable price environments, but a longer-term lens separates those from businesses that can consistently perform across market cycles. Regrettably, Kinder Morgan’s sales grew at a sluggish 4.5% compounded annual growth rate over the last five years. This wasn’t a great result compared to the rest of the energy upstream and integrated energy sector, but there are still things to like about Kinder Morgan.
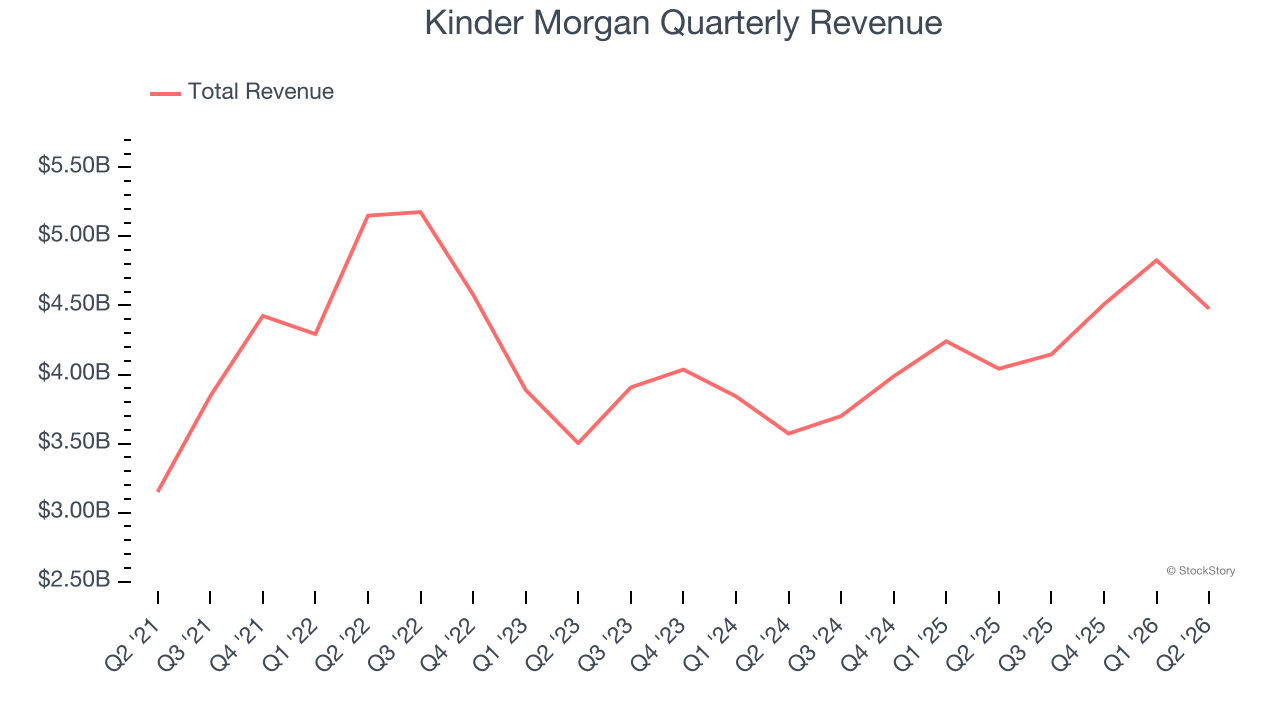
Within Energy, a singular timeframe, even if it’s quite long-term, only sheds light on how well a company rode the last commodity cycle. To better assess whether a company compounds through cycles, we validate our view with an even longer, ten-year view. Kinder Morgan’s annualized revenue growth of 2.8% over the last ten years is below its five-year trend, but we still think the results were good.
This quarter, Kinder Morgan reported year-on-year revenue growth of 10.8%, and its $4.48 billion of revenue exceeded Wall Street’s estimates by 5.8%.
ONE MORE THING: The $21 AI Application Stock Wall Street Forgot. While Wall Street obsesses over who’s building AI, one company is already using it to print money. And nobody’s paying attention.
AI chip stocks trade at ridiculous valuations. This company processes a trillion consumer signals monthly using AI and trades at a third of the price. The gap won’t last. The institutions will figure it out. You need to see this first. Read the FREE Report Before They Notice.
Cash Is King
Adjusted EBITDA shows how profitable a company’s existing wells are before financing and reinvestment decisions, but free cash flow shows how much value remains after paying the cost of replacing those wells. In upstream energy, production naturally declines over time, so companies must continuously reinvest just to stand still. A producer can report strong EBITDA margins yet generate little or no free cash flow if its wells decline quickly or if new drilling is expensive. Free cash flow therefore captures not only how efficiently a company produces hydrocarbons today, but also how costly it is to sustain that production into the future.
Kinder Morgan has shown terrific cash profitability, enabling it to reinvest, return capital to investors, and stay ahead of the competition while maintaining an ample cushion. The company’s free cash flow margin was among the best in the energy upstream and integrated energy sector, averaging 19.9% over the last five years.
While the level of free cash flow margins is important, their consistency matters just as much.
Kinder Morgan’s ratio of quarterly free cash flow volatility to WTI crude price volatility over the past five years was 2.3 (lower is better), indicating excellent insulation from commodity swings. This stability supports superior capital access in downturns and positions Kinder Morgan to act as a consolidator when weaker peers are forced to retrench.
You may be asking why we wait until the free cash flow line to perform this stability analysis versus commodity prices. Why not compare revenue or EBITDA to WTI in the case of Kinder Morgan? Because what ultimately matters is not how much revenue or profit you earn when prices are high but how much cash you can generate when prices are low. Free cash flow is the superior metric because it includes everything from hedging prowess to growth and maintenance capex to management behavior during good times and bad.
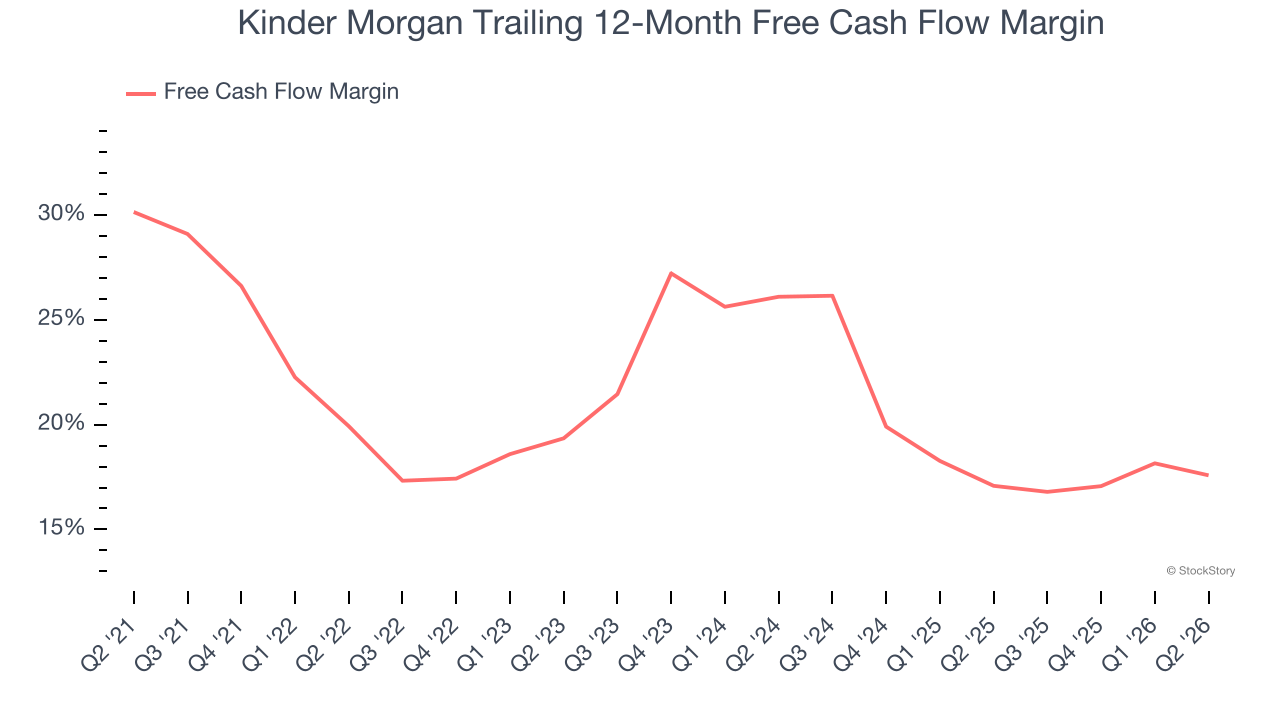
Kinder Morgan’s free cash flow clocked in at $978 million in Q2, equivalent to a 21.8% margin. The company’s cash profitability regressed as it was 2.9 percentage points lower than in the same quarter last year, but it’s still above its five-year average. We wouldn’t read too much into this quarter’s decline because investment needs can be seasonal, leading to short-term swings. Long-term trends trump temporary fluctuations.
Key Takeaways from Kinder Morgan’s Q2 Results
We were impressed by how significantly Kinder Morgan blew past analysts’ revenue expectations this quarter. We were also glad its EPS outperformed Wall Street’s estimates. Zooming out, we think this was a solid print. The stock remained flat at $32.58 immediately following the results.
Kinder Morgan may have had a good quarter, but does that mean you should invest right now? What happened in the latest quarter matters, but not as much as longer-term business quality and valuation, when deciding whether to invest in this stock. We cover that in our actionable full research report which you can read here (it’s free).