Natural gas producer Antero Resources (NYSE: AR) reported Q2 CY2026 results topping the market’s revenue expectations, with sales up 29.6% year on year to $1.56 billion. Its GAAP profit of $0.90 per share was 10.5% above analysts’ consensus estimates.
Is now the time to buy Antero Resources? Find out by accessing our full research report, it’s free.
Antero Resources (AR) Q2 CY2026 Highlights:
- Revenue: $1.56 billion vs analyst estimates of $1.52 billion (29.6% year-on-year growth, 2.4% beat)
- EPS (GAAP): $0.90 vs analyst estimates of $0.81 (10.5% beat)
- Operating Margin: 24.1%, up from 12.1% in the same quarter last year
- Free Cash Flow Margin: 6.3%, down from 18.6% in the same quarter last year
- Oil production: up 12.8% year on year
- Market Capitalization: $10.5 billion
Michael Kennedy, CEO and President of Antero Resources commented, "The second quarter of 2026 reflects the first full quarter following our acquisition of HG Energy. Our quarterly results highlight the substantial benefits from this transaction. Our production base increased by more than 20% from a year ago and our cost structure declined by over 10%. In combination with the strategic acquisitions we completed this July, we expect our per unit costs to continue to decline into year end. Further, while the region's gross production has remained flat, net production to Antero is expected to exit the year over 25% higher than the prior year."
Company Overview
Holding roughly 521,000 net acres across West Virginia, Ohio, and Pennsylvania, Antero Resources (NYSE: AR) drills and produces natural gas, natural gas liquids, and oil from underground rock formations in the Appalachian Basin.
Revenue Growth
Cyclical industries such as Energy can make mediocre companies look great for a time, but a long-term view reveals which businesses can actually withstand and adapt to changing conditions. Regrettably, Antero Resources’s sales grew at a sluggish 6.1% compounded annual growth rate over the last five years. This was below our standard for the energy upstream and integrated energy sector and is a tough starting point for our analysis.
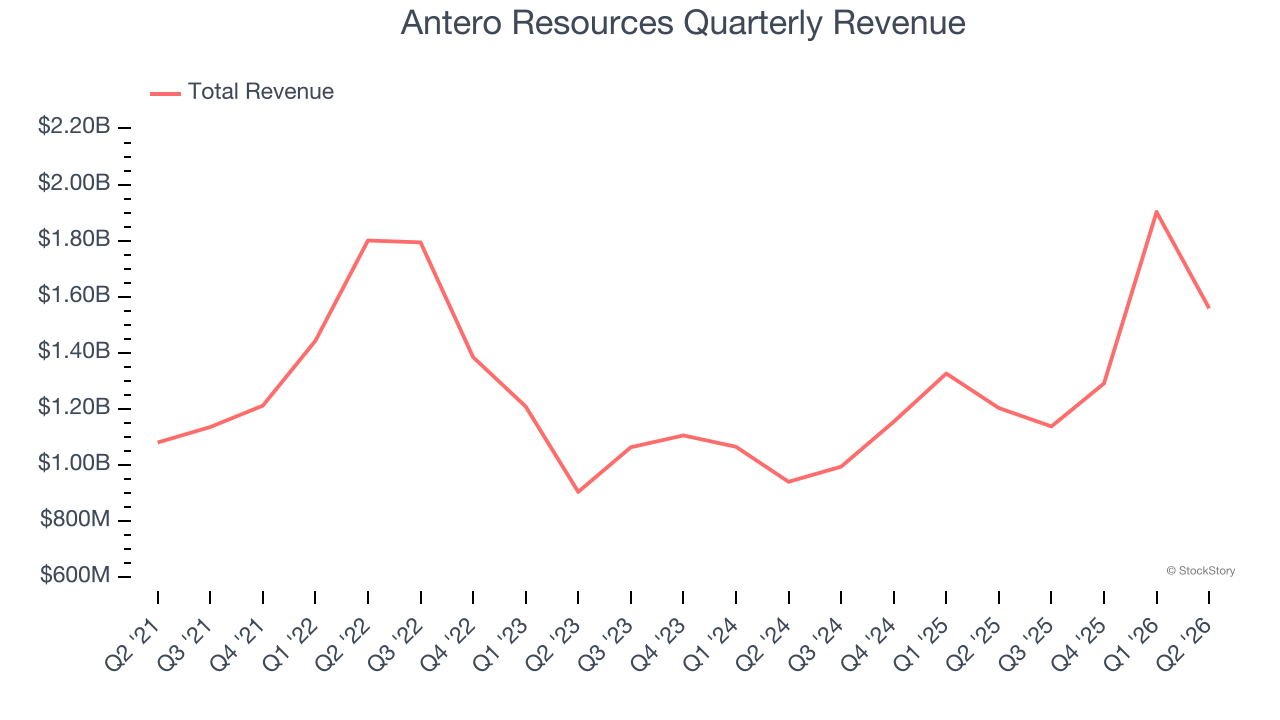
Within Energy, a singular timeframe, even if it’s quite long-term, only sheds light on how well a company rode the last commodity cycle. To better assess whether a company compounds through cycles, we validate our view with an even longer, ten-year view. Antero Resources’s annualized revenue growth of 9.2% over the last ten years is above its five-year trend.
While looking at revenue is important, it can also introduce noise around commodity prices and M&A. Analyzing production, on the other hand, highlights what is happening inside the asset base and whether the economic footprint of a company is expanding. Over the last two years, Antero Resources’s oil production averaged 13.8% year-on-year declines while its ngl production were flat. 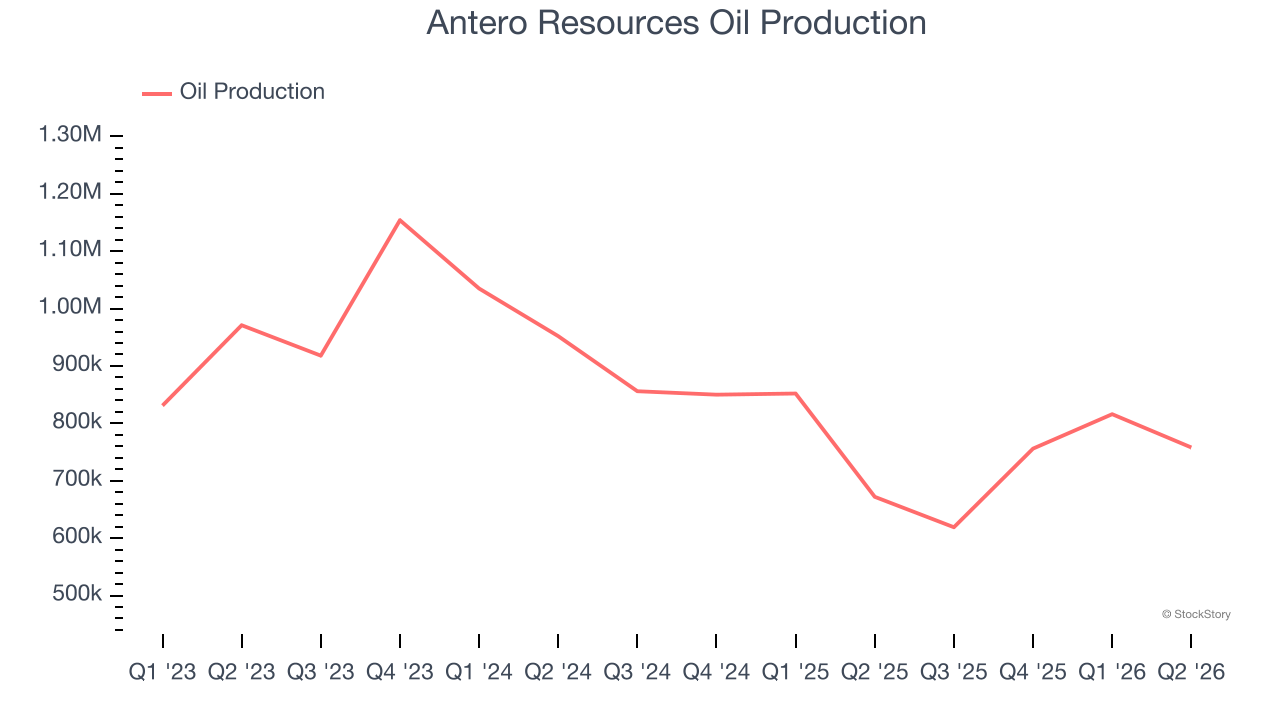
This quarter, Antero Resources reported robust year-on-year revenue growth of 29.6%, and its $1.56 billion of revenue topped Wall Street estimates by 2.4%. This quarter, Antero Resources reported year-on-year Oil production growth of 12.8%.
ALSO WORTH WATCHING: Nvidia’s Quiet Partner. Nvidia’s chips cost a hundred grand. The connectors that make them work cost even more. One company makes them all.
Every AI server needs specialized infrastructure the chip companies don’t make. High-speed cables. Power connectors. Thermal sensors. This 90-year-old company built a monopoly on it. The AI boom just started. This stock is still flying under the radar. Claim The Stock Ticker Here for FREE.
Adjusted EBITDA Margin
Antero Resources has done a decent job managing its cost base over the last five years. The company has produced an average EBITDA margin of 33.8%, higher than the broader energy upstream and integrated energy sector.
Analyzing the trend in its profitability, Antero Resources’s EBITDA margin decreased by 9.6 percentage points over the last year. This raises questions about the company’s expense base because its revenue growth should have given it leverage on its fixed costs, resulting in better economies of scale and profitability.
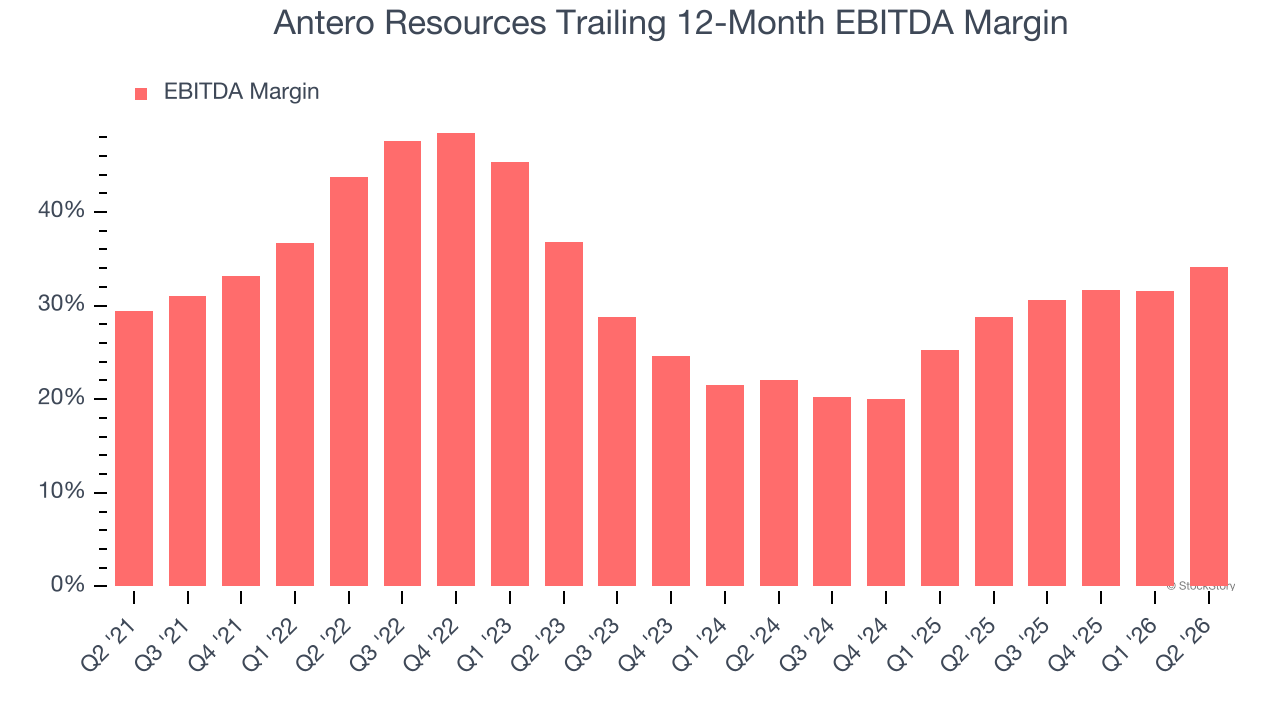
This quarter, Antero Resources generated an EBITDA margin profit margin of 39.5%, up 10 percentage points year on year. This increase was a welcome development and shows it was more efficient. This adjusted EBITDA beat Wall Street’s estimates by 2%.
Cash Is King
Adjusted EBITDA shows how profitable a company’s existing wells are before financing and reinvestment decisions, but free cash flow shows how much value remains after paying the cost of replacing those wells. In upstream energy, production naturally declines over time, so companies must continuously reinvest just to stand still. A producer can report strong EBITDA margins yet generate little or no free cash flow if its wells decline quickly or if new drilling is expensive. Free cash flow therefore captures not only how efficiently a company produces hydrocarbons today, but also how costly it is to sustain that production into the future.
Antero Resources has shown robust cash profitability, driven by its attractive business model that enables it to reinvest or return capital to investors. The company’s free cash flow margin averaged 15.2% over the last five years, quite impressive for an upstream and integrated energy business.
The level of free cash flow is important, but its durability across cycles is just as critical. Consistent margins are far more valuable than volatile swings driven by commodity prices.
Antero Resources’s ratio of quarterly free cash flow volatility to Henry Hub gas-price volatility over the past five years was 2.9 (lower is better), indicating excellent insulation from commodity swings. This stability supports superior capital access in downturns and positions Antero Resources to act as a consolidator when weaker peers are forced to retrench.
You may be asking why we wait until the free cash flow line to perform this stability analysis versus commodity prices. Why not compare revenue or EBITDA to Henry Hub in the case of Antero Resources? Because what ultimately matters is not how much revenue or profit you earn when prices are high but how much cash you can generate when prices are low. Free cash flow is the superior metric because it includes everything from hedging prowess to growth and maintenance capex to management behavior during good times and bad.
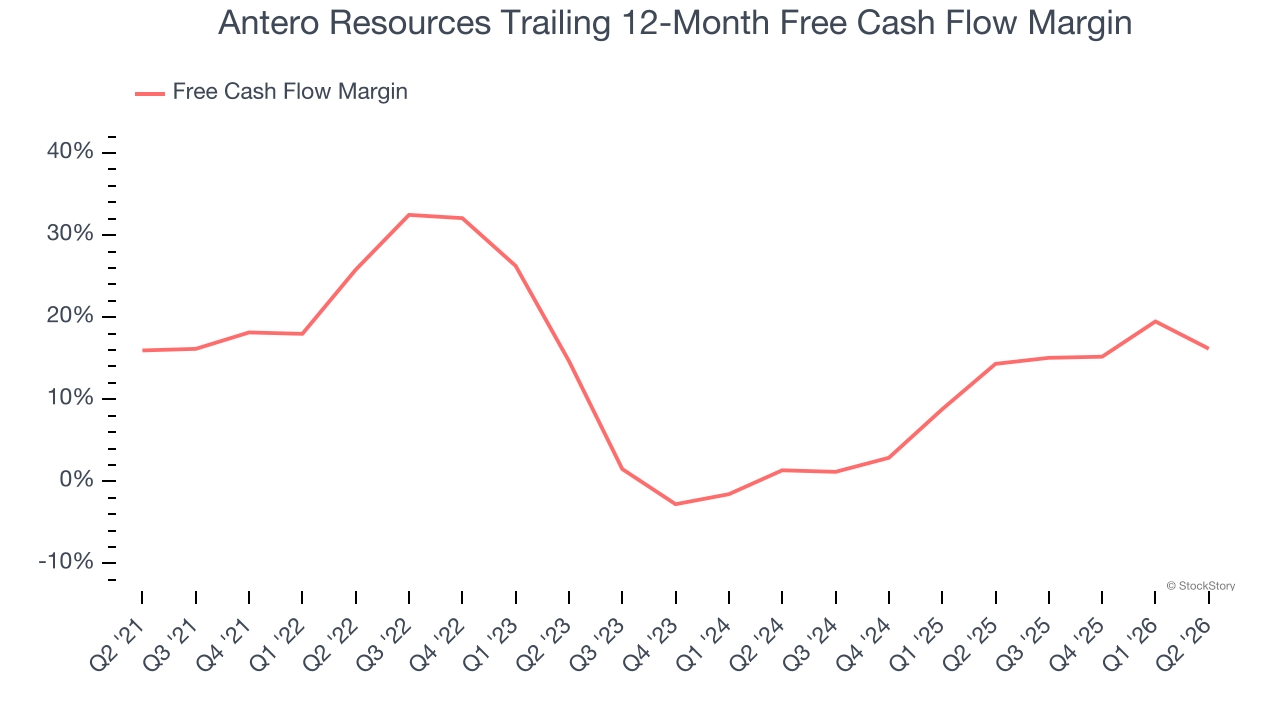
Antero Resources’s free cash flow clocked in at $98.13 million in Q2, equivalent to a 6.3% margin. The company’s cash profitability regressed as it was 12.3 percentage points lower than in the same quarter last year, suggesting its historical struggles have dragged on.
Key Takeaways from Antero Resources’s Q2 Results
We enjoyed seeing Antero Resources beat analysts’ revenue expectations this quarter. We were also glad its EPS outperformed Wall Street’s estimates. Zooming out, we think this was a good print with some key areas of upside. Investors were likely hoping for more, and shares traded down 1.4% to $34.64 immediately after reporting.
So do we think Antero Resources is an attractive buy at the current price? When making that decision, it’s important to consider its valuation, business qualities, as well as what has happened in the latest quarter. We cover that in our actionable full research report which you can read here (it’s free).