Healthcare technology company GE HealthCare Technologies (NASDAQ: GEHC) met Wall Street’s revenue expectations in Q4 CY2024, with sales up 2.2% year on year to $5.32 billion. Its non-GAAP profit of $1.45 per share was 14.8% above analysts’ consensus estimates.
Is now the time to buy GE HealthCare? Find out by accessing our full research report, it’s free.
GE HealthCare (GEHC) Q4 CY2024 Highlights:
- Revenue: $5.32 billion vs analyst estimates of $5.32 billion (2.2% year-on-year growth, in line)
- Adjusted EPS: $1.45 vs analyst estimates of $1.26 (14.8% beat)
- Adjusted EPS guidance for the upcoming financial year 2025 is $4.68 at the midpoint, beating analyst estimates by 0.7%
- Operating Margin: 15.1%, up from 13.2% in the same quarter last year
- Free Cash Flow Margin: 15.2%, down from 18.4% in the same quarter last year
- Organic Revenue rose 2% year on year (4.6% in the same quarter last year)
- Market Capitalization: $39.25 billion
GE HealthCare President and CEO Peter Arduini said, “We were pleased with the strong momentum in orders, backlog and book-to-bill that we saw in the fourth quarter. We also continued to deliver revenue growth driven by demand in our Advanced Visualization Solutions and Pharmaceutical Diagnostics businesses, with overall strength in the U.S., and robust margin expansion and earnings growth. Customer interest in new, differentiated products contributed to orders growth and recurring revenue in the year. We remain committed to our precision care strategy for growth, supported by innovation, productivity initiatives, and commercial execution.”
Company Overview
Founded as a division of General Electric, GE HealthCare Technologies (NASDAQ: GEHC) designs and manufactures advanced medical imaging equipment, patient monitoring systems, and other digital solutions
Medical Devices & Supplies - Imaging, Diagnostics
The medical devices and supplies industry, particularly those specializing in imaging and diagnostics, operates with a comparatively stable yet capital-intensive business model. Companies in this space benefit from consistent demand driven by the essential nature of diagnostic tools in patient care, as well as recurring revenue streams from consumables, service contracts, and equipment maintenance. However, the industry faces challenges such as significant upfront development costs, stringent regulatory requirements, and pricing pressures from hospitals and healthcare systems, which are increasingly focused on cost containment. Looking ahead, the industry should enjoy tailwinds from advancements in technology, including the integration of artificial intelligence to enhance diagnostic accuracy and workflow efficiency, as well as rising demand for imaging solutions driven by aging populations. On the other hand, headwinds could arise from a rethinking of healthcare costs potentially resulting in reimbursement cuts and slower capital equipment purchasing. Additionally, cybersecurity concerns surrounding connected medical devices could introduce new risks and complexities for manufacturers.
Sales Growth
A company’s long-term sales performance can indicate its overall quality. Any business can put up a good quarter or two, but many enduring ones grow for years. Regrettably, GE HealthCare’s sales grew at a tepid 3.8% compounded annual growth rate over the last three years. This was below our standard for the healthcare sector and is a poor baseline for our analysis.
Long-term growth is the most important, but within healthcare, a stretched historical view may miss new innovations or demand cycles. GE HealthCare’s annualized revenue growth of 3.6% over the last two years aligns with its three-year trend, suggesting its demand was consistently weak. 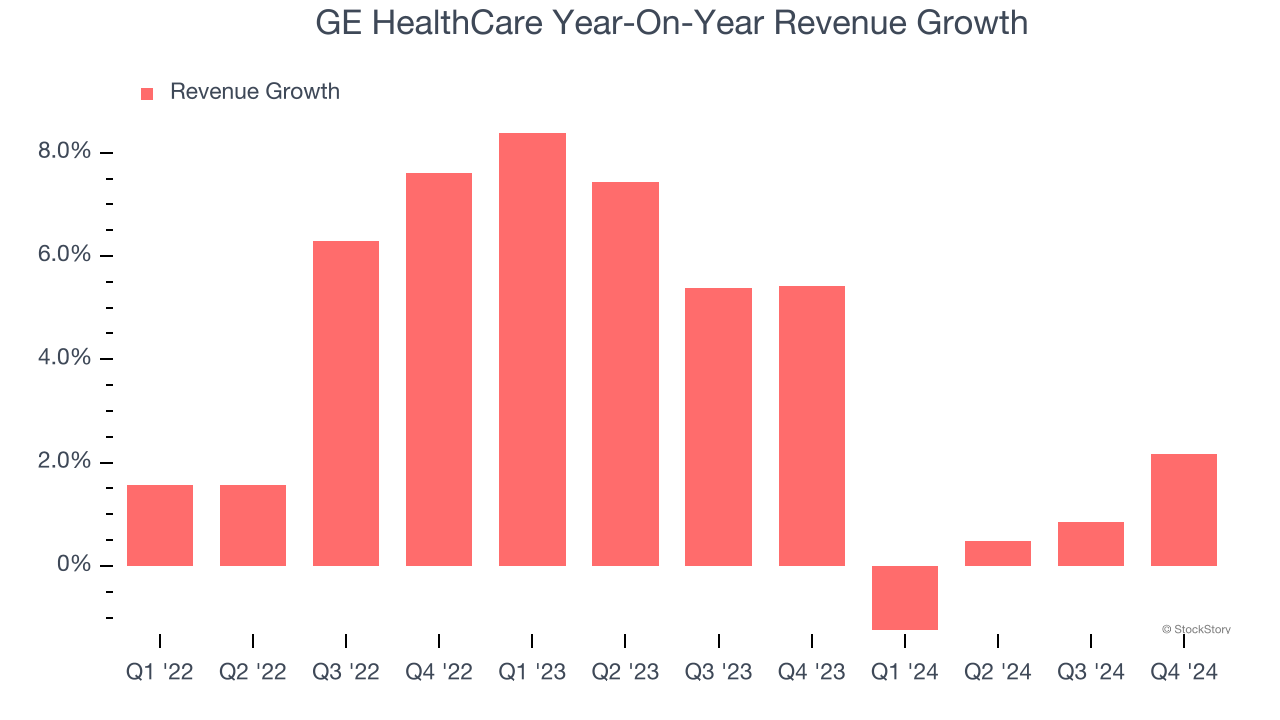
GE HealthCare also reports organic revenue, which strips out one-time events like acquisitions and currency fluctuations that don’t accurately reflect its fundamentals. Over the last two years, GE HealthCare’s organic revenue averaged 4.4% year-on-year growth. Because this number aligns with its normal revenue growth, we can see the company’s core operations (not acquisitions and divestitures) drove most of its results. 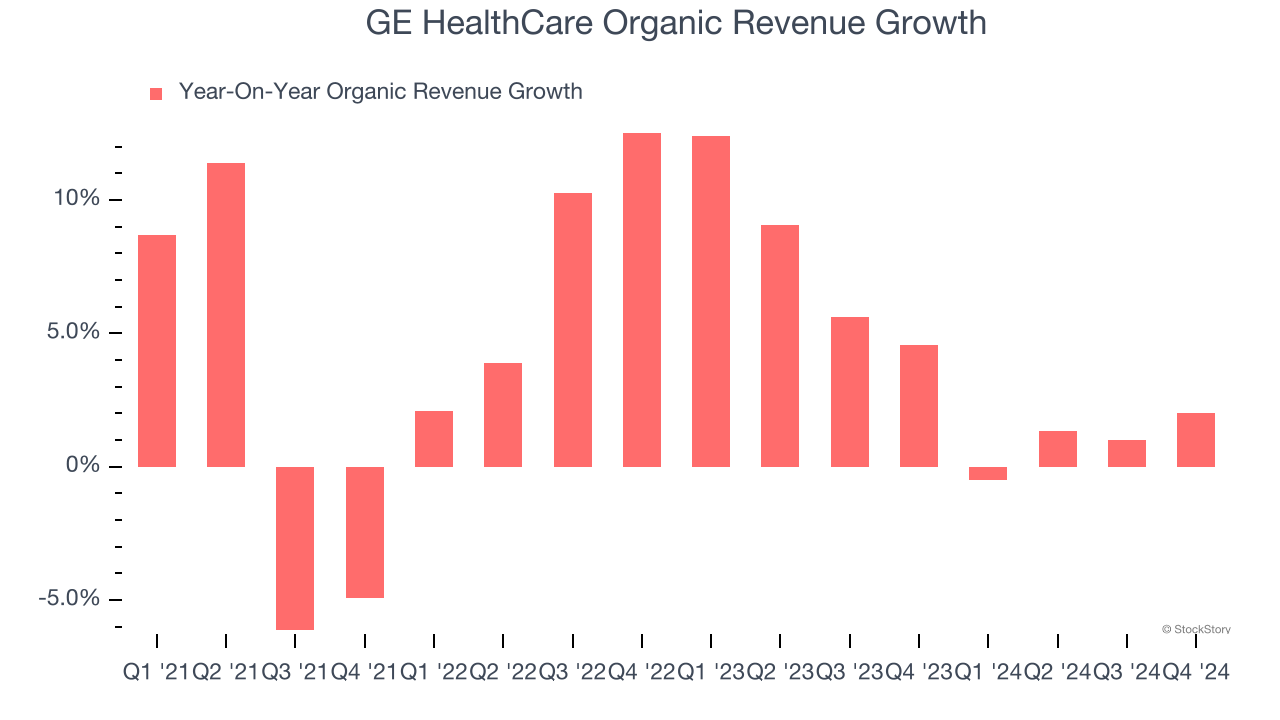
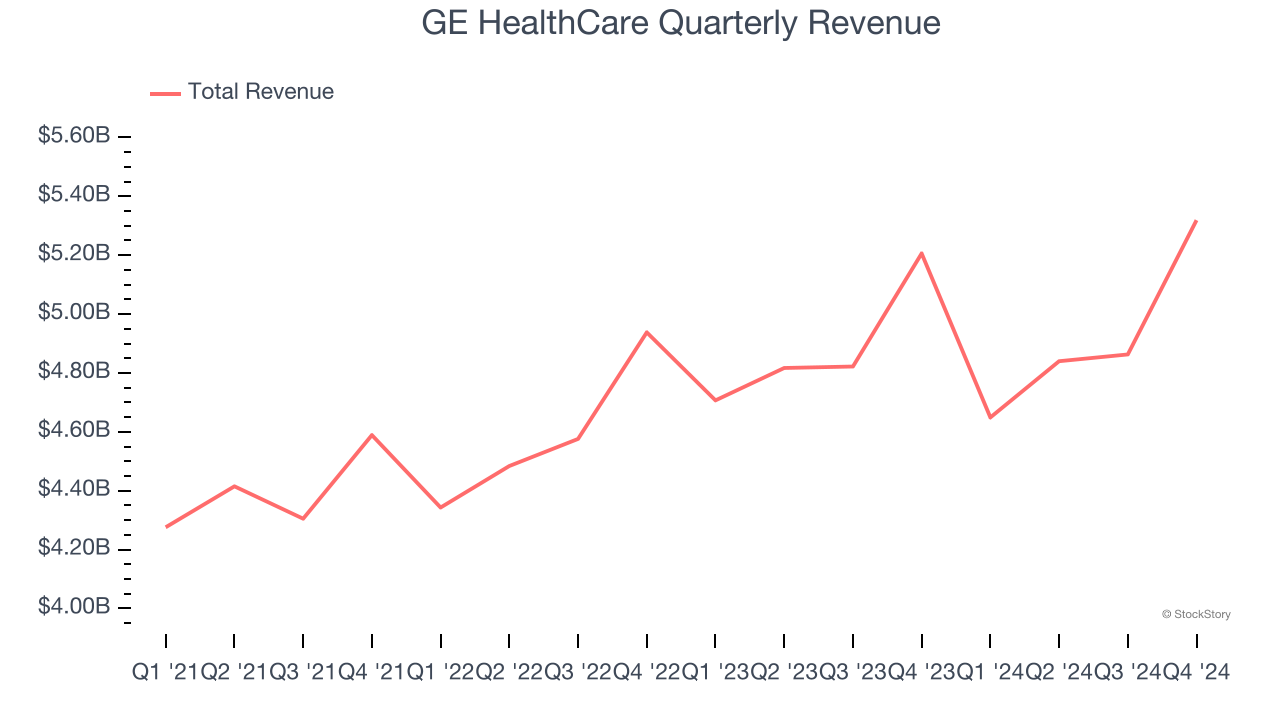
This quarter, GE HealthCare grew its revenue by 2.2% year on year, and its $5.32 billion of revenue was in line with Wall Street’s estimates.
Looking ahead, sell-side analysts expect revenue to grow 3.6% over the next 12 months, similar to its two-year rate. This projection is underwhelming and implies its newer products and services will not catalyze better top-line performance yet.
Unless you’ve been living under a rock, it should be obvious by now that generative AI is going to have a huge impact on how large corporations do business. While Nvidia and AMD are trading close to all-time highs, we prefer a lesser-known (but still profitable) stock benefiting from the rise of AI. Click here to access our free report one of our favorites growth stories.
Operating Margin
Operating margin is an important measure of profitability as it shows the portion of revenue left after accounting for all core expenses – everything from the cost of goods sold to advertising and wages. It’s also useful for comparing profitability across companies with different levels of debt and tax rates because it excludes interest and taxes.
GE HealthCare has done a decent job managing its cost base over the last four years. The company has produced an average operating margin of 13.8%, higher than the broader healthcare sector.
Analyzing the trend in its profitability, GE HealthCare’s operating margin decreased by 2.6 percentage points over the last four years. A silver lining is that on a two-year basis, its margin has stabilized. Still, shareholders will want to see GE HealthCare become more profitable in the future.
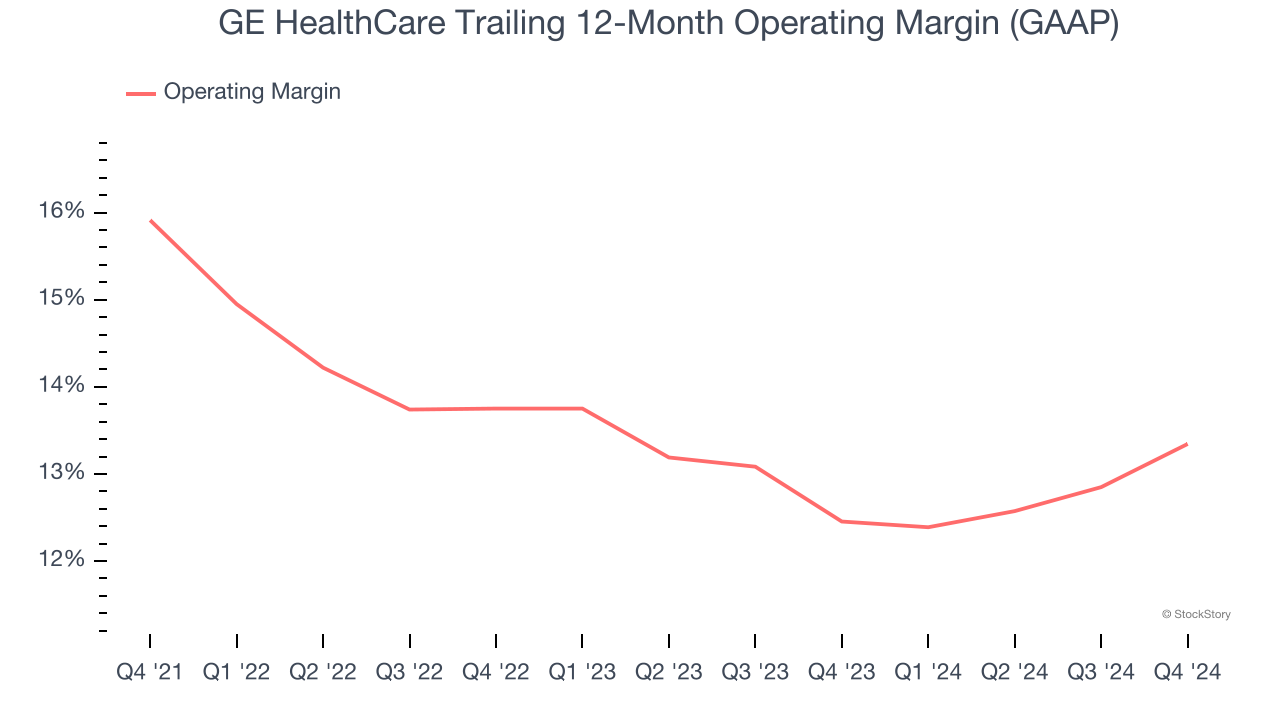
This quarter, GE HealthCare generated an operating profit margin of 15.1%, up 1.8 percentage points year on year. This increase was a welcome development and shows it was recently more efficient because its expenses grew slower than its revenue.
Earnings Per Share
Revenue trends explain a company’s historical growth, but the change in earnings per share (EPS) points to the profitability of that growth – for example, a company could inflate its sales through excessive spending on advertising and promotions.
Sadly for GE HealthCare, its EPS declined by 3.6% annually over the last three years while its revenue grew by 3.8%. This tells us the company became less profitable on a per-share basis as it expanded.
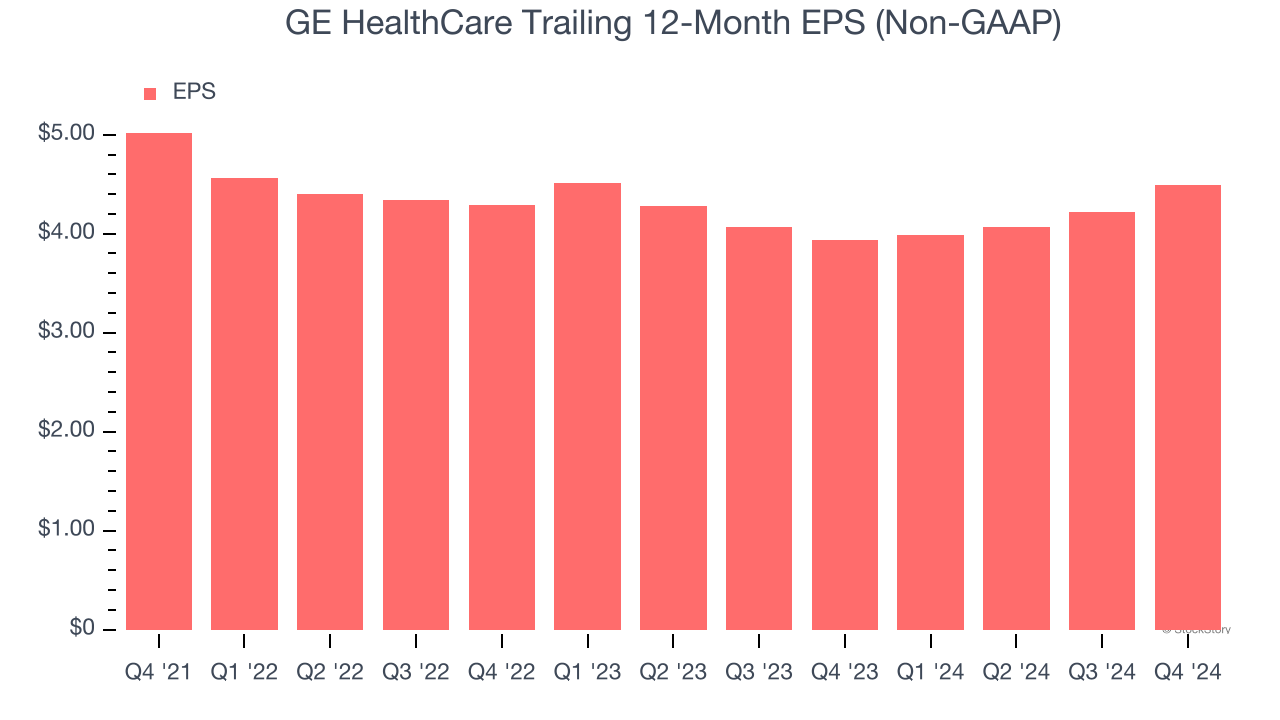
In Q4, GE HealthCare reported EPS at $1.45, up from $1.18 in the same quarter last year. This print easily cleared analysts’ estimates, and shareholders should be content with the results. Over the next 12 months, Wall Street expects GE HealthCare’s full-year EPS of $4.49 to grow 3%.
Key Takeaways from GE HealthCare’s Q4 Results
It was encouraging to see GE HealthCare beat analysts’ EPS expectations this quarter. We were also happy its full-year EPS guidance narrowly outperformed Wall Street’s estimates. Overall, this quarter had some key positives. The stock traded up 1.5% to $87.10 immediately following the results.
Is GE HealthCare an attractive investment opportunity right now? We think that the latest quarter is only one piece of the longer-term business quality puzzle. Quality, when combined with valuation, can help determine if the stock is a buy. We cover that in our actionable full research report which you can read here, it’s free.