
Climate control solutions innovator Lennox International (NYSE: LII) beat Wall Street’s revenue expectations in Q1 CY2025, with sales up 2.4% year on year to $1.07 billion. Its non-GAAP profit of $3.37 per share was 3.6% above analysts’ consensus estimates.
Is now the time to buy Lennox? Find out by accessing our full research report, it’s free.
Lennox (LII) Q1 CY2025 Highlights:
- Revenue: $1.07 billion vs analyst estimates of $1.03 billion (2.4% year-on-year growth, 4.6% beat)
- Adjusted EPS: $3.37 vs analyst estimates of $3.25 (3.6% beat)
- Adjusted EBITDA: $187.5 million vs analyst estimates of $180.4 million (17.5% margin, 3.9% beat)
- Management slightly raised its full-year Adjusted EPS guidance to $22.88 at the midpoint
- Operating Margin: 14.5%, down from 15.9% in the same quarter last year
- Free Cash Flow was -$61.3 million compared to -$51.8 million in the same quarter last year
- Organic Revenue rose 2% year on year (4.2% in the same quarter last year)
- Market Capitalization: $19.82 billion
"Our results this quarter highlight the strength of our replacement-driven business model and the value of our North American-focused strategy. We are navigating the shifting trade dynamics with flexibility, supported by a more resilient supply chain built through past disruptions," said CEO, Alok Maskara.
Company Overview
Based in Texas and founded over a century ago, Lennox (NYSE: LII) is a climate control solutions company offering heating, ventilation, air conditioning, and refrigeration (HVACR) goods.
HVAC and Water Systems
Many HVAC and water systems companies sell essential, non-discretionary infrastructure for buildings. Since the useful lives of these water heaters and vents are fairly standard, these companies have a portion of predictable replacement revenue. In the last decade, trends in energy efficiency and clean water are driving innovation that is leading to incremental demand. On the other hand, new installations for these companies are at the whim of residential and commercial construction volumes, which tend to be cyclical and can be impacted heavily by economic factors such as interest rates.
Sales Growth
A company’s long-term sales performance can indicate its overall quality. Any business can put up a good quarter or two, but many enduring ones grow for years. Over the last five years, Lennox grew its sales at a mediocre 7.5% compounded annual growth rate. This wasn’t a great result compared to the rest of the industrials sector, but there are still things to like about Lennox.
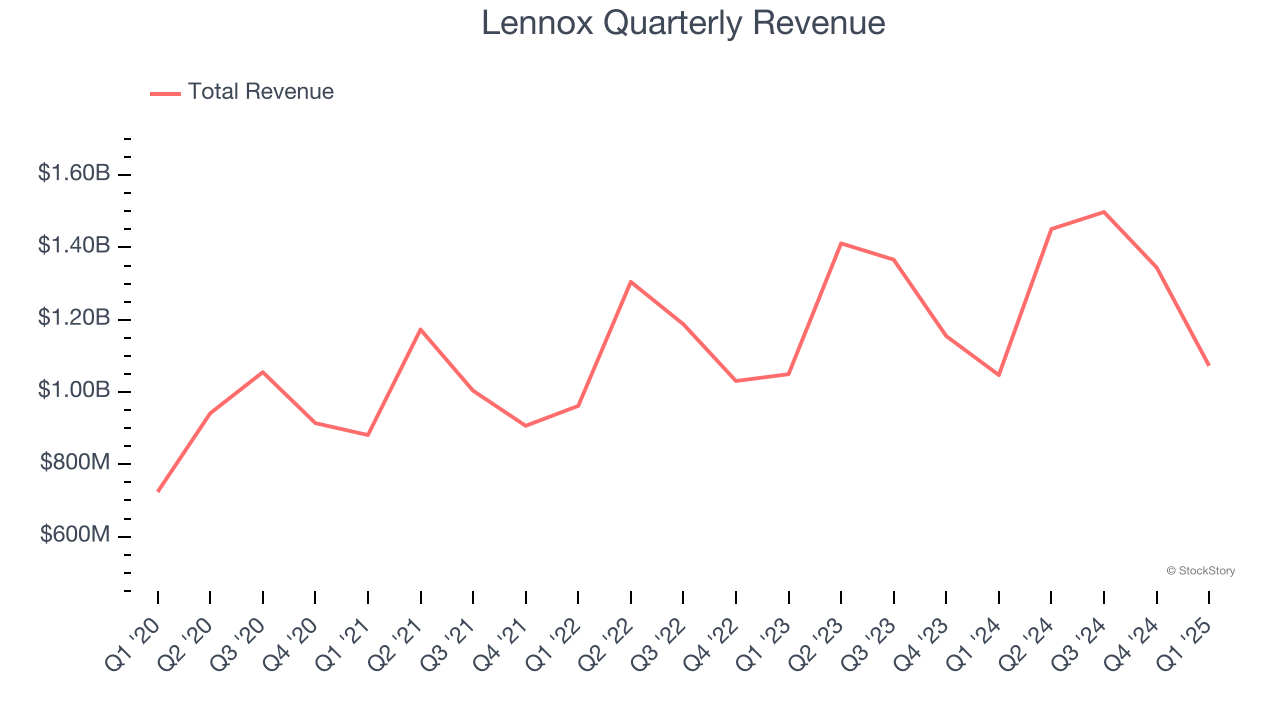
We at StockStory place the most emphasis on long-term growth, but within industrials, a half-decade historical view may miss cycles, industry trends, or a company capitalizing on catalysts such as a new contract win or a successful product line. Lennox’s annualized revenue growth of 8.3% over the last two years aligns with its five-year trend, suggesting its demand was stable. 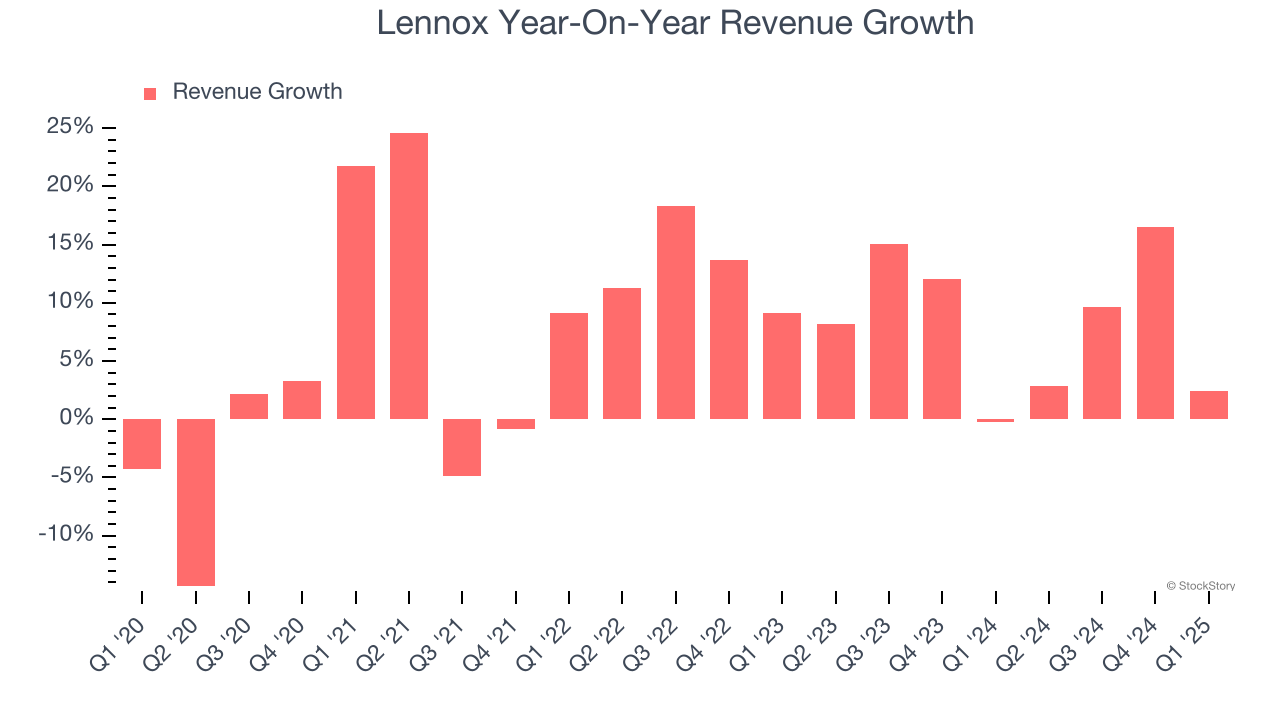
Lennox also reports organic revenue, which strips out one-time events like acquisitions and currency fluctuations that don’t accurately reflect its fundamentals. Over the last two years, Lennox’s organic revenue averaged 8.4% year-on-year growth. Because this number aligns with its normal revenue growth, we can see the company’s core operations (not acquisitions and divestitures) drove most of its results. 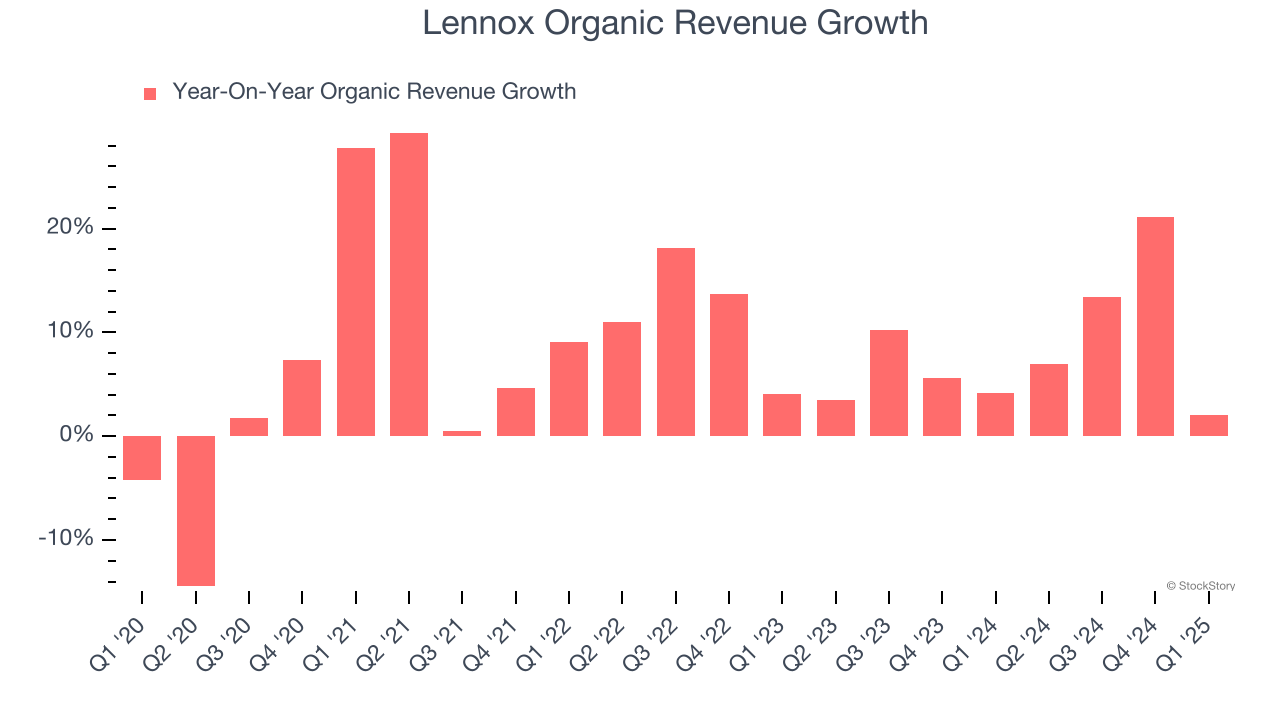
This quarter, Lennox reported modest year-on-year revenue growth of 2.4% but beat Wall Street’s estimates by 4.6%.
Looking ahead, sell-side analysts expect revenue to grow 3.3% over the next 12 months, a deceleration versus the last two years. This projection doesn't excite us and indicates its products and services will face some demand challenges. At least the company is tracking well in other measures of financial health.
Unless you’ve been living under a rock, it should be obvious by now that generative AI is going to have a huge impact on how large corporations do business. While Nvidia and AMD are trading close to all-time highs, we prefer a lesser-known (but still profitable) stock benefiting from the rise of AI. Click here to access our free report one of our favorites growth stories.
Operating Margin
Lennox has been a well-oiled machine over the last five years. It demonstrated elite profitability for an industrials business, boasting an average operating margin of 16.1%. This result was particularly impressive because of its low gross margin, which is mostly a factor of what it sells and takes huge shifts to move meaningfully. Companies have more control over their operating margins, and it’s a show of well-managed operations if they’re high when gross margins are low.
Analyzing the trend in its profitability, Lennox’s operating margin rose by 4.4 percentage points over the last five years, as its sales growth gave it operating leverage.
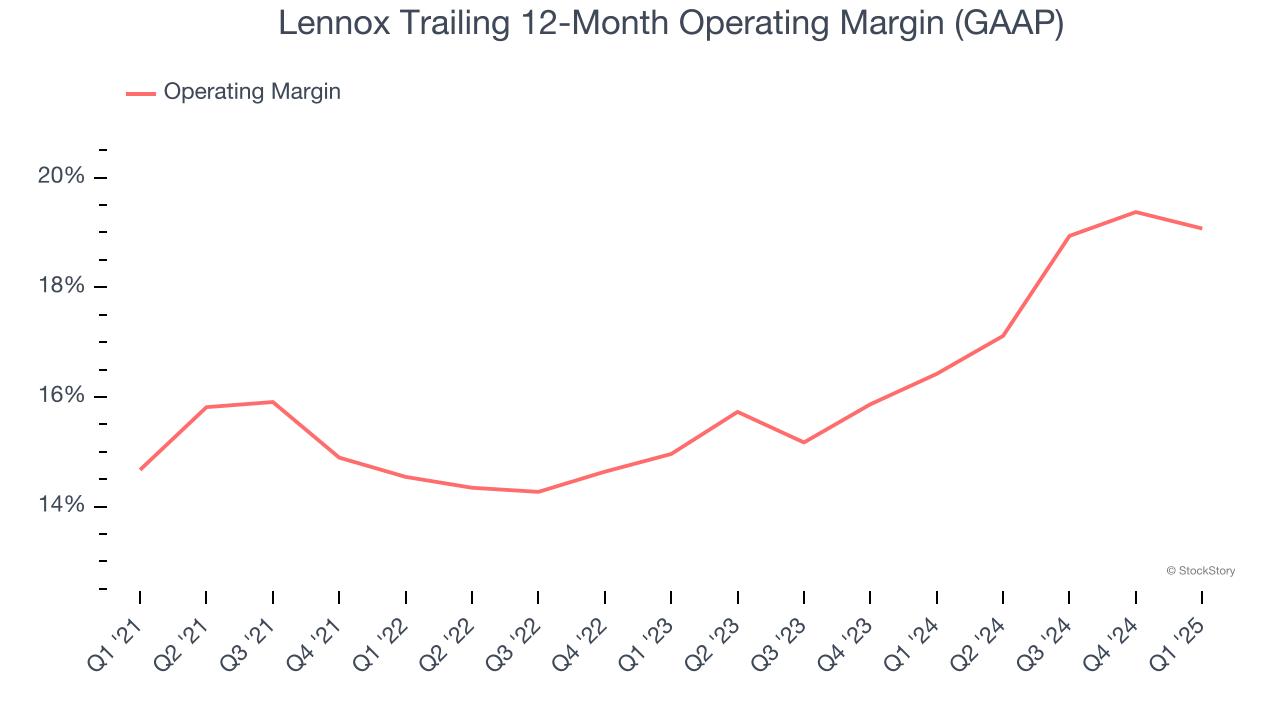
In Q1, Lennox generated an operating profit margin of 14.5%, down 1.4 percentage points year on year. Since Lennox’s gross margin decreased more than its operating margin, we can assume its recent inefficiencies were driven more by weaker leverage on its cost of sales rather than increased marketing, R&D, and administrative overhead expenses.
Earnings Per Share
Revenue trends explain a company’s historical growth, but the long-term change in earnings per share (EPS) points to the profitability of that growth – for example, a company could inflate its sales through excessive spending on advertising and promotions.
Lennox’s EPS grew at a spectacular 17.4% compounded annual growth rate over the last five years, higher than its 7.5% annualized revenue growth. This tells us the company became more profitable on a per-share basis as it expanded.
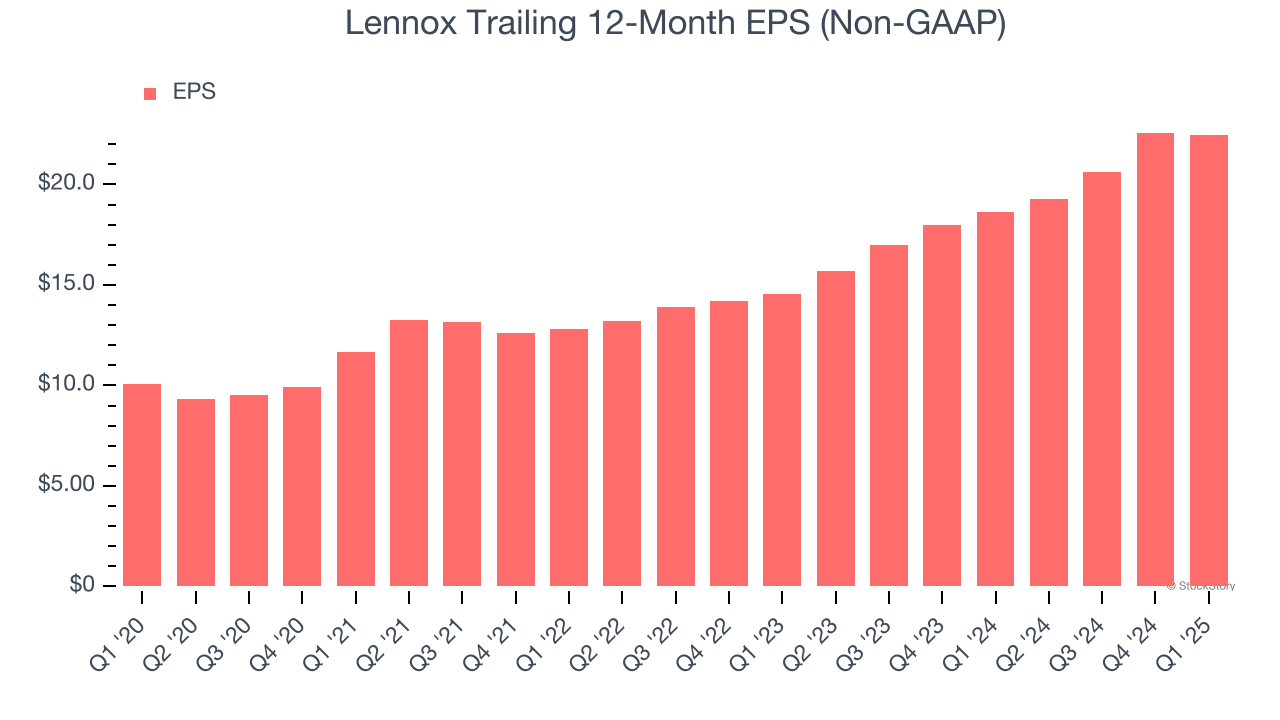
Diving into the nuances of Lennox’s earnings can give us a better understanding of its performance. As we mentioned earlier, Lennox’s operating margin declined this quarter but expanded by 4.4 percentage points over the last five years. Its share count also shrank by 7.8%, and these factors together are positive signs for shareholders because improving profitability and share buybacks turbocharge EPS growth relative to revenue growth. 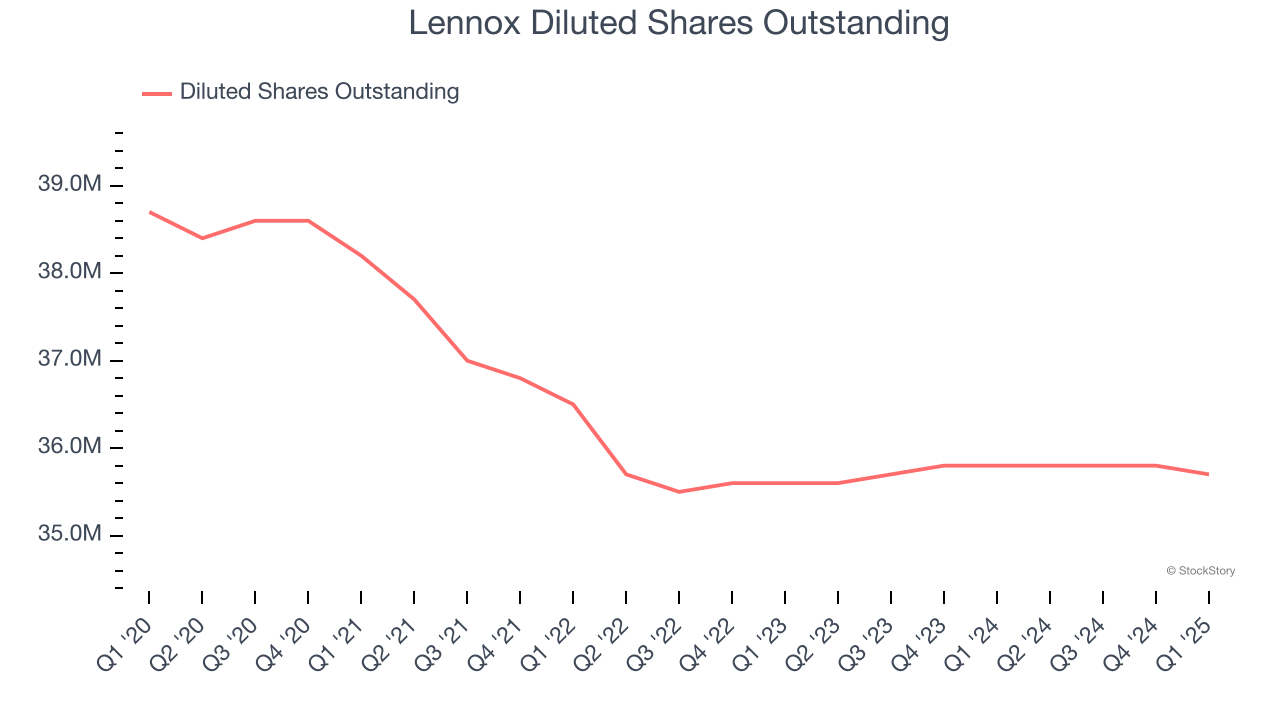
Like with revenue, we analyze EPS over a more recent period because it can provide insight into an emerging theme or development for the business.
For Lennox, its two-year annual EPS growth of 24.3% was higher than its five-year trend. We love it when earnings growth accelerates, especially when it accelerates off an already high base.
In Q1, Lennox reported EPS at $3.37, down from $3.47 in the same quarter last year. Despite falling year on year, this print beat analysts’ estimates by 3.6%. Over the next 12 months, Wall Street expects Lennox’s full-year EPS of $22.48 to grow 5.7%.
Key Takeaways from Lennox’s Q1 Results
We were impressed by how significantly Lennox blew past analysts’ organic revenue and reported revenue expectations this quarter. EPS also beat, and the company raised full-year EPS guidance. Management added that "revenue is still anticipated to increase by approximately 2%. We now expect additional pricing gains to overcome tariffs while preserving profit margins and offsetting the impact of potential volume declines." Despite the good news, shares traded down 4.3% to $534.99 immediately after reporting.
So do we think Lennox is an attractive buy at the current price? The latest quarter does matter, but not nearly as much as longer-term fundamentals and valuation, when deciding if the stock is a buy. We cover that in our actionable full research report which you can read here, it’s free.