The SPDR S&P Retail ETF (XRT) has long been the primary barometer for the health of the American consumer, and lately, the readings are turning decidedly cold.
After months of defiant trading, the ETF is beginning to crack, with price action finally aligning with the sobering fundamental pressures of 2026.
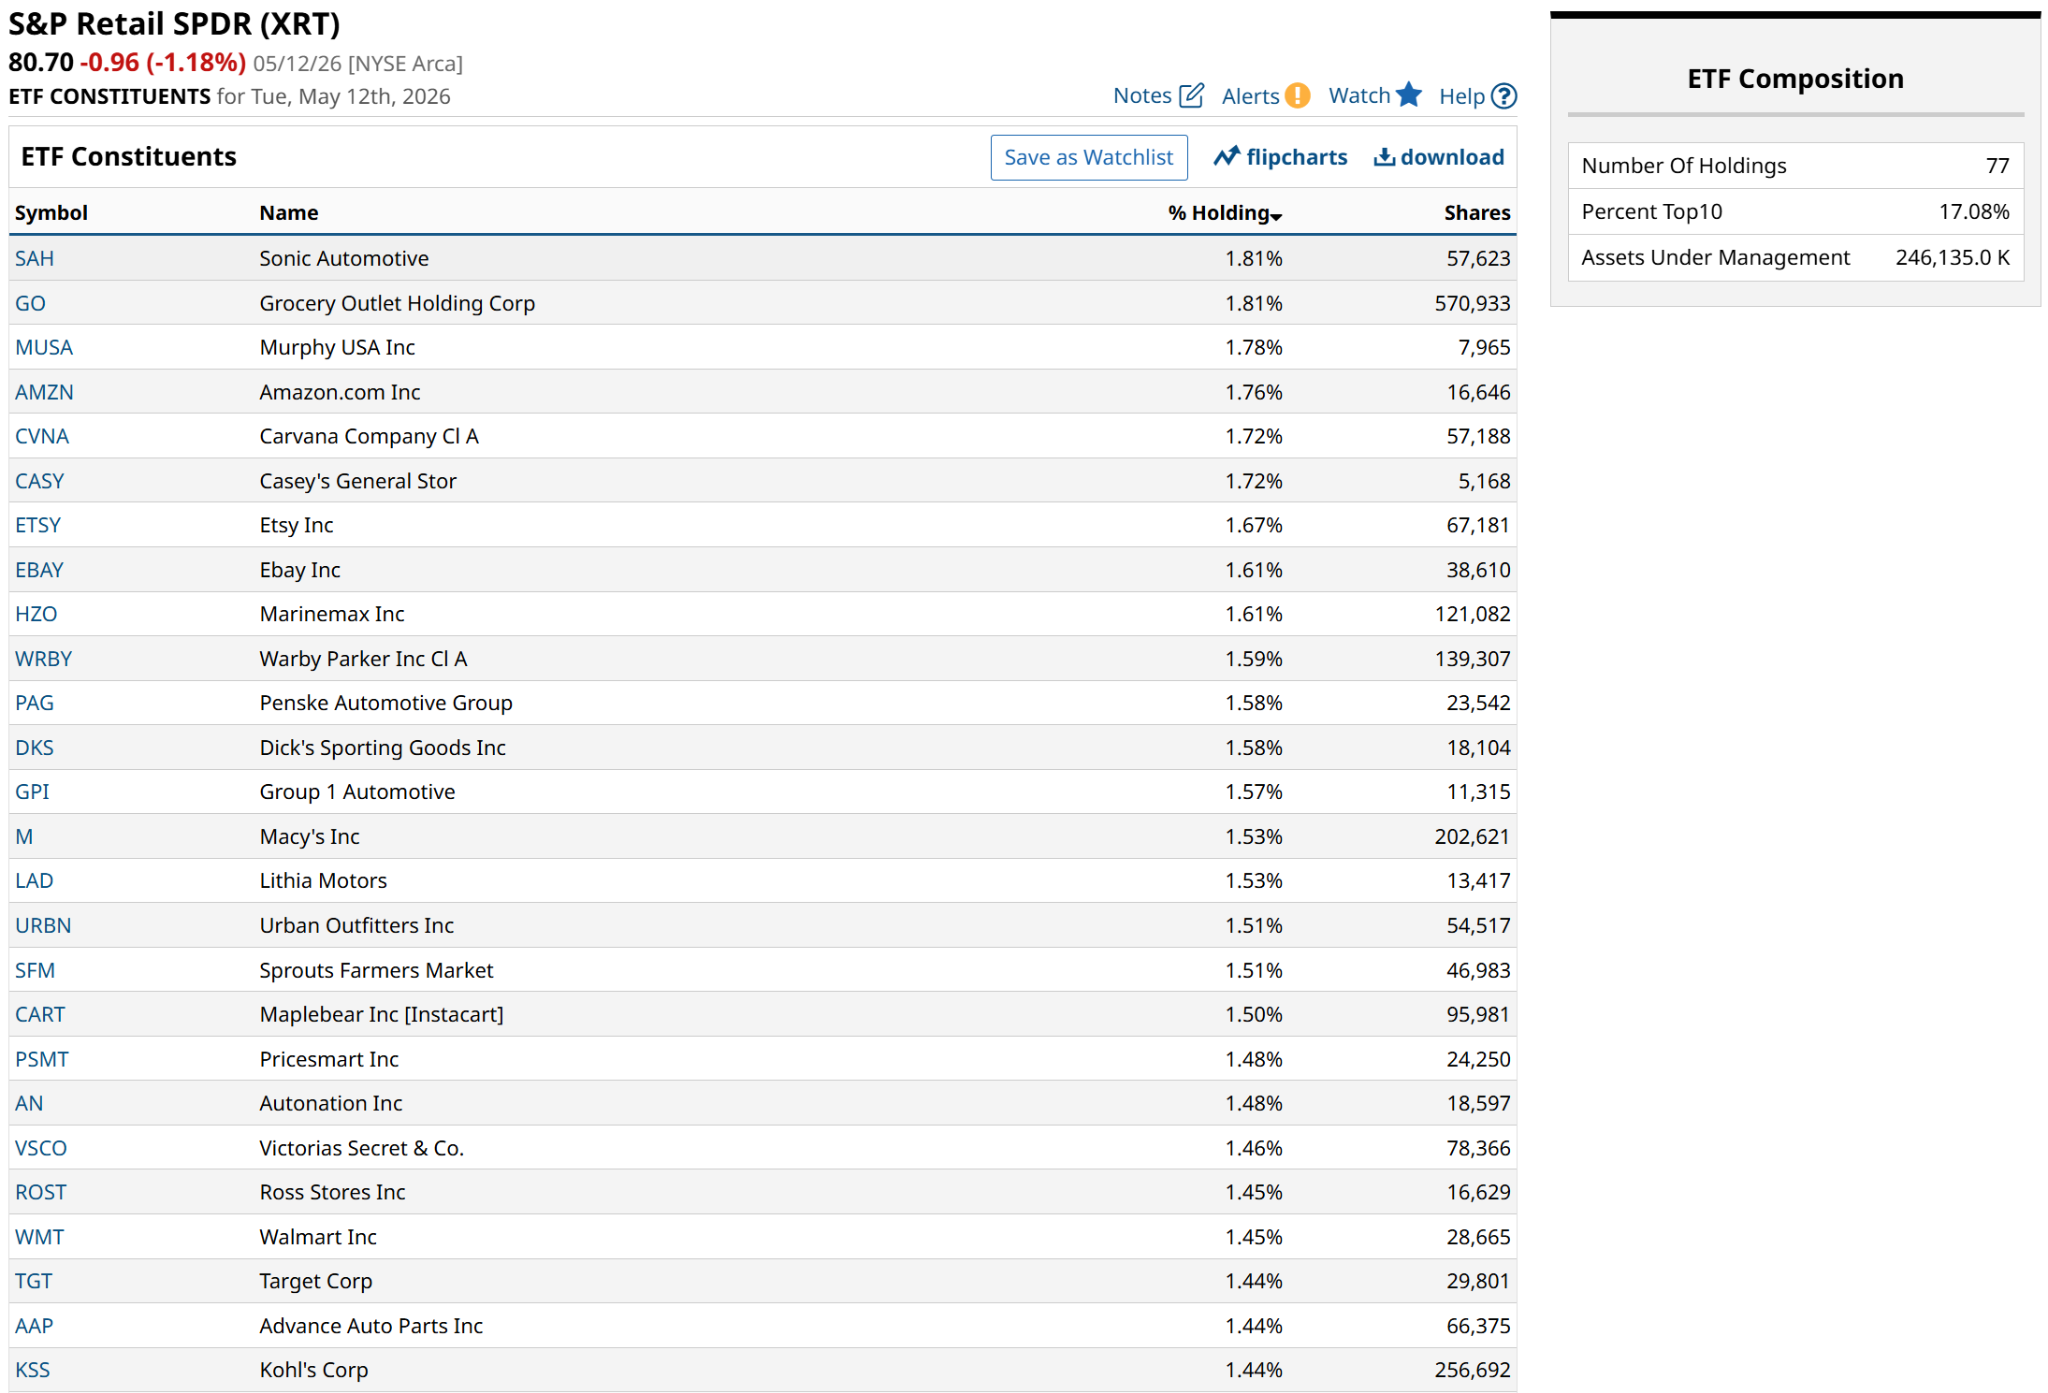
Technically, it appears XRT is done. It is still in a trading range, but that PPO indicator at the bottom of the chart below does not bode well for this 77-stock, equal-weighted basket of U.S.-based retail companies. You know many of the names. But that’s not going to help XRT stay up.
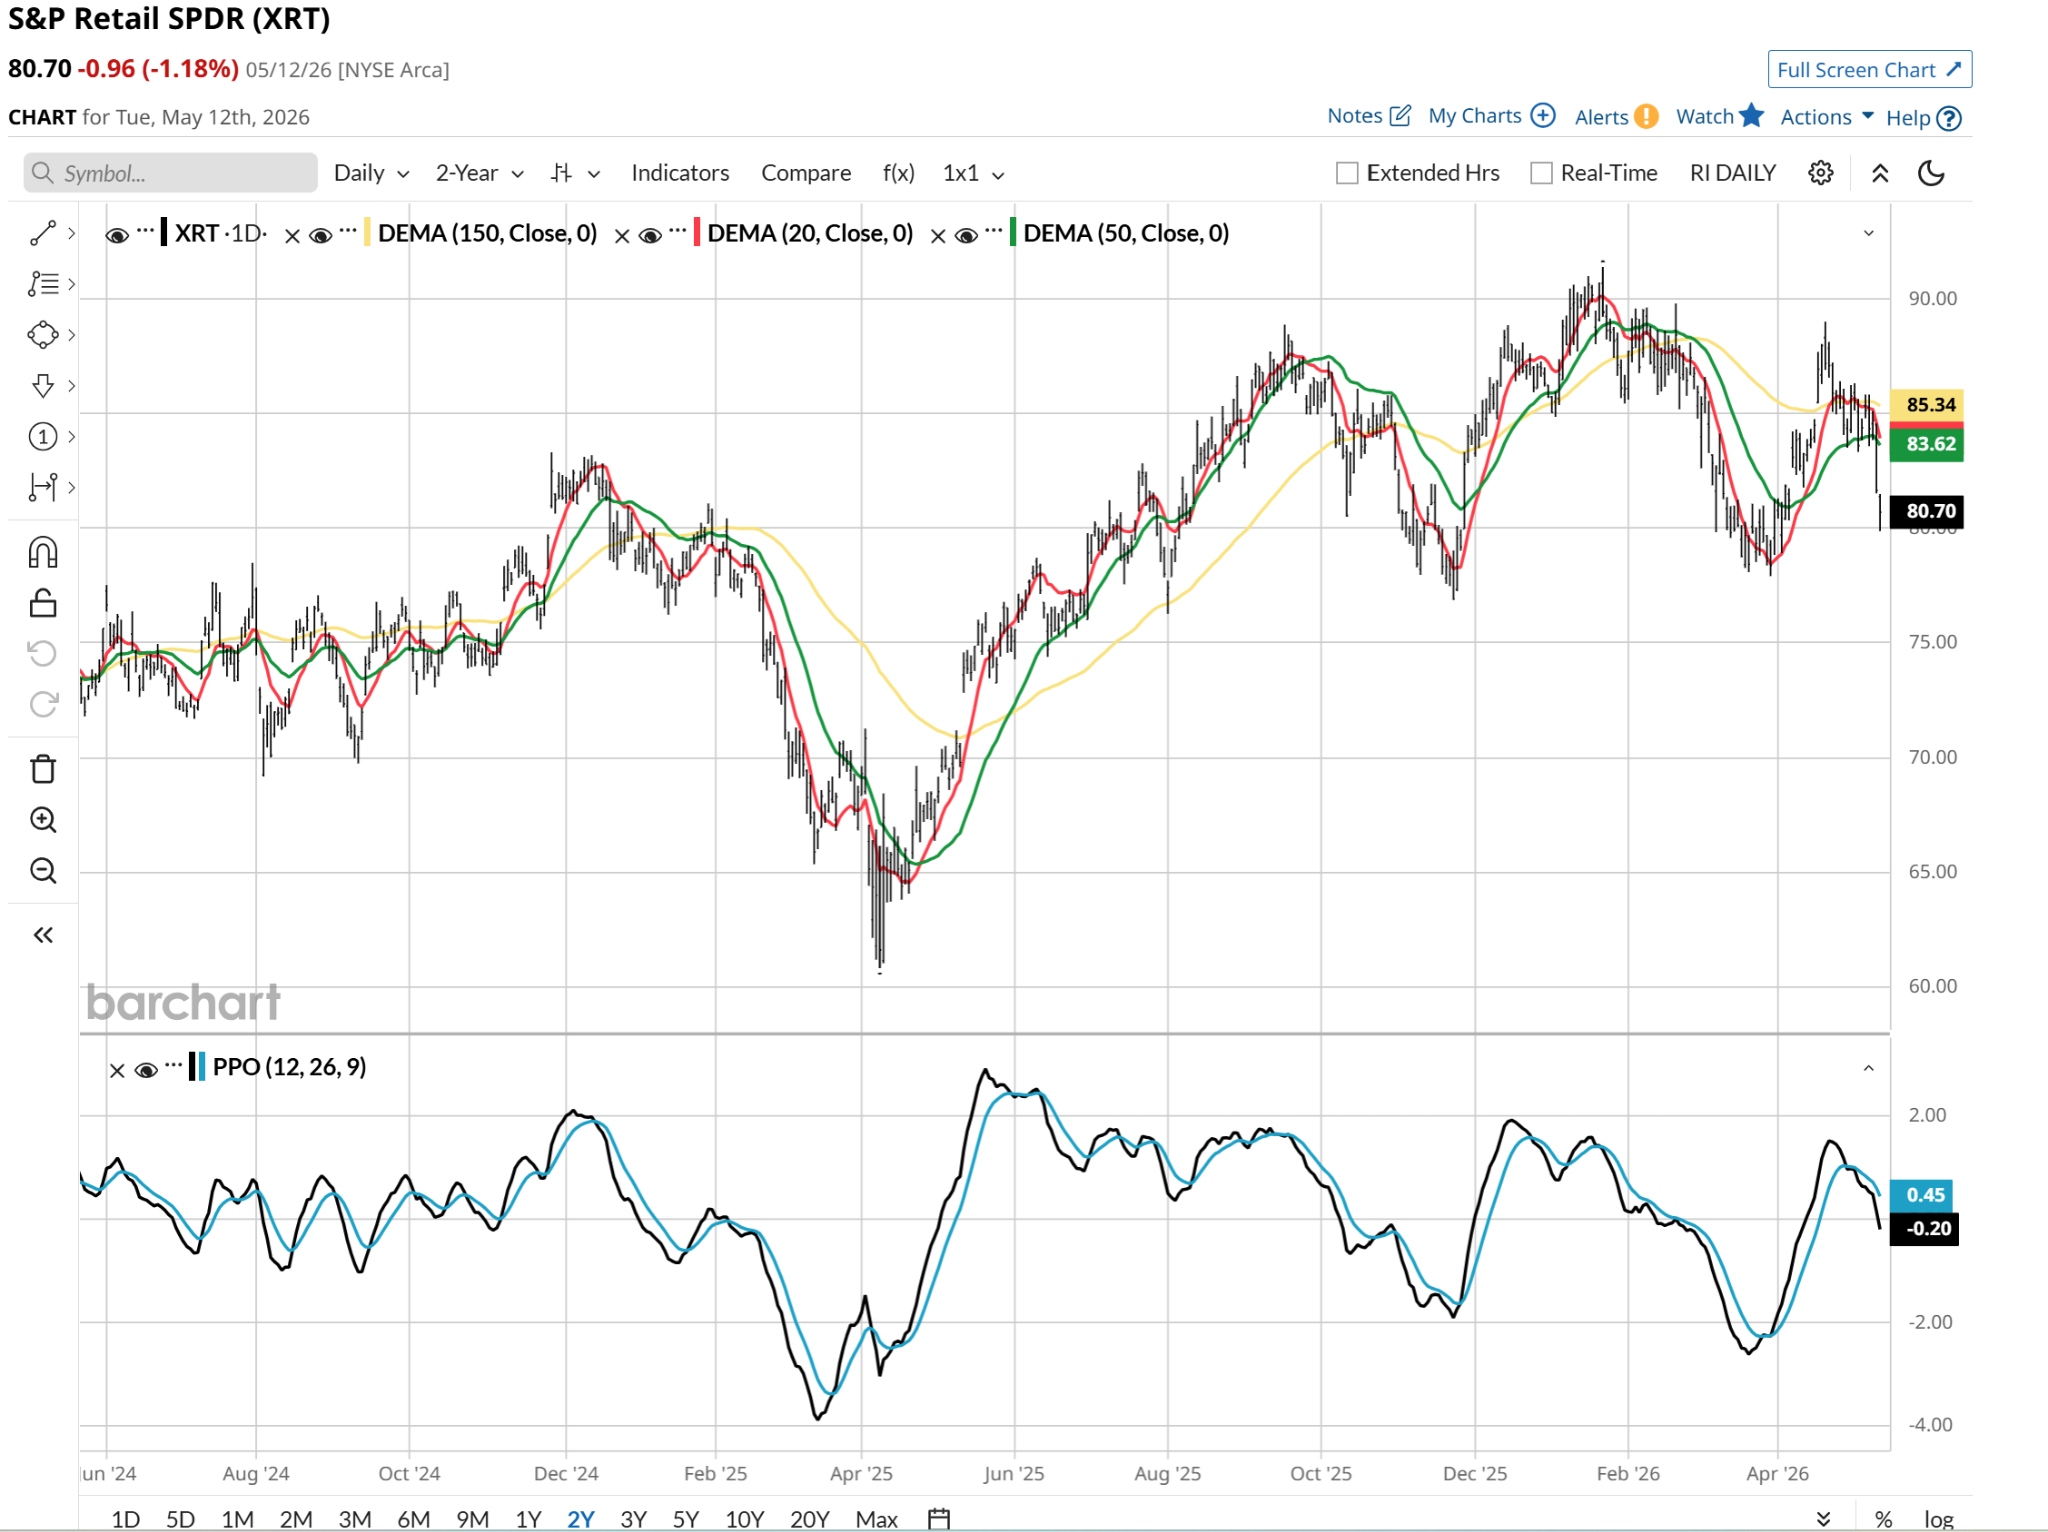
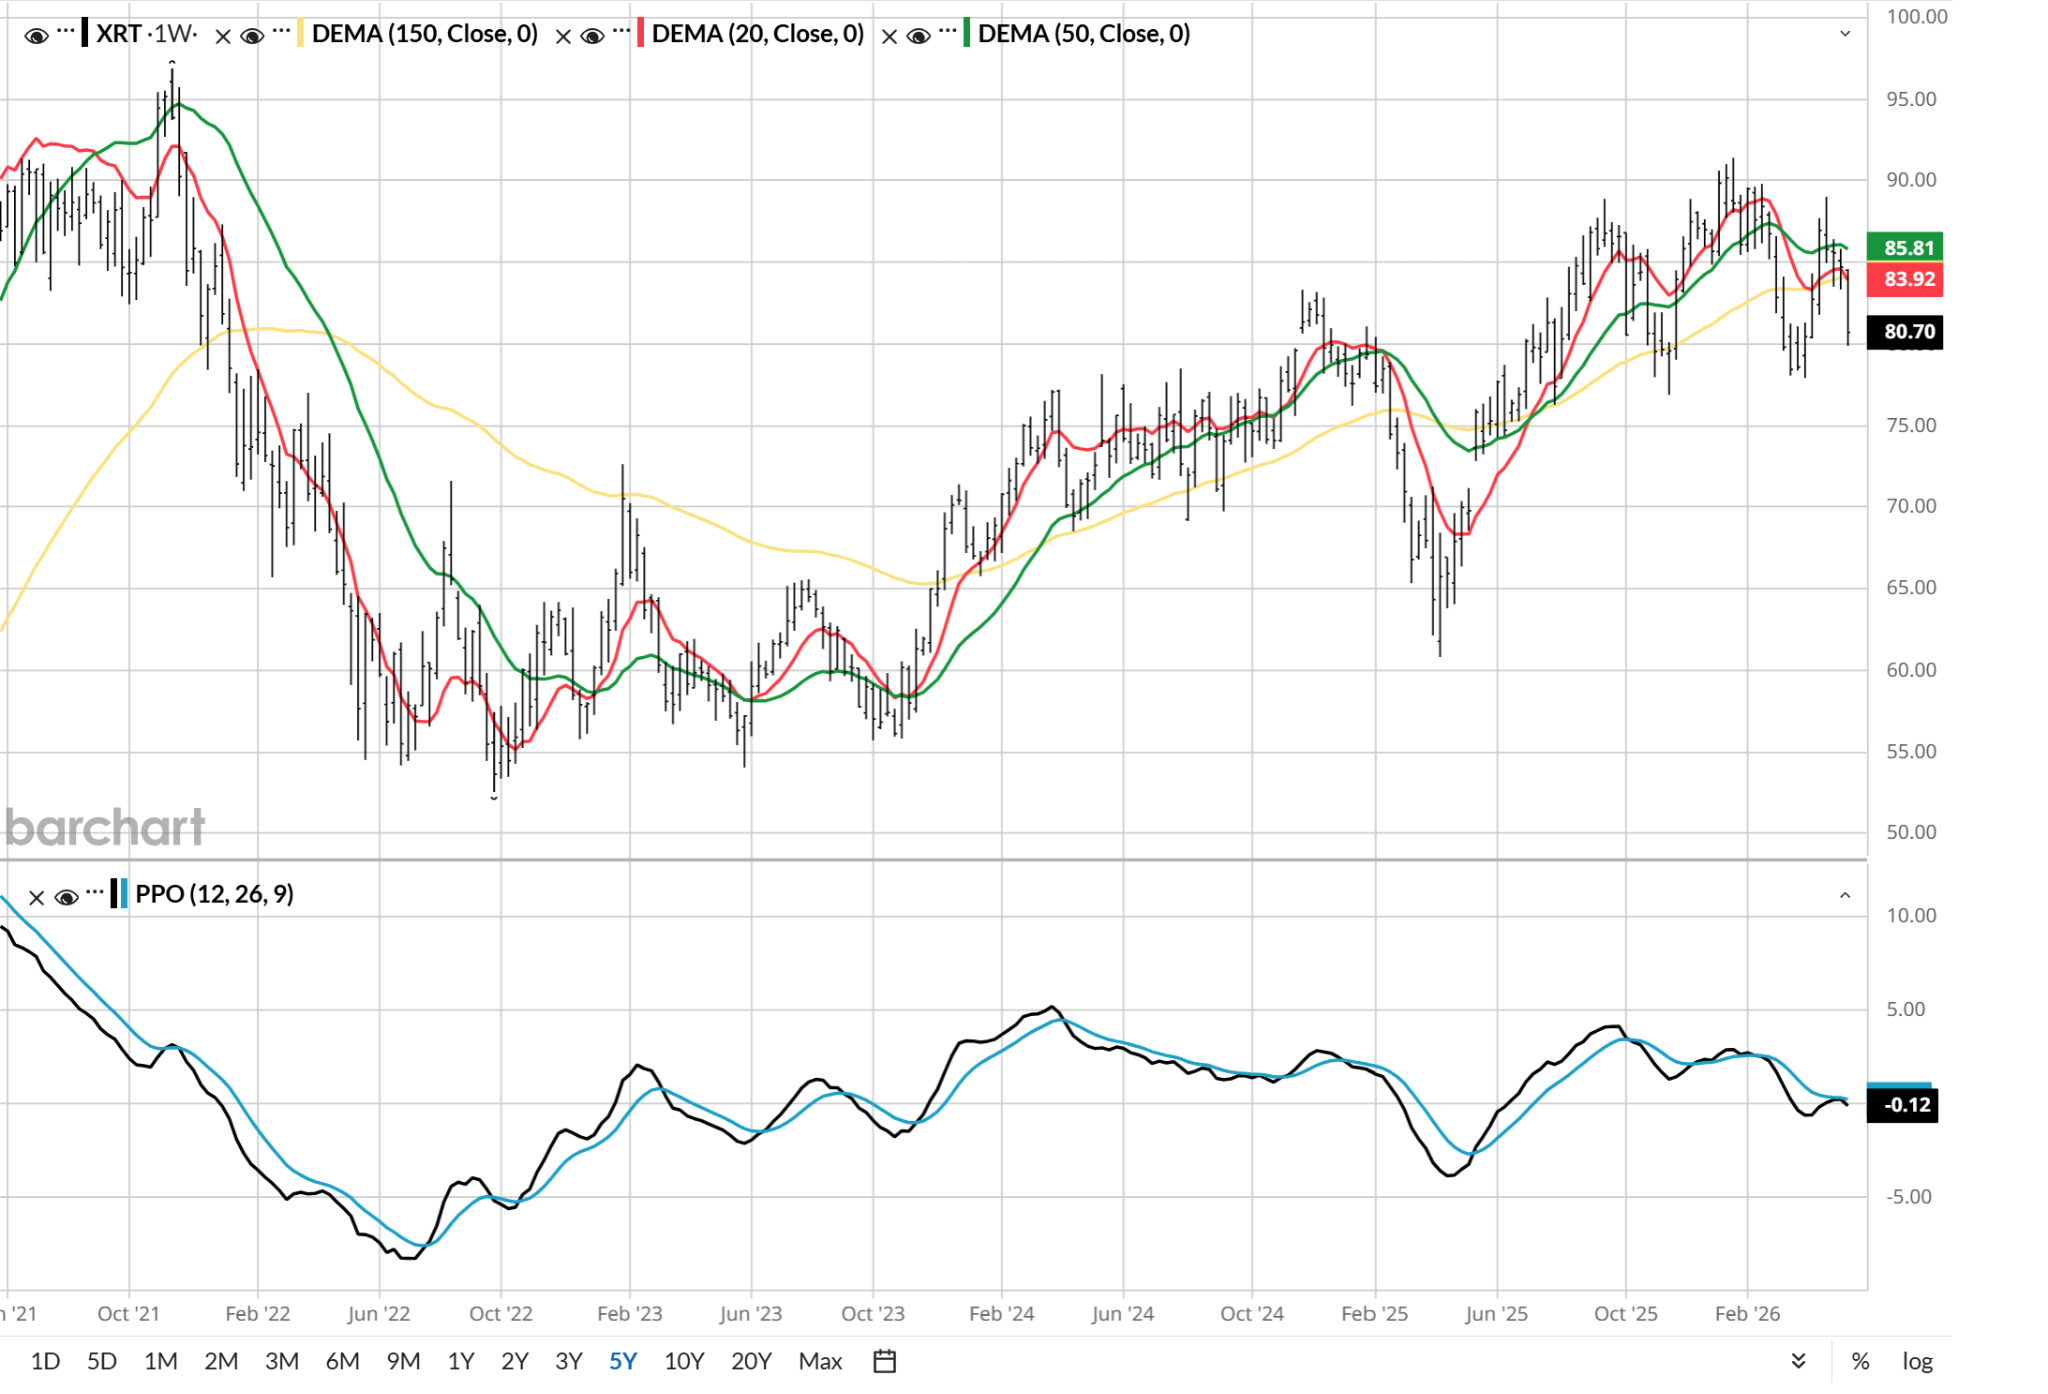
The weekly view could potentially provide a counter, and allow me to conclude that XRT is more likely a pullback than a “get out of the way” situation. But that’s not the case here. I don’t like that wilting PPO (lower section of chart), nor the recent downward relapse in the 20-day moving average (in red, top of chart).
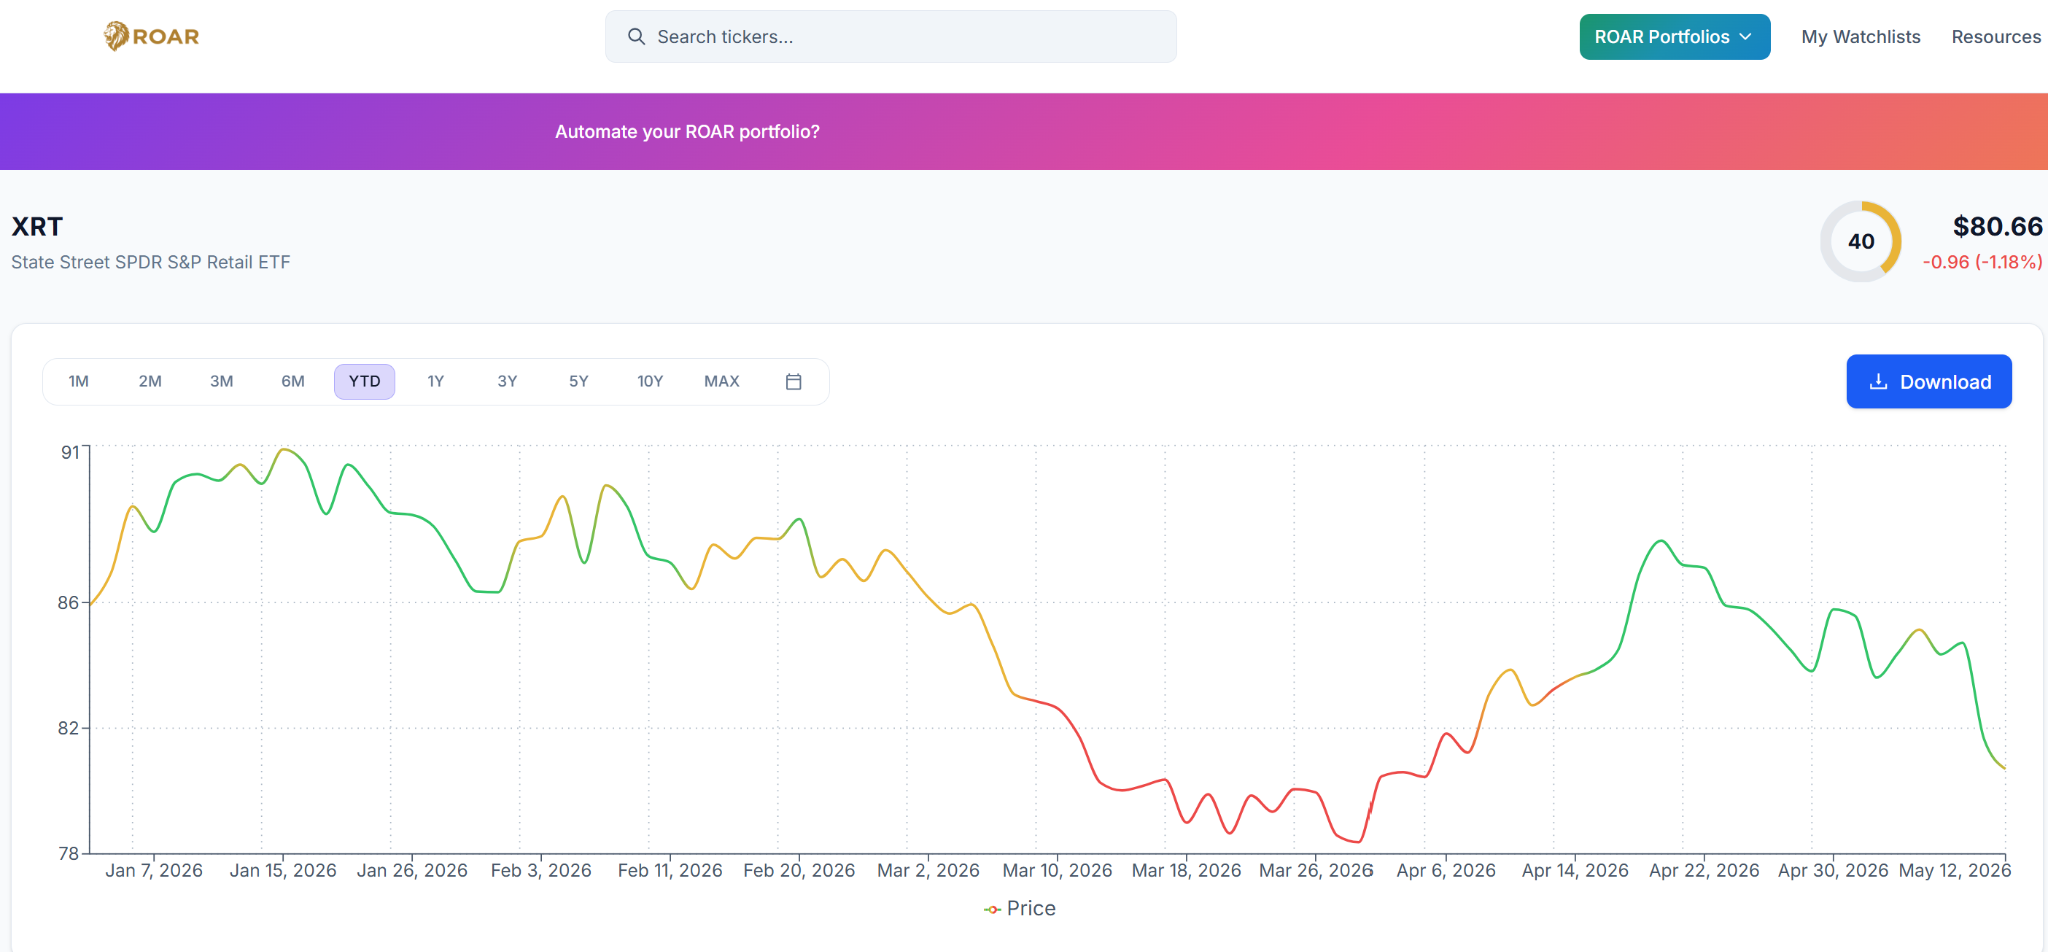
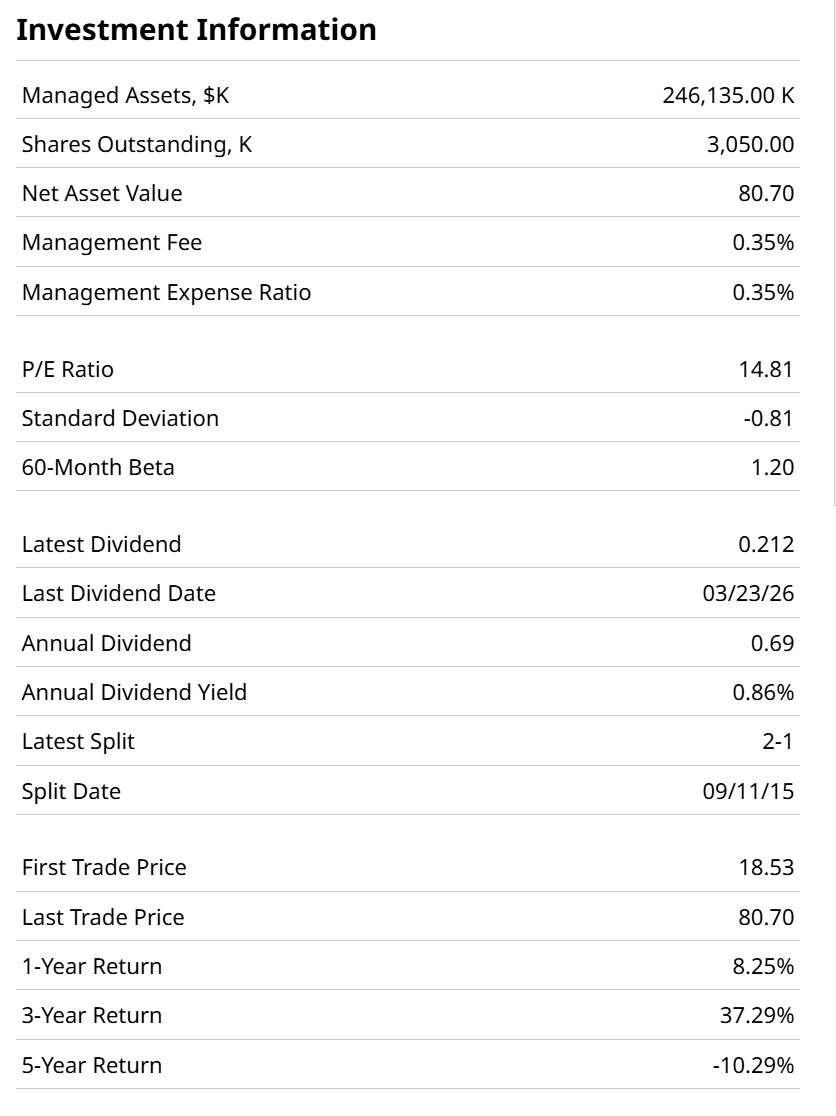
My ROAR Score analysis for XRT adds to my concern for this $246 million ETF. It just left the low risk (green zone) and is transitioning. Currently at a ROAR Score of 40 (yellow/neutral zone), the chart suggests that’s a pit stop on the way lower. XRT has gone from 80 to 40 in just 10 trading days. When a ROAR Score slides slowly down, it has a better chance of recovering quickly than when it collapses as this one just did.
It is not a valuation issue, per se. XRT’s stock basket trades at under 15x trailing earnings. Not bad at all.
However, unlike some other retail ETFs, there’s no mega-cap heroes to dominate the trading and performance charts, masking the weakness of the rest of the gang. This market continues to be characterized by a few big stocks obscuring the deterioration underneath.
For much of this year, retail sales forecasts remained optimistic, with the National Retail Federation (NRF) projecting 4.4% annual growth. However, the “boots on the ground” data for May suggests a more painful divergence.
Goldman Sachs has twice revised its 2026 discretionary cash inflow (DCF) projections downward, now forecasting just 3.7% growth compared to an initial 5.1% estimate. And of course, the headlines have been blaring about the price of oil. That’s starting to have greater impact, directly into consumer wallets.
Higher energy and food costs are forcing the lowest-income households to cut back. Consumer sentiment survey data shows that 66% of those expecting their finances to worsen plan to cut back on eating out, while 54% are slashing their clothing and fashion budgets.
Because XRT uses an equal-weighted methodology, it avoids the Amazon (AMZN) and Walmart (WMT) distortion in other ETFs, and provides a true look at the broad retail landscape. It spans from automotive to specialty electronics. This ETF/index construction means the ETF acts more like a mid-cap fund, making it highly sensitive to the credit-strained average consumer.
The reality is that the resilient consumer of 2025 has been replaced by a much more defensive one in 2026. It all adds up to XRT appearing to have more room to fall. For those who have been waiting for the retail sector to stop fighting the tape, it looks to me that finally, the tape is winning.
Rob Isbitts created the ROAR Score, based on his 40+ years of technical analysis experience. ROAR helps DIY investors manage risk and create their own portfolios. For Rob’s written research, check out ETFYourself.com.
On the date of publication, Rob Isbitts did not have (either directly or indirectly) positions in any of the securities mentioned in this article. All information and data in this article is solely for informational purposes. For more information please view the Barchart Disclosure Policy here.
More news from Barchart
- 1 Rapidly Deteriorating ETF Screams That ‘Shop ‘Til You Drop’ Americans Have All But Keeled Over
- Yield Is No Longer King: What These 5 Dividend ETFs Are Telling Investors
- Michael Burry Says the Stock Market Has ‘Jumped the Shark.’ If He’s Right, This ETF Will Be Your Chum.
- The AI Boom Needs Real Assets to Survive. This ETF Lets You Profit From Both.