
Quantum computing company IonQ (NYSE: IONQ) reported Q3 CY2025 results topping the market’s revenue expectations, with sales up 222% year on year to $39.87 million. The company’s full-year revenue guidance of $108 million at the midpoint came in 18.4% above analysts’ estimates. Its non-GAAP loss of $0.17 per share was 15.8% above analysts’ consensus estimates.
Is now the time to buy IonQ? Find out by accessing our full research report, it’s free for active Edge members.
IonQ (IONQ) Q3 CY2025 Highlights:
- Revenue: $39.87 million vs analyst estimates of $26.98 million (222% year-on-year growth, 47.8% beat)
- Adjusted EPS: -$0.17 vs analyst estimates of -$0.20 (15.8% beat)
- Adjusted EBITDA: -$48.91 million vs analyst estimates of -$58.31 million (-123% margin, 16.1% beat)
- The company lifted its revenue guidance for the full year to $108 million at the midpoint from $91 million, a 18.7% increase
- EBITDA guidance for the full year is -$211 million at the midpoint, below analyst estimates of -$199.3 million
- Operating Margin: -423%, up from -429% in the same quarter last year
- Free Cash Flow was -$128.3 million compared to -$22.98 million in the same quarter last year
- Market Capitalization: $18.55 billion
Company Overview
Founded by quantum physics pioneers from the University of Maryland and Duke University in 2015, IonQ (NYSE: IONQ) develops quantum computers that process information using trapped ions to solve complex computational problems beyond the capabilities of traditional computers.
Revenue Growth
Reviewing a company’s long-term sales performance reveals insights into its quality. Any business can put up a good quarter or two, but the best consistently grow over the long haul.
With $79.84 million in revenue over the past 12 months, IonQ is a small player in the business services space, which sometimes brings disadvantages compared to larger competitors benefiting from economies of scale and numerous distribution channels. On the bright side, it can grow faster because it has more room to expand.
As you can see below, IonQ’s sales grew at an incredible 251% compounded annual growth rate over the last four years. This is an encouraging starting point for our analysis because it shows IonQ’s demand was higher than many business services companies.
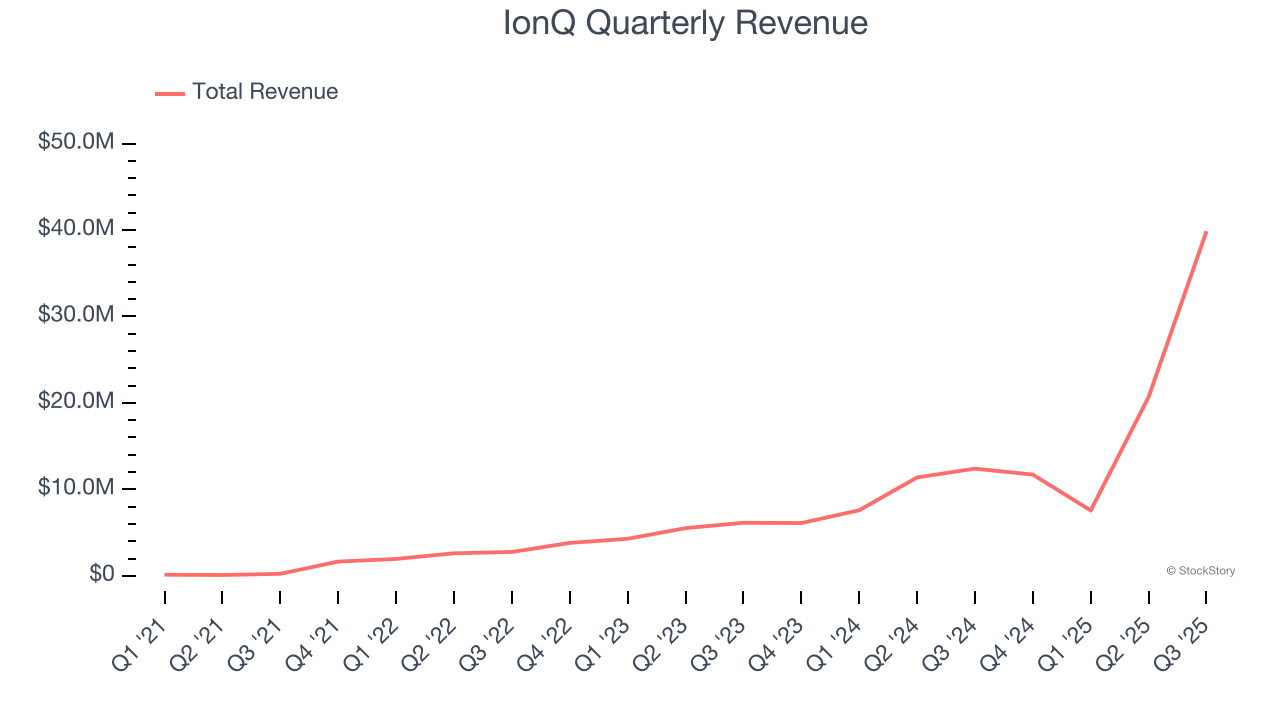
We at StockStory place the most emphasis on long-term growth, but within business services, a stretched historical view may miss recent innovations or disruptive industry trends. IonQ’s annualized revenue growth of 101% over the last two years is below its four-year trend, but we still think the results suggest healthy demand. 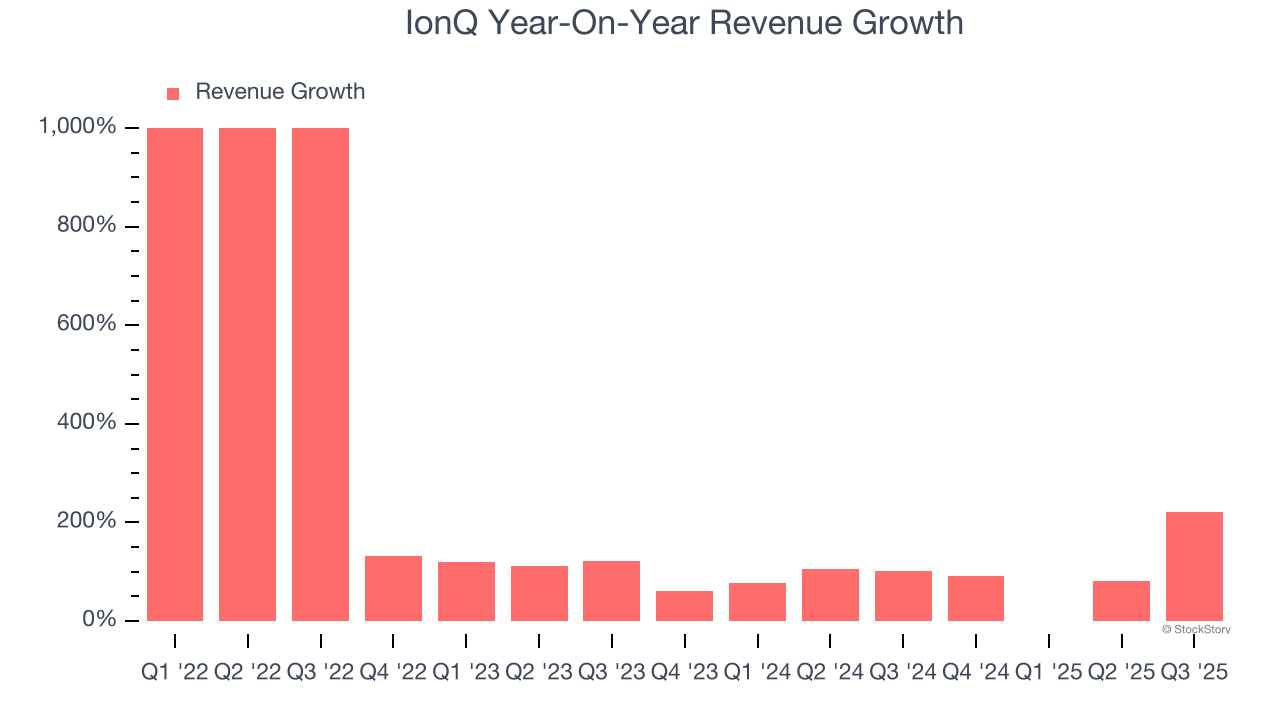
This quarter, IonQ reported magnificent year-on-year revenue growth of 222%, and its $39.87 million of revenue beat Wall Street’s estimates by 47.8%.
Looking ahead, sell-side analysts expect revenue to grow 90.7% over the next 12 months, a deceleration versus the last two years. Still, this projection is healthy and suggests the market sees success for its products and services.
Software is eating the world and there is virtually no industry left that has been untouched by it. That drives increasing demand for tools helping software developers do their jobs, whether it be monitoring critical cloud infrastructure, integrating audio and video functionality, or ensuring smooth content streaming. Click here to access a free report on our 3 favorite stocks to play this generational megatrend.
Operating Margin
Operating margin is a key measure of profitability. Think of it as net income - the bottom line - excluding the impact of taxes and interest on debt, which are less connected to business fundamentals.
IonQ’s high expenses have contributed to an average operating margin of negative 628% over the last five years. Unprofitable business services companies require extra attention because they could get caught swimming naked when the tide goes out.
On the plus side, IonQ’s operating margin rose over the last five years, as its sales growth gave it operating leverage. Still, it will take much more for the company to reach long-term profitability.
This quarter, IonQ generated a negative 423% operating margin.
Earnings Per Share
Revenue trends explain a company’s historical growth, but the change in earnings per share (EPS) points to the profitability of that growth – for example, a company could inflate its sales through excessive spending on advertising and promotions.
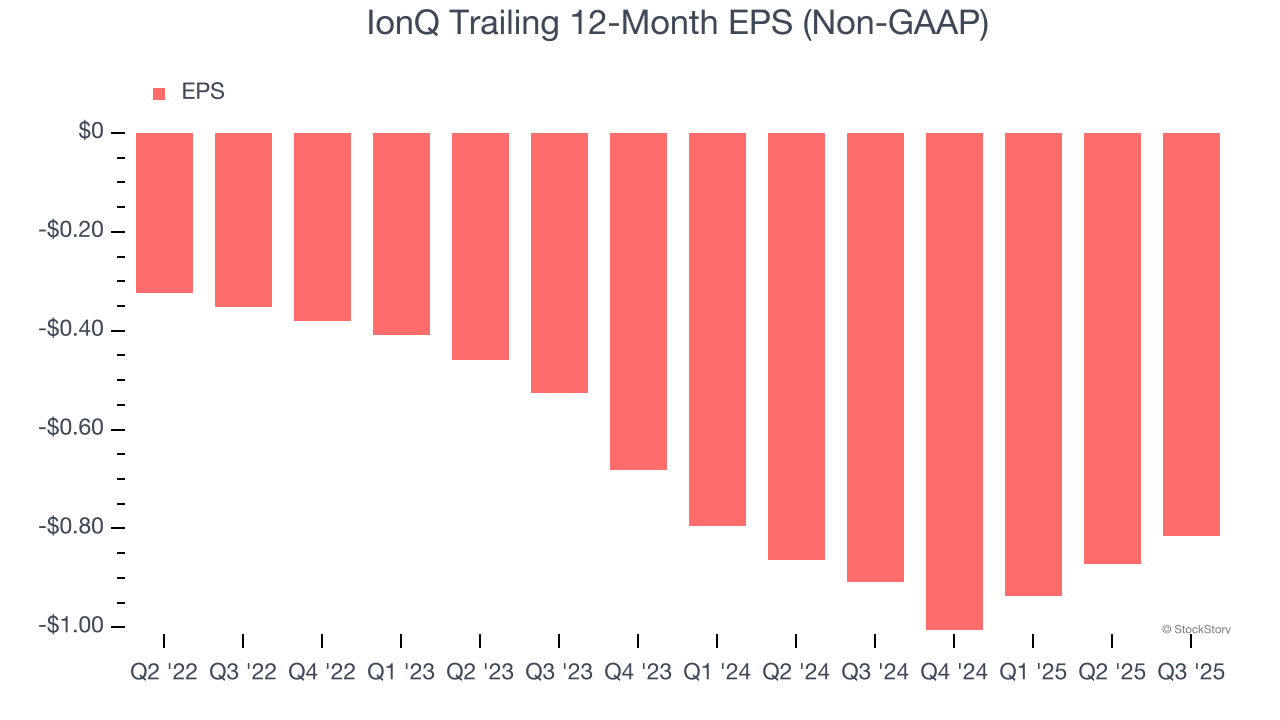
IonQ’s earnings losses deepened over the last two years as its EPS dropped 24.5% annually. We’ll keep a close eye on the company as diminishing earnings could imply changing secular trends and preferences.
In Q3, IonQ reported adjusted EPS of negative $0.17, up from negative $0.23 in the same quarter last year. This print easily cleared analysts’ estimates, and shareholders should be content with the results. Over the next 12 months, Wall Street expects IonQ to perform poorly. Analysts forecast its full-year EPS of negative $0.82 will tumble to negative $0.97.
Key Takeaways from IonQ’s Q3 Results
It was good to see IonQ beat analysts’ EPS expectations this quarter. We were also excited its revenue outperformed Wall Street’s estimates by a wide margin. Zooming out, we think this quarter featured some important positives. The stock traded up 4% to $57.58 immediately after reporting.
IonQ had an encouraging quarter, but one earnings result doesn’t necessarily make the stock a buy. Let’s see if this is a good investment. If you’re making that decision, you should consider the bigger picture of valuation, business qualities, as well as the latest earnings. We cover that in our actionable full research report which you can read here, it’s free for active Edge members.