Precision motion systems specialist Allient (NASDAQ: ALNT) reported Q3 2026 results beating Wall Street’s revenue expectations, with revenue up 18.5% year on year to $164.4 million. Its non-GAAP profit of $1.07 per share was 45.1% above analysts’ consensus estimates.
For more on Allient, read our free full research report.
Allient (ALNT) Q3 2026 highlights:
- Revenue $164.4 million vs S&P analysts’ consensus estimates of $155.3 million (18.5% year-on-year growth, 5.9% beat)
- Adjusted EPS $1.07 vs S&P analysts’ consensus estimates of $0.74 (45.1% beat)
- Adjusted EBITDA $29.65 million vs analysts’ consensus estimates of $23.22 million (18% margin, 27.7% beat)
- Operating margin 13.6%, up from 9.4% in the same quarter last year
- Free cash flow -$1.61 million, down from $2.78 million in the same quarter last year
- Backlog $351.5 million at quarter end, up 52.2% year on year
- Market capitalization $1.50 billion
“We delivered an outstanding third quarter, with record revenue and margins demonstrating the earnings power of a stronger, more efficient Allient,” commented Dick Warzala, Chairman and CEO. “Higher volume, favorable mix and continued operational improvements drove an 83% increase in operating income and more than doubled net income. Our Simplify to Accelerate NOW strategy is helping us translate stronger demand into improved profitability while continuing to invest in capacity, technology and productivity.
Revenue growth
Examining a company’s long-term performance can provide clues about its quality. Any business can deliver a good quarter or two, but the best consistently grow over the long haul. Allient’s revenue grew at a decent 8.5% compounded annual growth rate over the last five years. Its growth was slightly above that of the average industrials company and shows its offerings resonate with customers.
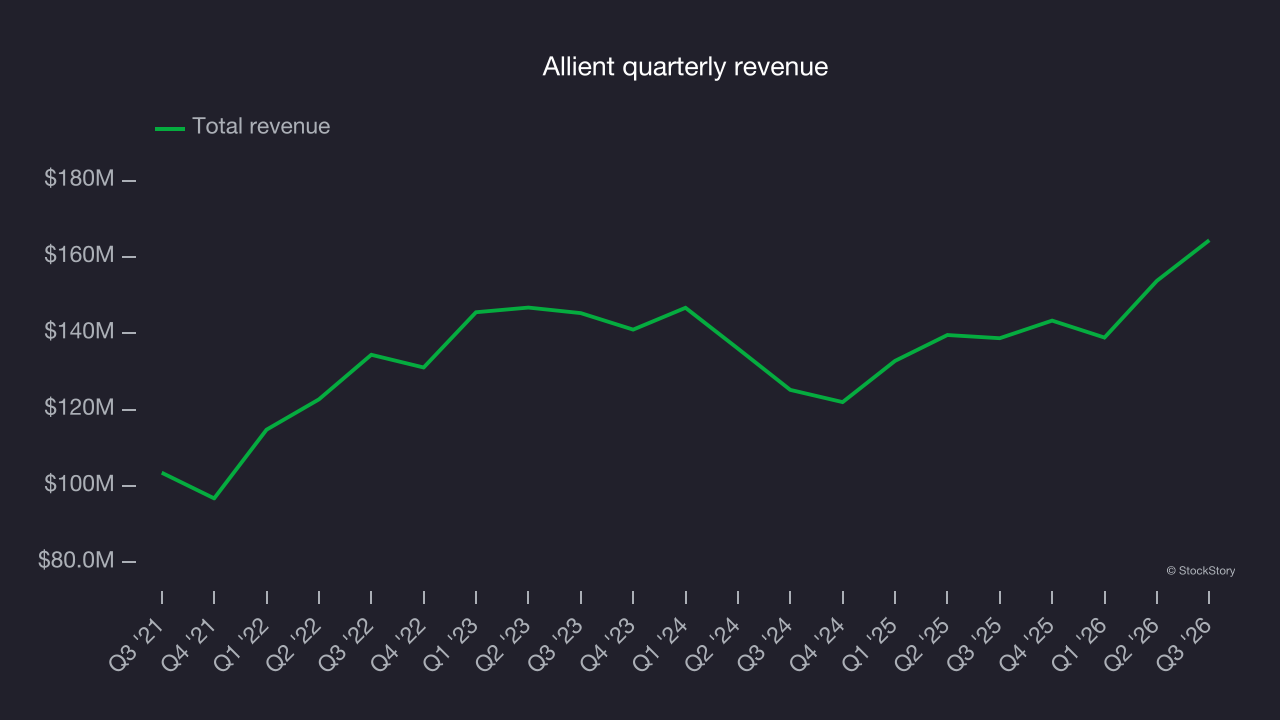
Long-term growth matters most, but within industrials, a half-decade historical view may miss cycles, industry trends or a company capitalizing on catalysts such as a new contract win or a successful product line. Allient’s recent performance shows its demand has slowed as its annualized revenue growth of 4.6% over the last two years was below its five-year trend. Decelerating revenue growth in the sector warrants caution, as it could signal changing consumer tastes aided by low switching costs. 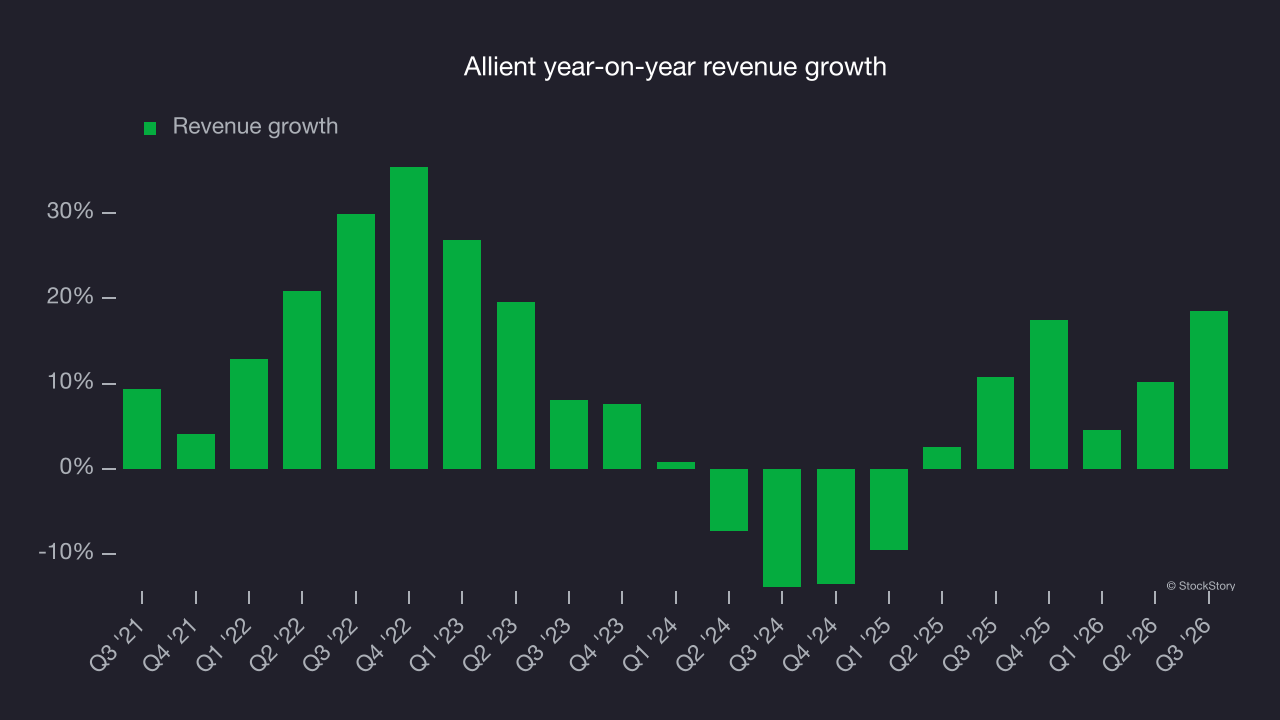
This quarter, Allient reported year-on-year revenue growth of 18.5%, and its $164.4 million of revenue exceeded Wall Street’s consensus estimates by 5.9%.
Looking ahead, sell-side analysts expect revenue to grow 7.5% over the next 12 months, according to S&P. While this projection implies its newer products and services will fuel better top-line performance, it is still below the sector average.
Operating margin
Allient was profitable over the last five years but held back by its large cost base. Its average operating margin of 7.7% was weak for an industrials business.
On the positive side, Allient’s operating margin rose by 4 percentage points over the last five years, as its revenue growth provided operating leverage.
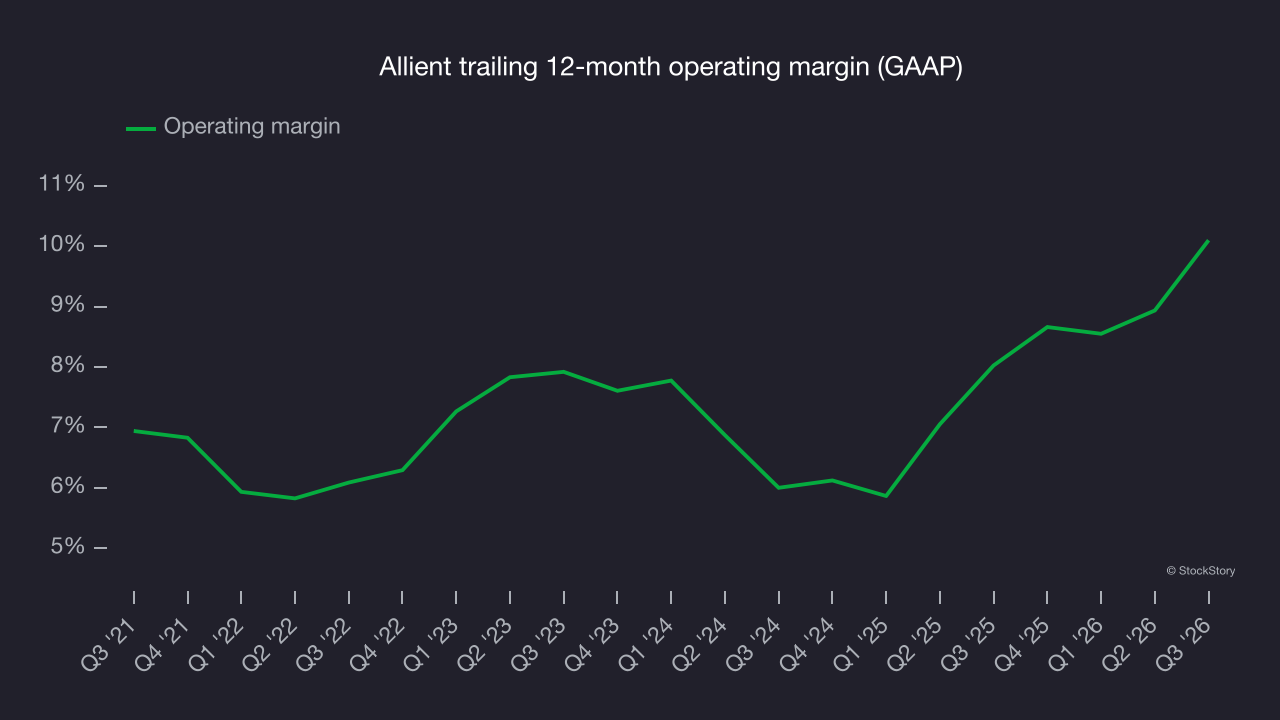
This quarter, Allient reported an operating margin of 13.6%, up 4.2 percentage points year on year. The increase was a positive sign, and operating margin outpaced gross margin, indicating greater efficiency in expenses such as marketing, R&D and administrative overhead.
Earnings per share
We track the long-term change in earnings per share, or EPS, for the same reason as long-term revenue growth. Compared to revenue, however, EPS highlights whether a company’s growth is profitable.
Allient’s EPS grew at a compounded annual rate of 18.6% over the last five years, higher than its 8.5% annualized revenue growth. This indicates the company became more profitable on a per-share basis as it expanded.
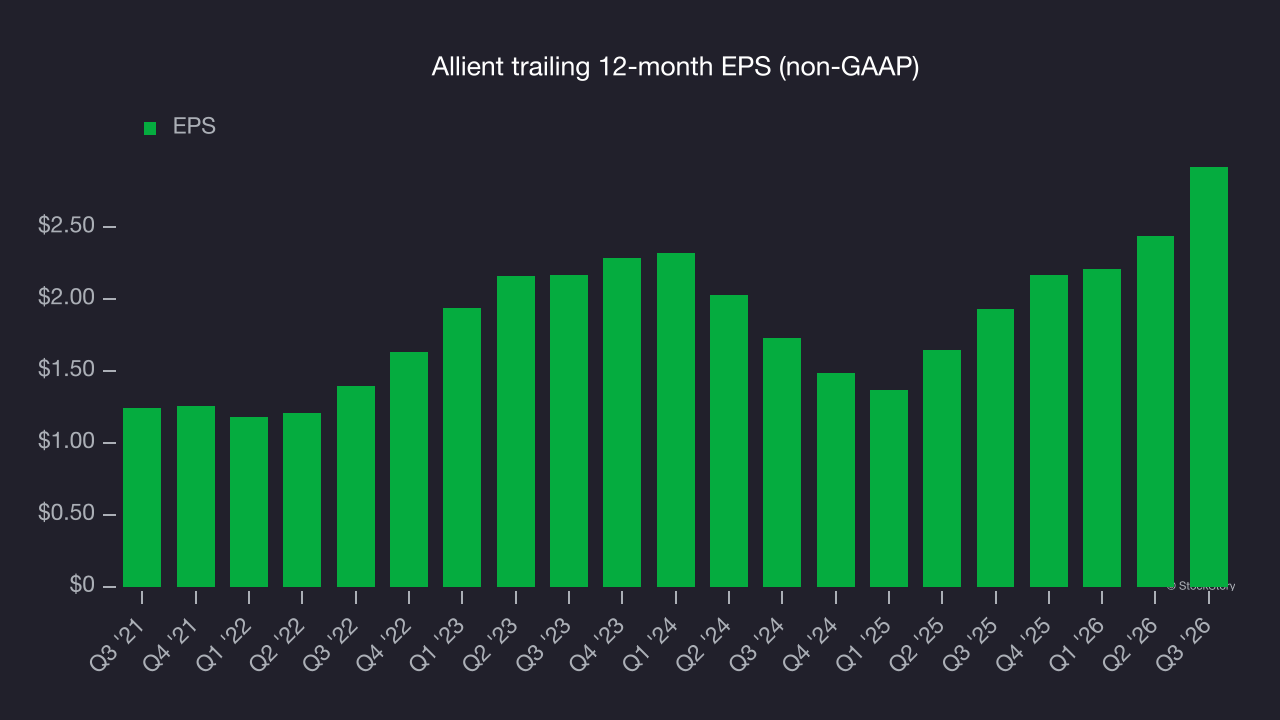
Examining Allient’s quality of earnings can provide a better understanding of its performance. As we mentioned earlier, Allient’s operating margin expanded by 4 percentage points over the last five years. This was the most relevant factor (aside from the revenue impact) behind its higher earnings; interest expenses and taxes can also affect EPS but don’t tell us as much about a company’s fundamentals.
As with revenue, we analyze EPS over a more recent period because it can provide insight into an emerging theme or development for the business.
Allient’s two-year annual EPS growth of 29.9% was higher than its five-year trend. That acceleration is a positive sign, especially given the already high base.
In Q3, Allient reported adjusted EPS of $1.07, up from $0.59 in the same quarter last year. That comfortably exceeded analysts’ consensus estimates, a positive result for shareholders. Over the next 12 months, Wall Street expects Allient’s full-year EPS to grow 9.1% from $2.92 to $3.19, according to S&P.
Key takeaways from Allient’s Q3 results
Allient delivered a solid quarter, with EBITDA beating Wall Street’s consensus estimates by a wide margin and EPS also topping analysts’ consensus expectations. Shares rose 2.7% to $81.66 immediately after the release.
Allient may have had a good quarter, but that alone does not make the stock a buy. That decision should take into account its valuation, business quality and latest quarterly results. Read the full research report here (it’s free).